
Guest post by Alec Rawls
Here is the puzzle, as noted by Nigel Calder and others: how can BEST insist that a modicum of additional evidence of late 20th century warming should put skepticism of the CO2-warming theory to rest, while at the same time admitting that they never even tried to examine the possible causes of warming?
Elizabeth Muller’s press statement in support of anti-CO2 alarmism is extreme:
Elizabeth Muller, co-founder and Executive Director of Berkeley Earth, said she hopes the Berkeley Earth findings will help “cool the debate over global warming by addressing many of the valid concerns of the skeptics in a clear and rigorous way.” This will be especially important in the run-up to the COP 17 meeting in Durban, South Africa, later this year, where participants will discuss targets for reducing Greenhouse Gas (GHG)emissions for the next commitment period as well as issues such as financing, technology transfer and cooperative action.
She is strongly implying that BEST’s findings not only support the CO2 theory of late 20th century warming, but justify radical worldwide government action to reduce carbon emissions.
Richard Muller’s statement of ignorance on the cause of the observed warming is equally absolute:
What Berkeley Earth has not done is make an independent assessment of how much of the observed warming is due to human actions.
Contradictory, yes, but also explanatory. Muller et al. must be so ignorant of this climate science subject that they are brand-new to that they are not even aware that the leading competing climate theory, where solar-magnetic activity modulates cloud formation, also predicts and explains late 20th warming. All they know is that the CO2 theory predicts warming, prompting them to see evidence of warming as evidence for that theory.
This is the only logical explanation for Muller vs. Muller, and it would also explain why BEST made such a complete hash of the only part of their data that does have any power to discriminate between CO2-warming and solar-warming.
Opposite temperature predictions for quiet-sun era
If late 20th century warming was mostly caused by the industrial release of atmospheric CO2, then warming should be continuing apace, but if 20th century warming was mostly caused by the 80 year grand maximum of solar activity that waned in the 1990’s and ended in 2005, then planetary temperature (as measured by the heat content of the oceans) should have been falling for several years now. In a less smooth way, surface temperatures would also be passing the peak of the Modern Warm period.
Nature is right now conducting an ideal experiment for determining which theory is right, but on this crucial part of the temperature record—what happened when solar activity waned and then dropped into the cellar—BEST’s presentation is remarkably confused. The sample station analysis that they released shows substantially more post-98 cooling than any of the other land records, while their full data set has recent temperatures going up compared to the other records.
Here is a zoom-in on figure 1 from BEST’s “decadal variations” paper. It shows the most recent temperatures for a sub-sample of temperature stations (“[this] Berkeley Earth data were randomly chosen from 30,964 sites that were not used by the other groups”):

Wow, this sub-sample really favors the sun as the primary driver of climate, certainly compared to the NOAA, GISS and Hadley evidence. The BEST temperatures are equal or above the other temperature records throughout the 80’s and 90’s, then drop precipitously below them over the last ten years, as the sun has gone quiet.
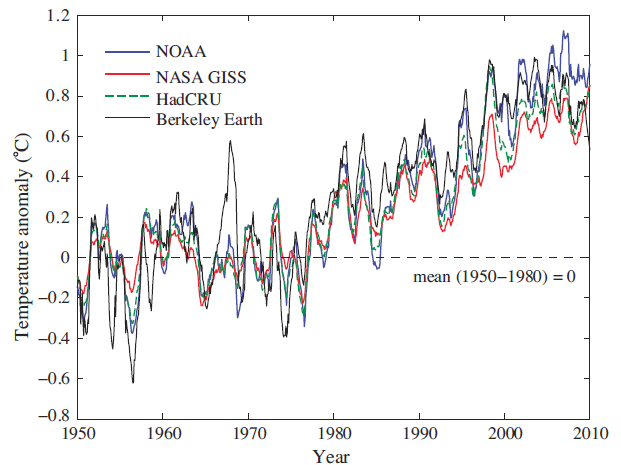
BEST’s full data set tells the opposite story. Here is their 12 month average surface temperature (figure 8 from their “Temperature Averaging Process” paper):

The second part of figure 8 shows the differences. NOAA and GISS both drop off a couple of tenths of a degree relative to BEST after 2000, while Hadley drops off about a half a degree!

Wow, compared to the evidence provided by the other temperature records, BEST’s full sample really favors the CO2 theory over this critical period. Thus on the only part of the temperature record that is probative, BEST displays two strongly contradictory graphs without a word of commentary. That’s a pretty good sign that they are oblivious to the discriminatory power of this part of the record, indicating again that they are not even aware of the GCR-cloud theory and its implications. No wonder they can do such incredibly biased things as calling “the late part of the 20th century,” “the anthropogenic era” (p. 30). Anthropogenic warming is their premise.
BEST evidence is not best evidence
Almost all of the heat capacity of the biosphere is in the oceans. Thus climate change over time means a change in ocean heat content. Land surface temperature is a volatile expression of this global temperature, depending on whether colder or warmer ocean currents are at the surface. That volatility makes surface temperatures an iffy way to track climate change, and today, better evidence is available.
In recent years, ARGO’s automated fleet of temperature sounding devices provides much improved direct measurement of ocean temperature. According to NOAA, data from these floats show ocean heat content for the top 700 meters as close to flat for about 10 years now:

(Bob Tisdale says that NOAA has recently started reporting heat content for the top 2000 meters, but apparently it is still a work in progress, as they don’t display it on their heat content page.)
Ocean heat content can also be measured by sea level, which is determined by the thermal expansion of the oceans, plus net land-ice melt. Here is NOAA’s sea level data, compensated for land-ice melt and variations in salinity. It shows ocean heat content as roughly flat for about the last eight years:

This best evidence indicates that global warming has stopped, which militates against the CO2 theory of late 20th century warming, but the oceans do not show the global cooling that the solar-theory predicts, so it does not clearly favor the cosmic-ray-cloud hypothesis either. The very latest sea level data, however, may finally be telling the tale:

Steve Goddard, September 2011: “The latest sea level numbers are out, and Envisat shows that the two year long decline is continuing, at a rate of 5mm per year.”
That’s actual sea level, not steric sea level. Subtract out the ongoing land-ice melt from our currently warm climate and thermosteric sea level is falling even more rapidly. If cosmic-ray-cloud effects do dominate CO2 effects, we’ll probably have full proof within the next couple of years.
Can BEST actually be unaware of the cosmic-ray-cloud theory, or are they just accepting the CO2-alarmists’ excuses for dismissing solar effects?
Unless Muller is a world-class fruitcake, he can’t have waded into the climate arena without at least being aware of Svensmark’s theory. He must also know that the sun has gone quiet, and his Nobel-physics brain would be able to figure out how this natural experiment provides a test of which theory is right. Yet he might still act as if he is unaware of solar warming theory if he has been convinced by the alarmists’ bogus excuses for why recent warming can’t have been caused by the sun.
Over and over, these folks claim that late 20th century cannot have been caused by the sun because solar activity was not rising over this period. e.g. Rasmus Benestad, 2005:
A further comparison with the monthly sunspot number, cosmic galactic rays and 10.7 cm absolute radio flux since 1950 gives no indication of a systematic trend in the level of solar activity that can explain the most recent global warming.
That reasoning obviously requires an assumption that ocean temperatures had equilibrated to the high level of 20th century solar forcing by 1950. Otherwise the continued high level of solar forcing (the hypothesis under consideration) would cause continued warming until ocean equilibrium was reached. Yet Benestad did not even acknowledge this assumption, never mind make any case for it, and this has been the pattern.
I have written several posts on the alarmists’ excuses for dismissing the solar explanation and how they utterly fail to stand up to scrutiny. But without even going into those details, the more basic point is that the various rationales for dismissing the solar warming hypothesis are theoretical. They are, in effect, part of the CO2 warming theory. Our recently quiet sun offers a test of which theory makes the right prediction. To ignore that test because one already agrees with one of the theories, as BEST seems to be doing, is to put theory over evidence, the opposite of what scientists are supposed to do.
To Bob Tisdale,
Lighten up, dude…let the debate and conversation proceed without your self-aggrandizement and anger. N’uff said.
ferd berple says:
October 28, 2011 at 7:17 pm
Nope. When solar scientists can explain the 100k year anomaly, then we have a starting point in terms of TSI. The problem for solar scientists is that some of the public still remember when solar scientists argued long and loud that Milankovitch was wrong
The Milankovic cycles have nothing to do with the Sun, but with the orientation and shape of the Earth’s orbit. No solar physicist has ever argued otherwise. When skeptics don’t get the basic facts right, their opinion carries no weight.
I hate to say this … but this is true: author Rawls is writing as a magician plays with your mind. After reading the article, you are looking and thinking about the illusion because he has skillfully misdirected your attention. As a mathematician, there is noise and there is signal. A skilled writer will get you to confuse the two, thinking about the noise as signal and vice versa. Bravo to this skilful magician, Alec Rawls.
LazyTeenager says:
October 28, 2011 at 5:32 pm
Our recently quiet sun offers a test of which theory makes the right prediction.
———-
“Does that mean that if the next 1-5 years see
thea warming trendcontinue“resume” over that period and the decreasing and reversing rate of rise in sea levels trendcontinuereverses again to a positive rate, that you will agree that you are wrong and that climate scientists are right?”[corrected to offset laziness]
I wouldn’t, because, 1] then attributing the sea level and temp. rise to CO2 by default or by an “argument from ignorance” does not consider the possibility that other factors, such as cloud extent and placement and the null hypothesis are still in play, even though Svensmark’s mechanism might not be present; and 2] the CO2 = CAGW hypotheses have not yielded even one relevant correct empirical prediction yet: in particular, have they predicted the corrected description of the record above in conjunction with the extention you now predict?
Lazy, are you so lazy that you must repeat the same memes over and over in hopes that they will become true….“someday”? Or are you getting paid to do so? Or what?
It is unfortunate to describe the problem of recent global warming as bi-modal: ie, The cause can be resolved to either Anthropogenic CO2 or the Sun, but not to both nor to some third unknown cause. We are talking about a complex system of many moving parts, so to speak. It is a priori unlikely that just one process is in play.
Certainly some warming from rising CO2, perhaps dampened by negative feedbacks (eg clouds) may be present.
Certainly the various ocean oscillations (eg ENSO, AMO, and PDO) exist and create variations that may dwarf and obscure signals from CO2 or the Sun.
Proving the Cosmic Ray/Solar interactions as an important cause by matching up Global Temps with Sunspots or other index of solar activity will be hard to do because of uncertain lag times, coincidental ocean oscillations coming in and out of phase, and so on. Indeed, if sufficiently many difficult to measure and/or predict variables are at work, then we may need to acknowledge that the Earth’s climate variability, within a range of a few degrees Kelvin, is chaotic and the exact forcings and sensitivities will never be fully teased apart.
We still cannot measure temps reliably either on a local or global scale; on land, in the sea at various depths, nor in the air at various heights. All of the proxies for temps in the historic record are suspect. So compared to the more mature hard sciences (think chemistry or physics) we cannot even agree on what climate data are useful.
Scientists, as opposed to Post Normal Scientists, should begin every communication on climate acknowledging that the science of climate is in its infancy, that nothing is certain or settled, but that perhaps after a few more decades of good study and open discussion, we will figure out some of the major questions. So many scientists these days come across as self-assured blowhards, which makes me sad.
Presntis says:
October 28, 2011 at 9:15 pm
To Bob Tisdale,
Lighten up, dude…let the debate and conversation proceed without your self-aggrandizement and anger. N’uff said.
My my, Presntis, you certainly must have led a very sheltered life – from exposure to real scientific and rational debate, that is. Do you perhaps find such discourse “offensive” or “intolerant”?
I refer you to Willis Eschenbach’s post “What the BEST data actually says”. Below is the graph he plotted.
http://wattsupwiththat.files.wordpress.com/2011/10/best-satellite-and-other-land-temperature.jpg?w=581&h=644
According to Willis, BEST’s temp record has temps rising more than the official records for the last few years.
It’s interesting to note that sea level in the graphs you provide has been offset for things like glacial melt. Obviously, there is heat going into other things than warming the oceans and expanding them. 85% of glaciers continue to decline, Arctic sea ice is losing volume consistently. A proper accounting of the Earth’s energy budget would incorporate all these metrics instead of using just one. And the oceans are much deeper than 700 meters.
Warming from cosmic-rays/clouds is unlikely, as there has been little change in that metric (solar variance) since the 1950s, and clearly the globe has warmed since then. This time frame is fortuitous because it also lies within period you recommend the temperature data is the clearest (post-1945).
Sorry I won’t be able to continue exchange with Bob or anyone else. Am at airport sans keyboard, trying to chicken peck. Will be incommunicado for ten days. I look forward to a debate on how the intra solar-cycle temperature signal boss and does not necessarily limit the amount of heat that gets tucked away in the oceans. (“boss” should have been “does”. Arrgh. I’m done. Next stop Vietnam!)
There is sun in the graphs, but is not what you see through your sunglasses:
http://www.vukcevic.talktalk.net/CDr.htm
Presntis says: “Lighten up, dude…let the debate and conversation proceed without your self-aggrandizement and anger. N’uff said.”
There’s no “self-aggrandizement and anger” in any of my comments on this thread.
Alec rawls says: “Sorry I won’t be able to continue exchange with Bob or anyone else. Am at airport sans keyboard, trying to chicken peck. Will be incommunicado for ten days.”
Feel free to use my October 28, 2011 at 6:51 pm comment as a starting point for your next post here at WUWT. There no reason to come back to this thread in ten days.
ferd berple says: “If you download the Global Marine Alta from Argo’s website…”
How are the graphic capabilities of the software? Can it create temperature anomaly profiles at depth similar to this?
http://www.ecmwf.int/products/forecasts/d/charts/ocean/real_time/xzmaps/
Or this?
http://www.ecmwf.int/products/forecasts/d/charts/ocean/real_time/yzmaps/
With the last example, that’s a snapshot of temperature anomalies along a given longitude. Will the Global Marine Atlas software allow me to average the temperatures for the entire Pacific basin, say from 120E to 120W? I’d like to animate Meridional Overturning Circulation on a basin basis in an effort to see how the depths of 700-2000 meters are warming faster than the depths of 0-700 meters.
Is there really an organization that is monitoring all 160,000 glaciers throughout the world? Where can I see their data?
The CERN research is fascinating, but its relevance to climate change may be less than most of the respondents to this article suggest. This may be the case for several reasons:
1) Even if it can be demonstrated that cosmic rays do somehow promote cloud formation, still the effect of clouds on global temperatures is problematic. Clouds lower global temperature through their albedo effect, and raise temperature as greenhouse gases. Higher altitude clouds seem to raise temperatures and lower level clouds seem to lower it. The composition of clouds (water particles or ice particles) and their density are also important factors, and different types of cloud formations have different effects. Many scientists have concluded that, paradoxically, this most striking feature of the atmosphere may have only a slight influence, one way or the other, on global temperature.
2) If it can be shown that clouds do significantly raise or lower global temperatures, still, it needs to be shown why this rules out CO2 as being another important factor.
3) If we find that both cloud formation and atmospheric CO2 are influences on global temperature, still we need to discover which factor, if any, is dominant.
So CERN’s research, while valuable and fascinating, will not in itself tell us much about climate change. Its significance will only be found only in its relation to other factors, which are the most problematic ones that climate science has to deal with.
Werner Brozek says:
October 28, 2011 at 6:31 pm
Yes, thanks for pointing that out. Diffcult to compare the last 10 years when BEST has data missing.
This covers the last 10 years of BEST with the time frame covering the error removed.
http://www.woodfortrees.org/plot/best/from:2000.2/to:2010.2/normalise/plot/best/from:2000.2/to:2010.2/normalise/trend/plot/rss/from:2000.2/to:2010.2/normalise/plot/rss/from:2000.2/to:2010.2/normalise/trend/plot/uah/from:2000.2/to:2010.2/normalise/plot/uah/from:2000.2/to:2010.2/normalise/trend
When starting with a La Nina period and ending with a El Nino though is a unfair situation to dudge trends. In this situation all 3 trends have changed with the negative ones becoming positive and the positiive one becoming flat. The ones showing the biggest change are the ones most sensitive to ENSO. (ie the satellite data)
Gary,
Did someone say there was? I don’t believe so. Various groups have collected data kept by various nations. The study below represents one such effort – the sample size and methodology is described.
http://www.ncbi.nlm.nih.gov/pmc/articles/PMC26446/
Wherever and however the data is sampled, different groups come up with similar results.
Bob Tisdale says:
October 28, 2011 at 6:51 pm
……The topic at hand is your assumption that the “the sun as the primary driver of climate”; that is, that the rise in global surface temperature during the 20th Century can be explained by the increase in solar activity to an “80 year grand maximum” and the recent flattening of that temperature can be explained by “the sun has gone quiet.” So let’s take a look at some data. You know me, I like data, and I like to see explanations based on data……
Personally, I can’t see how solar variations could have caused the rise and then flattening in global surface temperatures that you claim. I’ve seen papers that have determined the variation on global temperature for those solar cycles was in the range of 0.2 deg C, yet I don’t think that would be enough to help.
_______________________________________
Bob you are looking at only one variable of the sun. More is changing that TSI
From NASA:
“September 29, 2009: Planning a trip to Mars? Take plenty of shielding. According to sensors on NASA’s ACE (Advanced Composition Explorer) spacecraft, galactic cosmic rays have just hit a Space Age high.
“In 2009, cosmic ray intensities have increased 19% beyond anything we’ve seen in the past 50 years,” says Richard Mewaldt of Caltech.
The cause of the surge is solar minimum, a deep lull in solar activity that began around 2007 and continues today. Researchers have long known that cosmic rays go up when solar activity goes down. Right now solar activity is as weak as it has been in modern times, setting the stage for what Mewaldt calls “a perfect storm of cosmic rays.”
“We’re experiencing the deepest solar minimum in nearly a century,” says Dean Pesnell of the Goddard Space Flight Center, “so it is no surprise that cosmic rays are at record levels for the Space Age.”…..” http://science.nasa.gov/science-news/science-at-nasa/2009/29sep_cosmicrays/
Companion piece:
“Sept. 23, 2008: In a briefing today at NASA headquarters, solar physicists announced that the solar wind is losing power.
“The average pressure of the solar wind has dropped more than 20% since the mid-1990s,” says Dave McComas of the Southwest Research Institute in San Antonio, Texas. “This is the weakest it’s been since we began monitoring solar wind almost 50 years ago.”
The heliosphere is a bubble of magnetism springing from the sun and inflated to colossal proportions by the solar wind….
“The solar wind isn’t inflating the heliosphere as much as it used to,” says McComas. “That means less shielding against cosmic rays.”
“Ulysses also finds that the sun’s underlying magnetic field has weakened by more than 30% since the mid-1990s,” says Posner. “This reduces natural shielding even more.”
….But any extra cosmic rays can have consequences…..Also, there are controversial studies linking cosmic ray fluxes to cloudiness and climate change on Earth. That link may be tested in the years ahead. http://science.nasa.gov/science-news/science-at-nasa/2008/23sep_solarwind/
Peer reviewed Paper: The influence of cosmic rays on terrestrial clouds and global warming “…It is worthwhile noticing that at epochs of sunspot maxima, solar irradiance is enhanced and the low cloud cover is reduced together with the Earth’s albedo. The opposite effect occurs at sunspot minima. Thus, the low cloud albedo change, and the increase in solar irradiance which accompanies increasing solar activity, both operate to warm the climate and the respective radiative forcing contributions are compounded….
…The lack of correlation between cosmic rays and low cloud factor over the poles and the significant degree of correlation in the tropics, is also unexpected….”
Although the TSI (total energy) stays the same the MIX changes.
Another NASA article
NASA: Solar Dynamics Observatory: The ‘Variable Sun’ Mission
“Over longer periods of decades to centuries, solar activity waxes and wanes with a complex rhythm that researchers are still sorting out….
To the amazement of many researchers, the solar constant has turned out to be not constant.
“‘Solar constant’ is an oxymoron,” says Judith Lean of the Naval Research Lab. “Satellite data show that the sun’s total irradiance rises and falls with the sunspot cycle by a significant amount.”
At solar maximum, the sun is about 0.1% brighter than it is at solar minimum. That may not sound like much, but consider the following: A 0.1% change in 1361 W/m2 equals 1.4 Watts/m2. Averaging this number over the spherical Earth and correcting for Earth’s reflectivity yields 0.24 Watts for every square meter of our planet….
Finally – and of most immediate relevance for Earth–SDO will observe the sun at wavelengths where the sun is most variable, the extreme ultraviolet (EUV).
During a solar flare, the sun’s extreme ultraviolet output can vary by factors of hundreds to thousands in a matter of seconds. Surges of EUV photons heat Earth’s upper atmosphere, causing the atmosphere to “puff up” and drag down low-orbiting satellites. EUV rays also break apart atoms and molecules, creating a layer of ions in the upper atmosphere that can severely disturb radio signals. According to Judith Lean, “EUV controls Earth’s environment throughout the entire atmosphere above about 100 km.”
“EUV is where the action is,” agrees Woods. ”
Another NASA article
Deep Solar Minimum
A 50-year low in solar wind pressure: Measurements by the Ulysses spacecraft reveal a 20% drop in solar wind pressure since the mid-1990s—the lowest point since such measurements began in the 1960s……
A 12-year low in solar “irradiance”: Careful measurements by several NASA spacecraft show that the sun’s brightness has dropped by 0.02% at visible wavelengths and 6% at extreme UV wavelengths since the solar minimum of 1996. …. Earth’s upper atmosphere is heated less by the sun and it is therefore less “puffed up.” ….
A 55-year low in solar radio emissions: After World War II, astronomers began keeping records of the sun’s brightness at radio wavelengths. Records of 10.7 cm flux extend back all the way to the early 1950s. Radio telescopes are now recording the dimmest “radio sun” since 1955….
“Since the Space Age began in the 1950s, solar activity has been generally high,” notes Hathaway. “Five of the ten most intense solar cycles on record have occurred in the last 50 years. We’re just not used to this kind of deep calm.”……
A University Today Article:
“New measurements from a NASA satellite show a dramatic cooling in the upper atmosphere that correlates with the declining activity of the current solar cycle. For the first time, researchers can show a timely link between the Sun and the climate of Earth’s thermosphere….
“The Sun is in a very unusual period,” said Marty Mlynczak, SABER associate principal investigator and senior research scientist at NASA Langley. “The Earth’s thermosphere is responding remarkably — up to an order of magnitude decrease in infrared emission/radiative cooling by some molecules.”
The TIMED measurements show a decrease in the amount of ultraviolet radiation emitted by the Sun. In addition, the amount of infrared radiation emitted from the upper atmosphere by nitric oxide molecules has decreased by nearly a factor of 10 since early 2002. These observations imply that the upper atmosphere has cooled substantially since then….” http://www.universetoday.com/47851/earths-upper-atmosphere-is-cooling/
A screen capture of a n Article:
NOAA: From the late fifties the SUN has been at its most active in 11,500 years and may have caused the present warming
What I get from this is a correlation of sun and cloud cover in the tropics. An INCREASE in cloud cover and albedo at Solar minima while there is a DECREASE in ultraviolet radiation and Extreme ultraviolet radiation. From other information we know these are the wavelengths that penetrate deepest into the Ocean and also hold the most energy. There is also indications of longer term sun cycles besides the 11 yr and in the last fifty years, since the late fifties,(surprise) the sun has been very active till now.
On top of that is the 20% increase in cosmic rays and a 30% decrease in the “sun’s underlying magnetic field”during the last minimum.
Therefore I still say we really do not have enough information except to say there are a lot of factors and you can not deal the sun out of the game just based on the basis of a near constant TSI
Sorry MattG, but ‘trend’ after ‘normalise’ is utterly meaningless!
Gail Combs says:
October 29, 2011 at 7:48 am
On top of that is the 20% increase in cosmic rays and a 30% decrease in the “sun’s underlying magnetic field”during the last minimum.
Several myths rolled into one. The 20% decrease in cosmic rays was for the lowest energies [which do not even reach the Earth] and was just since the minimum in 1996 [we didn’t have space measurements before that]. Every other minimum [1996, 1976, 1954, …] has lower cosmic rays for well-known reasons. The magnetic field of the sun is now back to where it was about 100 years ago. The Sun has not been the most active [in 11,000 years] this past century, and so on. http://www.leif.org/research/Historical%20Solar%20Cycle%20Context.pdf
http://www.leif.org/research/Does%20The%20Sun%20Vary%20Enough.pdf
http://www.leif.org/research/How%20Well%20Do%20We%20Know%20the%20Sunspot%20Number.pdf
Gail Combs says: “What I get from this is a correlation of sun and cloud cover in the tropics.”
Please provide links to cloud cover and which ever solar dataset you prefer and we’ll plot them. KNMI has a couple of long-term cloud cover datasets to choose from, but they are spatially incomplete: ICOADS (oceans), CRU (land), They also have a couple of short-term spatially complete (satellite based) cloud datasets too. But they are very short.
(Eeeek! Just looked out the window. It’s snowing like crazy. Ground’s too warm for it to stick right now, but it’s accumulating on the bushes and pine trees.)
woodfortrees (Paul Clark) says:
October 29, 2011 at 7:50 am
When comparing trend without normalise just recently there is no difference. (should have known this really)
Thanks for letting me know, good tool BTW.
barry says:
October 29, 2011 at 6:10 am
Gary,
Is there really an organization that is monitoring all 160,000 glaciers throughout the world?
Did someone say there was? I don’t believe so. Various groups have collected data kept by various nations. The study below represents one such effort – the sample size and methodology is described.
http://www.ncbi.nlm.nih.gov/pmc/articles/PMC26446/
Wherever and however the data is sampled, different groups come up with similar results.
You mean like the cash value, both scientific and in a perhaps also valid pecuniary way, of The conclusion from the study you link to?
It is, however, clear that carefully measured glacier data are limited both temporally and spatially. Existing records need to be expanded to better understand the relations between glacier volume change and climatic driving forces.
Or is the word of the WWF final?
Bob Tisdale says:
October 29, 2011 at 9:22 am
Gail Combs says: “What I get from this is a correlation of sun and cloud cover in the tropics.”
________________________________
Bob I was quoting from the paper:
The influence of cosmic rays on terrestrial clouds and global warming
E. Palle Bago and C. J. Butler
Paper appeared in Astronomy & Geophysics, August 2000. Vol 41, Issue 4, pp 18-22.
Original: http://star.arm.ac.uk/~ambn/341epb.ps
The link I quoted from: http://www.solarstorms.org/CloudCover.html
Has several graphs.
________________________________
Lief,
I was quoting from NASA links directly. As I said we need a lot more information before we start tossing out “The Science says” type of statements. We are just not there yet, although I certainly agree Water in all its forms, Clouds, Oceans, Ice and Vapor is a real big player. But you still can not get around the fact ALL energy comes from the sun except for geothermal. (Volcanoes seem to be another big player in at least short term weather events.) I am also very well aware that correlation is not causation – Skirt lengths and the stock markets come to mind.
Bob, Lief, we all know that there are Ocean oscillations, did it ever occur to you that once an oscisilation is in place it does not take much additional energy to KEEP that oscillation going???
Here is another NASA link:
NASA Finds Sun-Climate Connection in Old Nile Records
“March 19, 2007
Long-term climate records are a key to understanding how Earth’s climate changed in the past and how it may change in the future. Direct measurements of light energy emitted by the sun, taken by satellites and other modern scientific techniques, suggest variations in the sun’s activity influence Earth’s long-term climate. However, there were no measured climate records of this type until the relatively recent scientific past…..
Now, however, a group of NASA and university scientists has found a convincing link between long-term solar and climate variability in a unique and unexpected source: directly measured ancient water level records of the Nile, Earth’s longest river.
Alexander Ruzmaikin and Joan Feynman of NASA’s Jet Propulsion Laboratory, Pasadena, Calif., together with Dr. Yuk Yung of the California Institute of Technology, Pasadena, Calif., have analyzed Egyptian records of annual Nile water levels collected between 622 and 1470 A.D. at Rawdah Island in Cairo. These records were then compared to another well-documented human record from the same time period: observations of the number of auroras reported per decade in the Northern Hemisphere. Auroras are bright glows in the night sky that happen when mass is rapidly ejected from the sun’s corona, or following solar flares. They are an excellent means of tracking variations in the sun’s activity.
Feynman said that while ancient Nile and auroral records are generally “spotty,” that was not the case for the particular 850-year period they studied….
Since the time of the pharaohs, the water levels of the Nile were accurately measured, since they were critically important for agriculture and the preservation of temples in Egypt,” she said. “These records are highly accurate and were obtained directly, making them a rare and unique resource for climatologists to peer back in time.”
A similarly accurate record exists for auroral activity during the same time period in northern Europe and the Far East. People there routinely and carefully observed and recorded auroral activity, because auroras were believed to portend future disasters, such as droughts and the deaths of kings.
“A great deal of modern scientific effort has gone into collecting these ancient auroral records, inter-comparing them and evaluating their accuracy,” Ruzmaikin said. “They have been successfully used by aurora experts around the world to study longer time scale variations.”
The researchers found some clear links between the sun’s activity and climate variations. The Nile water levels and aurora records had two somewhat regularly occurring variations in common – one with a period of about 88 years and the second with a period of about 200 years……”
Research, published in a paper in the May 15, 2002 issue of Geophysical Research Letters,
Study of Dust in Ice Cores Shows Volcanic Eruptions Interfere with the Effect of Sunspots on Global Climate
“University at Buffalo scientists working with ice cores have solved a mystery surrounding sunspots and their effect on climate that has puzzled scientists since they began studying the phenomenon.
The research, published in a paper in the May 15 issue of Geophysical Research Letters, provides striking evidence that sunspots — blemishes on the sun’s surface indicating strong solar activity — do influence global climate change, but that explosive volcanic eruptions on Earth can completely reverse those influences.
It is the first time that volcanic eruptions have been identified as the atmospheric event responsible for the sudden and baffling reversals that scientists have seen in correlations between sunspots and climate…..
Bob Tisdale says:
October 29, 2011 at 9:22 am
(Eeeek! Just looked out the window. It’s snowing like crazy. Ground’s too warm for it to stick right now, but it’s accumulating on the bushes and pine trees.)
I live in the sunny SOUTH, mid north Carolina and they have a blasted FREEZE warning out tonite!!!!
Maybe we will be lucky and Washington DC will get a snow storm……
I just checked. Forecast for today was ice pellets.
“Now
Light snow…occasionally mixing with rain…will continue across the metropolitan areas of Washington DC and the city of Baltimore this evening. Through 8 PM…additional accumulations along the Mason Dixon line of around an inch will be possible…but elsewhere little or no additional snowfall accumulation is expected.
http://classic.wunderground.com/cgi-bin/findweather/getForecast?query=Washington%20DC&wuSelect=WEATHER
I do like Mother Nature’s sense of humor.
JPeden,
Have the WWF published peer-reviewed work on glaciers? I’m not aware of that.
In study after study at least 85% of monitored glaciers are receding/losing mass balance. Many studies show a greater percentage, but I think it’s better to lay out conservative values.