
Guest post by Alec Rawls
Here is the puzzle, as noted by Nigel Calder and others: how can BEST insist that a modicum of additional evidence of late 20th century warming should put skepticism of the CO2-warming theory to rest, while at the same time admitting that they never even tried to examine the possible causes of warming?
Elizabeth Muller’s press statement in support of anti-CO2 alarmism is extreme:
Elizabeth Muller, co-founder and Executive Director of Berkeley Earth, said she hopes the Berkeley Earth findings will help “cool the debate over global warming by addressing many of the valid concerns of the skeptics in a clear and rigorous way.” This will be especially important in the run-up to the COP 17 meeting in Durban, South Africa, later this year, where participants will discuss targets for reducing Greenhouse Gas (GHG)emissions for the next commitment period as well as issues such as financing, technology transfer and cooperative action.
She is strongly implying that BEST’s findings not only support the CO2 theory of late 20th century warming, but justify radical worldwide government action to reduce carbon emissions.
Richard Muller’s statement of ignorance on the cause of the observed warming is equally absolute:
What Berkeley Earth has not done is make an independent assessment of how much of the observed warming is due to human actions.
Contradictory, yes, but also explanatory. Muller et al. must be so ignorant of this climate science subject that they are brand-new to that they are not even aware that the leading competing climate theory, where solar-magnetic activity modulates cloud formation, also predicts and explains late 20th warming. All they know is that the CO2 theory predicts warming, prompting them to see evidence of warming as evidence for that theory.
This is the only logical explanation for Muller vs. Muller, and it would also explain why BEST made such a complete hash of the only part of their data that does have any power to discriminate between CO2-warming and solar-warming.
Opposite temperature predictions for quiet-sun era
If late 20th century warming was mostly caused by the industrial release of atmospheric CO2, then warming should be continuing apace, but if 20th century warming was mostly caused by the 80 year grand maximum of solar activity that waned in the 1990’s and ended in 2005, then planetary temperature (as measured by the heat content of the oceans) should have been falling for several years now. In a less smooth way, surface temperatures would also be passing the peak of the Modern Warm period.
Nature is right now conducting an ideal experiment for determining which theory is right, but on this crucial part of the temperature record—what happened when solar activity waned and then dropped into the cellar—BEST’s presentation is remarkably confused. The sample station analysis that they released shows substantially more post-98 cooling than any of the other land records, while their full data set has recent temperatures going up compared to the other records.
Here is a zoom-in on figure 1 from BEST’s “decadal variations” paper. It shows the most recent temperatures for a sub-sample of temperature stations (“[this] Berkeley Earth data were randomly chosen from 30,964 sites that were not used by the other groups”):

Wow, this sub-sample really favors the sun as the primary driver of climate, certainly compared to the NOAA, GISS and Hadley evidence. The BEST temperatures are equal or above the other temperature records throughout the 80’s and 90’s, then drop precipitously below them over the last ten years, as the sun has gone quiet.
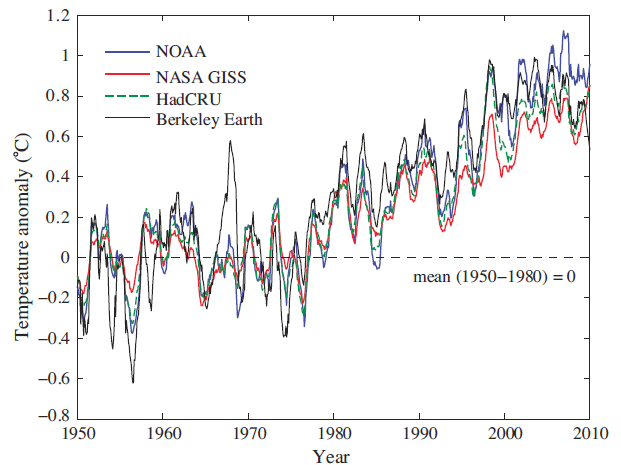
BEST’s full data set tells the opposite story. Here is their 12 month average surface temperature (figure 8 from their “Temperature Averaging Process” paper):

The second part of figure 8 shows the differences. NOAA and GISS both drop off a couple of tenths of a degree relative to BEST after 2000, while Hadley drops off about a half a degree!

Wow, compared to the evidence provided by the other temperature records, BEST’s full sample really favors the CO2 theory over this critical period. Thus on the only part of the temperature record that is probative, BEST displays two strongly contradictory graphs without a word of commentary. That’s a pretty good sign that they are oblivious to the discriminatory power of this part of the record, indicating again that they are not even aware of the GCR-cloud theory and its implications. No wonder they can do such incredibly biased things as calling “the late part of the 20th century,” “the anthropogenic era” (p. 30). Anthropogenic warming is their premise.
BEST evidence is not best evidence
Almost all of the heat capacity of the biosphere is in the oceans. Thus climate change over time means a change in ocean heat content. Land surface temperature is a volatile expression of this global temperature, depending on whether colder or warmer ocean currents are at the surface. That volatility makes surface temperatures an iffy way to track climate change, and today, better evidence is available.
In recent years, ARGO’s automated fleet of temperature sounding devices provides much improved direct measurement of ocean temperature. According to NOAA, data from these floats show ocean heat content for the top 700 meters as close to flat for about 10 years now:

(Bob Tisdale says that NOAA has recently started reporting heat content for the top 2000 meters, but apparently it is still a work in progress, as they don’t display it on their heat content page.)
Ocean heat content can also be measured by sea level, which is determined by the thermal expansion of the oceans, plus net land-ice melt. Here is NOAA’s sea level data, compensated for land-ice melt and variations in salinity. It shows ocean heat content as roughly flat for about the last eight years:

This best evidence indicates that global warming has stopped, which militates against the CO2 theory of late 20th century warming, but the oceans do not show the global cooling that the solar-theory predicts, so it does not clearly favor the cosmic-ray-cloud hypothesis either. The very latest sea level data, however, may finally be telling the tale:

Steve Goddard, September 2011: “The latest sea level numbers are out, and Envisat shows that the two year long decline is continuing, at a rate of 5mm per year.”
That’s actual sea level, not steric sea level. Subtract out the ongoing land-ice melt from our currently warm climate and thermosteric sea level is falling even more rapidly. If cosmic-ray-cloud effects do dominate CO2 effects, we’ll probably have full proof within the next couple of years.
Can BEST actually be unaware of the cosmic-ray-cloud theory, or are they just accepting the CO2-alarmists’ excuses for dismissing solar effects?
Unless Muller is a world-class fruitcake, he can’t have waded into the climate arena without at least being aware of Svensmark’s theory. He must also know that the sun has gone quiet, and his Nobel-physics brain would be able to figure out how this natural experiment provides a test of which theory is right. Yet he might still act as if he is unaware of solar warming theory if he has been convinced by the alarmists’ bogus excuses for why recent warming can’t have been caused by the sun.
Over and over, these folks claim that late 20th century cannot have been caused by the sun because solar activity was not rising over this period. e.g. Rasmus Benestad, 2005:
A further comparison with the monthly sunspot number, cosmic galactic rays and 10.7 cm absolute radio flux since 1950 gives no indication of a systematic trend in the level of solar activity that can explain the most recent global warming.
That reasoning obviously requires an assumption that ocean temperatures had equilibrated to the high level of 20th century solar forcing by 1950. Otherwise the continued high level of solar forcing (the hypothesis under consideration) would cause continued warming until ocean equilibrium was reached. Yet Benestad did not even acknowledge this assumption, never mind make any case for it, and this has been the pattern.
I have written several posts on the alarmists’ excuses for dismissing the solar explanation and how they utterly fail to stand up to scrutiny. But without even going into those details, the more basic point is that the various rationales for dismissing the solar warming hypothesis are theoretical. They are, in effect, part of the CO2 warming theory. Our recently quiet sun offers a test of which theory makes the right prediction. To ignore that test because one already agrees with one of the theories, as BEST seems to be doing, is to put theory over evidence, the opposite of what scientists are supposed to do.
Paul Vaughan says:
October 30, 2011 at 11:56 am
……One of the challenges plaguing the media & the public in the climate discussion is the relentless mainstream direction of our attention to average anomalies where climate cannot be understood without maintaining vigilant cognizance of absolute gradients (differentially driving circulation & water states across hemispheres & basins).
Perhaps mainstreamers don’t want the public to develop a clue about asymmetric aliasing of solar-driven cumulative circulation because every department & disciplinary branch wants their share of the boat-loads of public climate research funding before everyone clues in to what we already know with crystal clarity from EOP. Is it atrophy from too many years on the gravy train or just the blinding carrot on the stick? Too costly for society & civilization either way. Checks & balances needed……
_________________________________________
I think the problem is far more simple. Schools no longer bother to teach arithmetic much less math! Statistics??? -whats that. (28% of US students entering college have to do remedial classes) The majority of college students do not go much beyond the first year of high school math (algebra) and then maybe a course in “business math”
If I can barely follow what you are saying with a BS in Chemistry, how the heck can the liberal arts major (journalists and teachers) hope to understand? Most people in the USA at least have a heck of a lot less science/math education then you find in this blog.
…..
Back on subject.
In simple language you seem to be saying that the asymmetrical distribution of the land mass with the majority of land mass in the Norther hemisphere and most of the water in the southern hemisphere is the cause of the ocean oscillations … with help from the “11 year” solar cycle??? or without the solar cycle???
For data there is also Project Earthshine Earth’s global albedo, I do not know if the data sets are available.
It may be that we are talking about too short a time frame and “quiet sun” may be a relative term. Specifically, we came out of a Little Ice Age about 150 years ago. During that time, there was a Maunder Minimum and a Dalton Minimum. Now, those appear to have been more extreme and longer periods of quiet sun than we have experienced for the last 100 years. We don’t have much in the way of measurements of anything like UV radiation or cosmic rays from the Little Ice Age, or accurate world wide temperature measurements to compare to the UV or cosmic rays then. Since then, it is quite possible that the sun has not gone quiet to the same extant as it did back then. Thus when we are talking “quiet sun”, comparatively, those two minimum periods might be called “real quiet sun”. To effect noticeable temperature changes, we may need another period of “real quiet sun”. It may be that the mechanism by which “real quiet sun” creates a little ice age may indeed be by increases in cosmic rays resulting in increased clouds, and/or a change in UV radiation.
Thus, the reason you may say that solar variability does not cause climate changes is simply because we have had no serious solar variability of note during the time period you have measurements for. However, there is a prediction that we are right now 10 years into a period of another solar minimum, one a little less extreme than the last two, but still a definite minimum. If that is the case, in the next several decades, we may indeed have a large enough change in solar variability to actually test out the cosmic ray and/or UV change theories (buy long underwear). The simple fact is that the Little Ice Age definitely was a period of climate change, and it did indeed coincide with not one but two periods of solar minimum, and thus there is a very good chance that solar variability is the prime cause of that coolness, and it may very well be that the solar variables that had the most effect on the climate are the suns’ effect on cosmic rays and/or UV changes.
Also, ENSO alone cannot cause warming. ENSO merely moves heat around, it is not the source of that heat. The sun is the source of the heat, the oceans store that heat and release more or less of it at various times. If over the last 150 years it has been getting slowly warmer, the sun is the only factor that could cause that, it being the sole source of heat. The oceans may simply, because they store so much heat, be able to mask any short term effects of solar variability so that we will not see a direct correlation between solar variability at the time they happen with climate changes. Most people say that it takes two solar cycles to see significant change, and we are still in the first one, and the Little Ice Age suggests that we may need a “very quiet sun”, not just a “quiet sun”, before the seas’ delaying action on climate changes is overcome in at the earliest the next solar cycle.
To sum up:
You may not agree that solar variability changes temperature because you have not seen real solar variability.
It may be that the delaying action of the stored heat in the oceans delays any temperature change caused by solar variability.
There is a good chance that you will get a chance to see if solar variability changes temperature, however, you may have to wait 10+ years.
So I would not simply dismiss the cosmic ray or UV ideas just yet…
For that matter, just because recently the total radiance of the sun changes only 0.1% does not mean that in a real solar minimum it will continue to change so little.
Remember, during the time period we are able to measure UV and cosmic rays and total radiance, we have not had a real minimum to measure.
Leif Svalgaard (October 30, 2011 at 2:34 pm) writing of EOP (Earth Orientation Parameters): “Those are consequences of climate [through poorly known mechanisms] so it is nonsense to try use those as criteria.”
Misrepresentation.
We know EOP are consequences (not causes) of climate, but your claim that the mechanisms are poorly known is far less true now than it was a year ago. The full solution is within striking distance if the right multidisciplinary combination of people cooperate, but politics seems likely to build in lengthy delays.
Until the climate models can reproduce EOP, the climate models are omitting fundamentals and thus their output does not warrant more than casual consideration.
More respect for nature would be a welcome development.
Paul Vaughan says:
October 30, 2011 at 10:37 pm
but your claim that the mechanisms are poorly known is far less true now than it was a year ago.
So the EOP experts have made significant progress lately. Perhaps some references to papers describing their new-found insights might be helpful.
Anecdote: When I checked the news last night I found this: Skeptic’s own study finds climate change is real = http://www.ctv.ca/CTVNews/TopStories/20111030/skeptic-study-finds-climate-change-real-111030/
The title of the article is a gross, humorous misrepresentation.
—
@Gail Combs (October 30, 2011 at 3:48 pm)
Since Earth is tilted & asymmetric, it aliases the solar cycle.
Anomaly-think has probably been a major factor retarding mainstream realization of this sheer simplicity. The decomposition of absolutes into climatology + anomaly is based on untenable geometric assumptions; certainly it provides an eminently sensible & practical first order approximation, but anyone who looks with great non-assumptive care will find lurking factors systematically scrambling the variance partitioning.
Certainly you are correct that Western math education systems are declining. Teaching basic symmetry concepts (e.g. reflection, rotation, translation) to university math education students was one of the eye openers for me about inconsistencies in the population.
Paul Vaughan says:
October 30, 2011 at 10:37 pm
Until the climate models can reproduce EOP, the climate models are omitting fundamentals
One would think that the climate models should reproduce climate first and foremost.
Legatus says:
October 30, 2011 at 5:04 pm
Remember, during the time period we are able to measure UV and cosmic rays and total radiance, we have not had a real minimum to measure.
The current thinking is that that real minimum shows itself every 11 years, i.e. that the Sun can’t get any more quiet than what it is at every solar minimum,.e.g. Schrijver et al. 2011 http://www.leif.org/EOS/2011GL046658.pdf :
“Therefore, the best estimate of magnetic activity […] for the least-active Maunder Minimum phases appears to be provided by direct measurement in 2008-2009. ” see also their Figure 2.
Legatus started his comment with: “It may be that we are talking about too short a time frame and “quiet sun” may be a relative term. Specifically, we came out of a Little Ice Age about 150 years ago. During that time, there was a Maunder Minimum and a Dalton Minimum…”
Please provide a link to any graph of a solar dataset and a global temperature dataset out of all those that appear on the web to illustrate your belief. Make sure your graph idenifies the source of the data. We can then discuss your beliefs from there.
Matt G says: “I can’t find a better explanation than global cloud albedo dropping 5 percent during the same period referred too in your post.”
Please identify the source of the 5% drop in cloud albedo you’re referring to.
Also, the fuel for El Nino events is provided by the reduction in cloud amount caused by La Nina events
Paul Vaughan says: “The spatiotemporal geometry isn’t what you (implicitly, not explicitly) assume with your solar comments.”
Care to elaborate?
Bob: Yes – as time permits over the months & years. My immediate concern this week: paid work. Best Regards.