
Guest post by Alec Rawls
Here is the puzzle, as noted by Nigel Calder and others: how can BEST insist that a modicum of additional evidence of late 20th century warming should put skepticism of the CO2-warming theory to rest, while at the same time admitting that they never even tried to examine the possible causes of warming?
Elizabeth Muller’s press statement in support of anti-CO2 alarmism is extreme:
Elizabeth Muller, co-founder and Executive Director of Berkeley Earth, said she hopes the Berkeley Earth findings will help “cool the debate over global warming by addressing many of the valid concerns of the skeptics in a clear and rigorous way.” This will be especially important in the run-up to the COP 17 meeting in Durban, South Africa, later this year, where participants will discuss targets for reducing Greenhouse Gas (GHG)emissions for the next commitment period as well as issues such as financing, technology transfer and cooperative action.
She is strongly implying that BEST’s findings not only support the CO2 theory of late 20th century warming, but justify radical worldwide government action to reduce carbon emissions.
Richard Muller’s statement of ignorance on the cause of the observed warming is equally absolute:
What Berkeley Earth has not done is make an independent assessment of how much of the observed warming is due to human actions.
Contradictory, yes, but also explanatory. Muller et al. must be so ignorant of this climate science subject that they are brand-new to that they are not even aware that the leading competing climate theory, where solar-magnetic activity modulates cloud formation, also predicts and explains late 20th warming. All they know is that the CO2 theory predicts warming, prompting them to see evidence of warming as evidence for that theory.
This is the only logical explanation for Muller vs. Muller, and it would also explain why BEST made such a complete hash of the only part of their data that does have any power to discriminate between CO2-warming and solar-warming.
Opposite temperature predictions for quiet-sun era
If late 20th century warming was mostly caused by the industrial release of atmospheric CO2, then warming should be continuing apace, but if 20th century warming was mostly caused by the 80 year grand maximum of solar activity that waned in the 1990’s and ended in 2005, then planetary temperature (as measured by the heat content of the oceans) should have been falling for several years now. In a less smooth way, surface temperatures would also be passing the peak of the Modern Warm period.
Nature is right now conducting an ideal experiment for determining which theory is right, but on this crucial part of the temperature record—what happened when solar activity waned and then dropped into the cellar—BEST’s presentation is remarkably confused. The sample station analysis that they released shows substantially more post-98 cooling than any of the other land records, while their full data set has recent temperatures going up compared to the other records.
Here is a zoom-in on figure 1 from BEST’s “decadal variations” paper. It shows the most recent temperatures for a sub-sample of temperature stations (“[this] Berkeley Earth data were randomly chosen from 30,964 sites that were not used by the other groups”):

Wow, this sub-sample really favors the sun as the primary driver of climate, certainly compared to the NOAA, GISS and Hadley evidence. The BEST temperatures are equal or above the other temperature records throughout the 80’s and 90’s, then drop precipitously below them over the last ten years, as the sun has gone quiet.
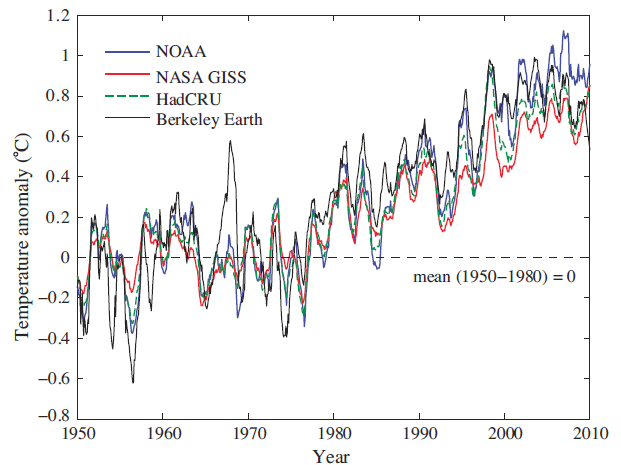
BEST’s full data set tells the opposite story. Here is their 12 month average surface temperature (figure 8 from their “Temperature Averaging Process” paper):

The second part of figure 8 shows the differences. NOAA and GISS both drop off a couple of tenths of a degree relative to BEST after 2000, while Hadley drops off about a half a degree!

Wow, compared to the evidence provided by the other temperature records, BEST’s full sample really favors the CO2 theory over this critical period. Thus on the only part of the temperature record that is probative, BEST displays two strongly contradictory graphs without a word of commentary. That’s a pretty good sign that they are oblivious to the discriminatory power of this part of the record, indicating again that they are not even aware of the GCR-cloud theory and its implications. No wonder they can do such incredibly biased things as calling “the late part of the 20th century,” “the anthropogenic era” (p. 30). Anthropogenic warming is their premise.
BEST evidence is not best evidence
Almost all of the heat capacity of the biosphere is in the oceans. Thus climate change over time means a change in ocean heat content. Land surface temperature is a volatile expression of this global temperature, depending on whether colder or warmer ocean currents are at the surface. That volatility makes surface temperatures an iffy way to track climate change, and today, better evidence is available.
In recent years, ARGO’s automated fleet of temperature sounding devices provides much improved direct measurement of ocean temperature. According to NOAA, data from these floats show ocean heat content for the top 700 meters as close to flat for about 10 years now:

(Bob Tisdale says that NOAA has recently started reporting heat content for the top 2000 meters, but apparently it is still a work in progress, as they don’t display it on their heat content page.)
Ocean heat content can also be measured by sea level, which is determined by the thermal expansion of the oceans, plus net land-ice melt. Here is NOAA’s sea level data, compensated for land-ice melt and variations in salinity. It shows ocean heat content as roughly flat for about the last eight years:

This best evidence indicates that global warming has stopped, which militates against the CO2 theory of late 20th century warming, but the oceans do not show the global cooling that the solar-theory predicts, so it does not clearly favor the cosmic-ray-cloud hypothesis either. The very latest sea level data, however, may finally be telling the tale:

Steve Goddard, September 2011: “The latest sea level numbers are out, and Envisat shows that the two year long decline is continuing, at a rate of 5mm per year.”
That’s actual sea level, not steric sea level. Subtract out the ongoing land-ice melt from our currently warm climate and thermosteric sea level is falling even more rapidly. If cosmic-ray-cloud effects do dominate CO2 effects, we’ll probably have full proof within the next couple of years.
Can BEST actually be unaware of the cosmic-ray-cloud theory, or are they just accepting the CO2-alarmists’ excuses for dismissing solar effects?
Unless Muller is a world-class fruitcake, he can’t have waded into the climate arena without at least being aware of Svensmark’s theory. He must also know that the sun has gone quiet, and his Nobel-physics brain would be able to figure out how this natural experiment provides a test of which theory is right. Yet he might still act as if he is unaware of solar warming theory if he has been convinced by the alarmists’ bogus excuses for why recent warming can’t have been caused by the sun.
Over and over, these folks claim that late 20th century cannot have been caused by the sun because solar activity was not rising over this period. e.g. Rasmus Benestad, 2005:
A further comparison with the monthly sunspot number, cosmic galactic rays and 10.7 cm absolute radio flux since 1950 gives no indication of a systematic trend in the level of solar activity that can explain the most recent global warming.
That reasoning obviously requires an assumption that ocean temperatures had equilibrated to the high level of 20th century solar forcing by 1950. Otherwise the continued high level of solar forcing (the hypothesis under consideration) would cause continued warming until ocean equilibrium was reached. Yet Benestad did not even acknowledge this assumption, never mind make any case for it, and this has been the pattern.
I have written several posts on the alarmists’ excuses for dismissing the solar explanation and how they utterly fail to stand up to scrutiny. But without even going into those details, the more basic point is that the various rationales for dismissing the solar warming hypothesis are theoretical. They are, in effect, part of the CO2 warming theory. Our recently quiet sun offers a test of which theory makes the right prediction. To ignore that test because one already agrees with one of the theories, as BEST seems to be doing, is to put theory over evidence, the opposite of what scientists are supposed to do.
LazyTeenager says:
October 28, 2011 at 4:04 pm
…….”So sorry guys you will have to wait another 10 years to see if the end blip is a REAL down trend.”
=======
Maybe so.
But in the mean time, the windmills keep sprouting.
Driven by guilt, paid for by misinformed taxpayers.
Benefiting no one, except politicians and their corporate sponsors.
There are way better ways to waste money, other than erecting monuments that proclaim ones foolishness.
LazyTeenager says:
October 28, 2011 at 4:04 pm
And post 1980 the temperature record plateaued for a while as well. So in 1990 you could have said exactly the same thing using the same reasoning. Except the temperature then started to rise again.
===================================================================
The 80s blip, and also the this current plateau, falsifies the CO2 being the driver of the climate hypothesis. We’ve increased CO2 by 40 ppm and nothing…………
Jeff D says:
October 28, 2011 at 12:42 pm
With what appears to be an ocean cooling cycle in the making is it possible that we will also see a drop in CO2 levels, and if so would we see it globally or would it first show up at certain latitude? If the ocean temp drops 1c what kind of ppm of CO2 is possible?
———-
Unlikely. At best a slight reduction in the upward trend.
We know how much CO2 we are producing. Fuels are taxed as royalties, and all the way along the supply chain and the numbers also appear in company reports.
We know the yearly increment in the atmosphere is about half of what we produce.
The difference has to go somewhere and that somewhere is the oceans, with a small proportion going into extra plant coverage.
So altogether the oceans are doing net absorption of CO2 and are not fizzing it out.
Even if the temperature drops were very severe it’s going to take a long time for actual CO2 reductions to occur. Remember when solar insolation changes are the actual driving force for temperature changes, the CO2 response lags by 800 years, as shown by the ice cores.
Our recently quiet sun offers a test of which theory makes the right prediction.
———-
Does that mean that if the next 1-5 years see the warming trend continue and the rise in sea levels trend continue, that you will agree that you are wrong and that climate scientists are right?
Or will you continue with your position and simply make excuses.
I have this expectation that today random downward blips are being called a real trend, but if tomorrow we see a random upward blip you will changed your tune and claim it’s just random variation. Please prove me wrong.
LazyTeenager says:
“Does that mean that if the… rise in sea levels trend continue…”
Don’t you even read the articles before giving your opinion? This is posted in the article.
It’s been argued here many times , on the basis of ice-core measurements, that CO2 increases lag temperature by some 800 years. So I am wondering why some are saying that the “quiet” sun will cause CO2 levels to decline “now”.
Smokey says:
October 28, 2011 at 5:54 pm
LazyTeenager says:
“Does that mean that if the… rise in sea levels trend continue…”
Don’t you even read the articles before giving your opinion? This is posted in the article.
Uh, Smokey, it’s “Lazy” Teenager.
LOL
For what it is worth Connecticut USA is expecting a possible record breaking amount of “Global Warming” (about 4 to 8″ in Goshen) http://classic.wunderground.com/cgi-bin/findweather/getForecast?query=goshen%20ct&wuSelect=WEATHER
Tolland (I was there a month ago) could get a foot.
“Matt G says:
October 28, 2011 at 3:49 pm
So when I change this to include a decade period as close as possible a slight cooling with BEST is detected.
But, to me the sharp trend down towards the end of the data set looks like a error ”
Regarding the first point, it is my understanding that the BEST data only go to May, 2010, and your graph seems to confirm this. So you only have about 8.5 years of BEST versus 10 for the other sets.
As for your second point, from a different post:
“Bill Illis says:
October 22, 2011 at 9:37 am
(It also looks like BEST has an error in their database for April, 2010 which should be +1.035C rather than -1.035C – it is such an outlier compared to the trend and to other data sets – that means all their moving averages have to recalculated as well).”
Not if 2012 breaks decisively lower than 2008–which I think may well happen.
Alec Rawls says: “Is it speculation that the CO2 theory of 20th century warming and the solar theory have opposite predictions for what should happen when the sun goes quiet? It is speculation to note that the sun has dropped into a period of very low activity?” And you continued, “Not that there is anything wrong with speculation (or theory), which generally does come before testing by evidence. But just what speculation is Bob talking about?”
I’m not sure why you’re introducing CO2 into the discussion, Alec, unless you’re trying to insinuate that I’m an AGW proponent. Recall, however, that I’ve explained 70 to 80% of the rise in Global Surface Temperatures from 1982 to present using natural variables in a couple of posts. Here’s one:
http://bobtisdale.wordpress.com/2011/01/28/removing-the-effects-of-natural-variables-multiple-linear-regression-based-or-%e2%80%9ceyeballed%e2%80%9d-scaling-factors/
The topic at hand is your assumption that the “the sun as the primary driver of climate”; that is, that the rise in global surface temperature during the 20th Century can be explained by the increase in solar activity to an “80 year grand maximum” and the recent flattening of that temperature can be explained by “the sun has gone quiet.” So let’s take a look at some data. You know me, I like data, and I like to see explanations based on data.
So here’s my proposal: I’ll prepare graphs based on readily available data. And you explain. I’ll describe my initial scaling, and I’ll be happy to change the scaling as long as you justify any changes you want. If you’d like me to introduce another dataset, such as cloud amount or cloud cover for example, I can do that as long as it’s readily available—from KNMI Climate Explorer for example:
http://climexp.knmi.nl/selectfield_obs.cgi?someone@somewhere
If it’s not available through KNMI, simply provide a link to the data. But the data has to be in an easy-to-use format so that anyone following this discussion can reproduce the graphs. And of course, I could change the filtering to a 133-month running-average to smooth out the solar cycle variations. The offshoot of this, Alec, is that you’ll have some graphs for a future post.
The following is a comparison graph of HADCRUT Global Land plus Sea Surface Temperature anomalies and scaled sunspot numbers from January 1900 to September 2011. The data has been smoothed with a 13-month filter to reduce the seasonal and weather noise. The sunspot scaling is based on an assumed average 0.1% variation in total solar irradiance from min to max for solar cycles 21 through 23, which equates as Leif Svalgaard often calculates…
http://wattsupwiththat.com/2009/05/01/australian-antarctic-division-can-solar-variability-influence-climate/#comment-124913
… to a change in global surface temperature of about 0.07 deg C. So this is our starting point:
http://i43.tinypic.com/15dnp5.jpg
Personally, I can’t see how solar variations could have caused the rise and then flattening in global surface temperatures that you claim. I’ve seen papers that have determined the variation on global temperature for those solar cycles was in the range of 0.2 deg C, yet I don’t think that would be enough to help.
Again, this is only a starting point. I’ll check back tomorrow morning to see what changes you’d like. I’m in the middle of writing a post on the hindcasts of the climate model used by Meehl et al (2011) and Stevenson et al (2011), the NCAR CCSM4 CMIP5 simulations.
(Bob Tisdale says that NOAA has recently started reporting heat content for the top 2000 meters, but apparently it is still a work in progress, as they don’t display it on their heat content page.)
If you download the Global Marine Alta from Argo’s website
ftp://kakapo.ucsd.edu/pub/argo/Global_Marine_Argo_Atlas/Global_Marine_Argo_Atlas_setup.exe
It will install an icon on your desktop you can run, which gives a very good display of argo data, including an ocean profile and time series down to 2000 dbar, which I take to be 200 bar of 30×200 feet = 6000 feet or 2000 meters.
Here is the reference web page for the Argo viewer with instructions. The FTP link is bold but not underlined, making it hard to recognize.
http://www.argo.ucsd.edu/Marine_Atlas.html
Elizabeth Muller’s statement about addressing the skeptics’ concerns in the run up to Durbin really says it all about the REAL purpose of the “BEST” study.
I don’t like this comment sections protocols. To continue my previous comment: The alternate climate theories are only important to people who think the science is important – it won’t get so much as a by-your-leave at Durbin. Remember, Durbin was established to get the US to sign up to suisidal CO2 restriction, cap & trade, etc. SCIENCE is not the driver there.
Leif Svalgaard often calculates to a change in global surface temperature of about 0.07 deg C. So this is our starting point:
Nope. When solar scientists can explain the 100k year anomaly, then we have a starting point in terms of TSI. The problem for solar scientists is that some of the public still remember when solar scientists argued long and loud that Milankovitch was wrong. Then the ocean cores showed otherwise and the solar scientists shut up and the science texts were quietly rewritten, until their was a new generation of true believers.
So if I say I believe in global warming and write my own computer program that shows the earth is warming will people think I’m really smart too? Will I be on tv?
@Stephen Fisher Wilde (October 28, 2011 at 4:38 pm)
There are 2 things going on.
Your ideas [which are summarized by Leroux (1993) in a single graph] describe symmetrical climate zone shifts at centennial timescales.
The ‘other thing’ that’s going on has to do with what most lay audiences call jet stream ‘loopiness’, what climatologists call ‘more meridional’ flow (contrasted with ‘more zonal’ flow), and what topologists would call asymmetric fractal geometry.
This latter thing, whatever one wants to call it, introduces (in layman’s terms) “unfair averaging” (Simpson’s Paradox in stat lingo) as a function of (a) anthropomorphic spatiotemporal windowing parameters and (b) ocean-continent heat-capacity contrast.
Hence the multidecadal terrestrial oscillations we observe.
It’s nothing more than quasi-discrete (opposite pole/hemisphere summer) asymmetric aliasing of the temporally-nonstationary solar drive-wheel, but the discussion is so focused around spatial integrals (averages) that spatial gradients (contrasts, particularly pole-equator, particularly along east coasts) are being ignored by most discussion participants. It’s the gradients, particularly the steep ones, that drive jet streams and associated structures.
So-called “experts” are analyzing a 16 dimension problem (integral, 0th, 1st, & 2nd derivatives for x, y, z, & t) in 1 dimension (time’s 0th only). The result is inability to see the forest (multidecadal terrestrial oscillations) for the trees (interannual terrestrial oscillations).
I think the first step for you is to start distinguishing between centennial symmetric latitudinal jet shifts and multidecadal asymmetric jet meridionality/loopiness. (If you don’t understand, talk to Corbyn.)
The next step – down the road – is interannual, but the audience isn’t ready and won’t be anytime soon — e.g. review of symmetry basics will be needed to bring even so-called “experts” into the leagues of the adequately functionally numerate to understand the simple multidecadal terrestrial oscillations first.
Participating in climate discussions has made me realize how grossly immature climate science is. A person of my background & ability levels (a landscape ecologist with moderate mathematical aptitude) should not be able to contribute, and yet it’s a cakewalk finding the constraints on the system that have been overlooked. If people with truly extraordinary talents (practical talents, not academic talents) can be attracted to the problem, progress could be accelerated to leaps & bounds — and myths about all-scale chaos & ENSO felled like the flat Earth.
Regards.
In the “It’s worse than we thought!” category. The first individual site temperature record in the BEST data that I plotted had one month value hiccups in the 15 to 40 degree Celsius range from their low pass filtered trace. Would you believe a monthly average temperature of -12.1 degrees Celsius for July, 1914, for Missouri, USA. (Site 136146 actual USHCN raw average of 26.7 degrees.) I’d think they’d want to do a little better QC before they claimed to have the definitive temperature record for the planet.
Bob Tisdale (October 28, 2011 at 6:51 pm) addressed Alec Rawls: “And of course, I could change the filtering to a 133-month running-average to smooth out the solar cycle variations.”
Caution: That approach ignores the primary geometry of the system. Looking at the wrong markers won’t advance our understanding. What’s worse: It’s likely to cause setbacks …exactly what some are hoping for:
http://judithcurry.com/2011/08/22/can-we-make-good-decisions-under-ignorance/
Regards.
R Barker says:
October 28, 2011 at 3:32 pm
Where is the objective that they discussed with Anthony. It should refer to a new and improved analysis of the last 30 years of data in light of Anthony’s collection of metadata on weather station siting and related issues?
They led Anthony to believe that they had such an objective.
Bob Tisdale says:
October 28, 2011 at 3:45 pm
I think what Bob means is that Rawls’ post suggests that a crucial test is coming in the next few years and that the crucial test will decide between CO2 as the cause of warming and the sun as the cause of warming. I think Bob means to caution that matters are not really so well defined as needed for a crucial test. Things might come together as Rawls suggests but they might not, so it is a matter of speculation. (We are not talking about rigorously formulated physical hypotheses after all.)
Bob Tisdale says:
October 28, 2011 at 6:51 pm
“I’m in the middle of writing a post on the hindcasts of the climate model used by Meehl et al (2011) and Stevenson et al (2011), the NCAR CCSM4 CMIP5 simulations.”
Yes, give us that, please.
Lucy Skywalker says:
October 28, 2011 at 3:14 pm
Well said. Warmista owe us an empirical explanation of why the flat temperature record from pure raw data in pristine records should be combined with patches from data series that are abbreviated or contain gaps.
I think the Palmer article will be seen as a watershed.
As a followup to my earlier post, if I did not make a mistake, the HADCRUT3 average for October 2001 to May 2010 was 0.437. For the period from June 2010 to September 2011, I got 0.395. So even if the one point on the BEST data set was in error, I believe that it can be safely stated that had BEST have all numbers for the last 120 months, the slope would still be slightly negative.