Ah, once again in response to a fearmongering press release, we see the obligatory “NYC is flooded” photoshop trick.

But guess what? I’ve already debunked that photo as impossible for the time frame. More on that later after we do the math on the press release that prompted this.
First the press release, from the University of Copenhagen
Sea levels will continue to rise for 500 years

Rising sea levels in the coming centuries is perhaps one of the most catastrophic consequences of rising temperatures. Massive economic costs, social consequences and forced migrations could result from global warming. But how frightening of times are we facing? Researchers from the Niels Bohr Institute are part of a team that has calculated the long-term outlook for rising sea levels in relation to the emission of greenhouse gases and pollution of the atmosphere using climate models. The results have been published in the scientific journal Global and Planetary Change.
“Based on the current situation we have projected changes in sea level 500 years into the future. We are not looking at what is happening with the climate, but are focusing exclusively on sea levels”, explains Aslak Grinsted, a researcher at the Centre for Ice and Climate, the Niels Bohr Institute at the University of Copenhagen.
Model based on actual measurements
He has developed a model in collaboration with researchers from England and China that is based on what happens with the emission of greenhouse gases and aerosols and the pollution of the atmosphere. Their model has been adjusted backwards to the actual measurements and was then used to predict the outlook for rising sea levels.
The research group has made calculations for four scenarios:
A pessimistic one, where the emissions continue to increase. This will mean that sea levels will rise 1.1 meters by the year 2100 and will have risen 5.5 meters by the year 2500.
Even in the most optimistic scenario, which requires extremely dramatic climate change goals, major technological advances and strong international cooperation to stop emitting greenhouse gases and polluting the atmosphere, the sea would continue to rise. By the year 2100 it will have risen by 60 cm and by the year 2500 the rise in sea level will be 1.8 meters.
For the two more realistic scenarios, calculated based on the emissions and pollution stabilizing, the results show that there will be a sea level rise of about 75 cm and that by the year 2500 the sea will have risen by 2 meters.
Rising sea levels for centuries
“In the 20th century sea has risen by an average of 2mm per year, but it is accelerating and over the last decades the rise in sea level has gone approximately 70% faster. Even if we stabilize the concentrations in the atmosphere and stop emitting greenhouse gases into the atmosphere, we can see that the rise in sea level will continue to accelerate for several centuries because of the sea and ice caps long reaction time. So it would be 2-400 years before we returned to the 20th century level of a 2 mm rise per year”, says Aslak Grinsted.
He points out that even though long-term calculations are subject to uncertainties, the sea will continue to rise in the coming centuries and it will most likely rise by 75 cm by the year 2100 and by the year 2500 the sea will have risen by 2 meters.
http://dx.doi.org/10.1016/j.gloplacha.2011.09.006
Contact:
Aslak Grinsted, PhD glaciologist, Centre for Ice and Climate, Niels Bohr Institute, University of Copenhagen. +45 3532-5893, aslak@gfy.ku.dk
================================================================
First, there has been no evidence of accelerating sea level rise. Willis writes in a previous entry:
Does increased CO2 cause increased sea level rise?
Short answer, data to date says no. There has been no acceleration the rate of sea level rise. Sea level has been rising for centuries. But the rate of the rise has not changed a whole lot. Both tidal stations and satellites show no increase in the historic rate of sea level rise, in either the short or long term. Fig. 1 shows the most recent satellite data.

Figure 1. Change of sea level over time. Radar data from the TOPEX satellite. The light blue line is sea level with monthly anomalies removed. The interval between data points is usually ten days. The gray line is the 1993-2004 linear trend projected to the end of the timeline. Gaussian average using a 71-point filter. Photo taken at Taunovo Bay Resort, Fiji.
Up until about the end of 2004, there was little change in the rate of sea level rise. Since then the rise has slowed down. The average (dark blue line) does not stray far from the trend (black line) up until 1994. Since then, it is well below the projected trend (gray line). We were supposed to be seeing some kind of big acceleration in the sea level rise caused by increased CO2. Instead, we are seeing a decrease in the rate of sea level rise. So the first claim, that increasing CO2 will cause increased rates of sea level rise, is not supported by the evidence.
Note that I am not saying anything about the future. The rate of sea level rise might go up again. What we can say, however, is that there is no hint of acceleration in the record, only deceleration. The claim of CO2 induced sea level rise is false to date.
=================
Second, these guys can’t even show math that matches the claims. Since there appears to be no acceleration in the record, and the average rate is 3mm per year we get this for they year 2100, 89 years from now:
89 years x 3 mm/year = 267 mm or 26.7 cm by the year 2100
Compare that to:
Even in the most optimistic scenario, which requires extremely dramatic climate change goals, major technological advances and strong international cooperation to stop emitting greenhouse gases and polluting the atmosphere, the sea would continue to rise. By the year 2100 it will have risen by 60 cm…
Even if nature doubled the rate of sea level rise to 6 mm/year we still wouldn’t make it:
89 years x 6 mm/year = 534 mm or 53.4 cm by the year 2100
60cm by 2100? FAIL
=====================
Third let’s have a look at that photo of NYC again, since I’ve covered it before:

Below is a repost of an analysis I did on Nov 28th, 2010 on a photo from this “NYC is flooded” photoshop trick set. Guess how long it takes to get the results shown in that photo?
Freaking out about NYC sea level rise is easy to do when you don’t pay attention to history
One of the more common visual tactics used by AGW proponents to scare people into thinking that AGW induced sea level rise is a big threat is to show altered photographs and GIS models of a city near the ocean (take your pick, New York, London, San Francisco etc.). These futuristic images demonstrate what the city might look like once global warming kicks in and kicks our butt, apparently without anyone noticing the advance of the sea. Take for example, lower Manhattan, one of the more common targets. The top image is a future shock rendition from the History Channel “Armageddon Week” and the bottom image is a photo of present day reality from Wikimedia.


Scary huh? And it’s not just photos, now that most anyone with a PC can run Google Earth, there’s a veritable cottage industry of people who make sea level inundation KML files using the 3D buildings feature for major cities. It works very well to get people’s attention. But how much of a looming threat is it when compared to the reality of measured sea level rise? Let’s find out.
 New York City under a 3-5 meter rise in sea-level due to global warming. Source: Inhabitat.com
Will Manhattan really look like that in the future? You can even interactively freak yourself out here, at Climate Atlas, and see what it looks like in NYC when the entire Greenland Ice Sheet melts:

Gosh.
Well, I can see how people must be terrified. Just look at this plot of sea level rise at the Battery Park tide gauge from NOAA:

Yeah, it’s headed up, wayyyy up. 2.77 millimeters per year. So, to get the levels in the photo and 3D GE model shown above, we’d need to do some simple calcs.
The Google Earth 3D model is easy. It specifies a 3-5 meter sea level rise, so we’ll call it 4 meters.
For calculation purposes, we’ll assume sea level rise to be linear, and round up the Battery Park tide gauge rate to 3.0 mm per year, which puts it closer to the 3.1 mm per year measured by satellite and published at Colorado State University’s Global Sea Level Page.
4 meters = 4000 millimeters
4000 millimeters /3.0 millimeters per year = 1333 years

Now, how about the doctored image from the History Channel? There’s no reference given on the height of sea level rise on the web page, but fortunately, we have built-in yardsticks in the image. The story height of buildings in the photo can easily be estimated from the before and after photos shown at the top of this post.
I’ve selected the white building on the northeast side of Battery Park, along South St. I counted 18 stories of that building as being underwater using the hi-res image here , and I’ll estimate from other objects in the photo (like the water to pier to street height) that it is an additional 2 stories from street level there to the present day sea level (PDSL).
So what is the height of a story? The Council on Tall Buildings and Urban Habitat gives a handy guide on story height for office buildings like that one. They say that an office building like that one has a story height of 3.9 meters , so we’ll use that.
History Channel photo submersion = 20 stories
Story height = 3.9 meters
Sea Level Rise in the photo 20 x 3.9 meters = 78 meters
78 meters = 78,000 millimeters
78,000 millimeters / 3 millimeters per year = 26,000 years

26,000 years to get that? Would those buildings still be standing then? And even more important, wouldn’t we be in a new ice age by then? If we did enter another ice age, sea level would be lower, as demonstrated in this graph below. Note the level 24,000 years ago.
 Image: Global Warming Art – click
This demonstrates the folly of assuming that climate change, and hence sea level rise, is linear. As we all know, it isn’t, yet that doesn’t stop many AGW proponents from using present day measurements to project linearly into the future and then generate scary scenarios and visuals from it.
Even on the short-term, such predictions fail miserably. Take for example Dr. James Hansen of NASA GISS. Read his prediction 20 years ago about sea level rise in New York City, which I previously covered on WUWT in A little known 20 year old climate change prediction by Dr. James Hansen – that failed badly.
He said that [in 20 years]:
“The West Side Highway [which runs along the Hudson River] will be under water.(which has been “updated” now, even with the update it still fails)
Problem is, here it is 20 years later, and people still drive that highway today without the use of Jet-Skis.
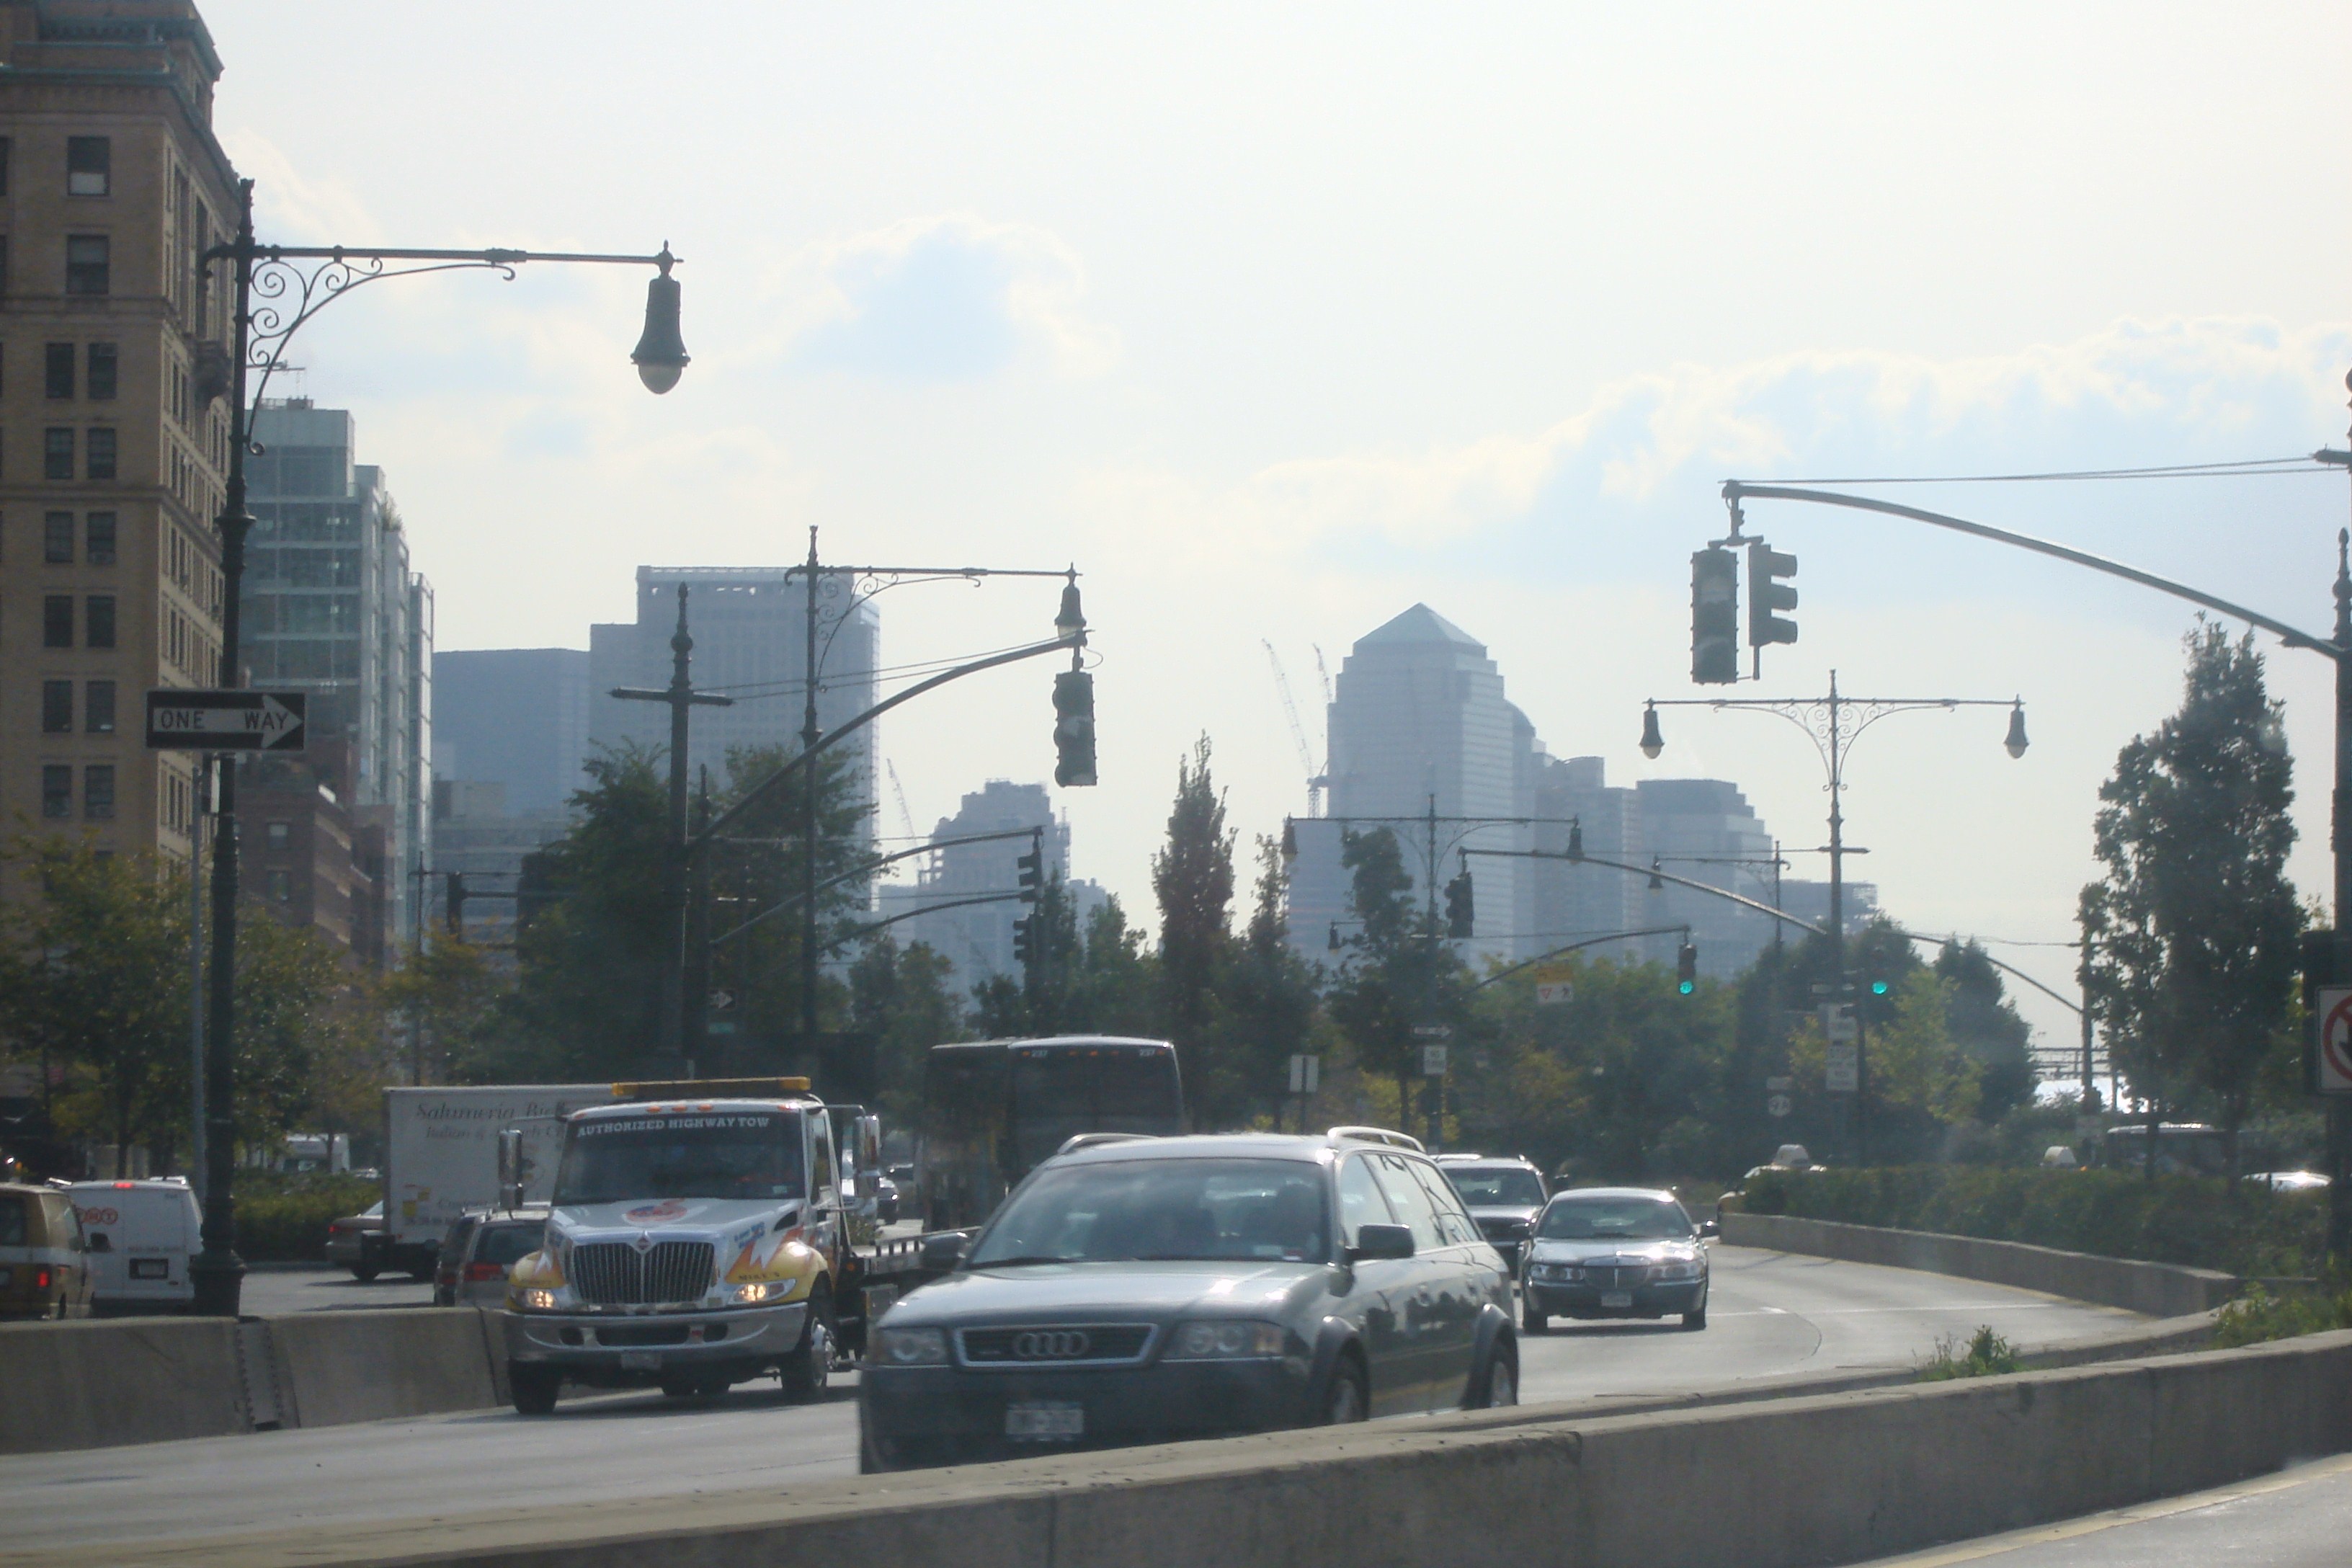 West Side Highway in 2007. Image: Wikimedia
What got me started on this post was a comment left on WUWT by “Rascal”
Submitted on 2010/11/26 at 7:46 pmCopy the following address in to your browser, and observe the expansion of lower Manhattan since 1660.
http://www.racontours.com/archive/coastline_anim.php
Note that the West Side Highway (West Street) over half of the World Trade Center site, and the South Street Seaport were “under water” in 1660!
He’s right. And one thing many AGW proponents don’t consider (in addition to the non-linearity of climate) is the adaptability of humans. For readers here, I’ve taken that Flash animation at Racontours.com and made it into an animated GIF below:
 Flipbook of lower Manhattan harbor and city adaptation from 1660-2004. Images from Racontours.com
They write about this historical account of lower Manhattan:
Based on our study of historical maps of Manhattan, Racontours has been able to create this simulation of the expansion of the island’s coastline. This topic is covered in both our South St. Seaport and Lower Manhattan tours, and most people are amazed at the transformation that’s taken place. Pearl St, named for the seashells that washed up there, once ran along the river. (Click here for a view of Captain Kidd’s house at the corner of Pearl & Wall Streets)
The first land reclamation was undertaken by Peter Stuyvesant upon taking over as the colony’s governor in 1646. Hoping to facilitate waste disposal and transportation, he organized the excavation of the canal along what is now Broad St. Back then, this was still called New Amsterdam, and the Dutch were great believers in canals.
By the American Revolution, the city’s population had grown to 30,000, and land had become scarce and cramped in the city center. That’s when the city began to sell ‘water lots’, wherein entrepreneurs would seek to use landfill to create additional lots for use.
The most recent landfilled area led to the creation of Battery Park City, built in the 70′s on the earth excavated from the World Trade Center’s foundation.
Based on the 2.77 millimeters per year (call it 3 mm) of current sea level rise as shown by that Battery Tide gauge, in the 344 years (1660-2004) the sea level would have risen by:
344 years x 3 millimeters/year = 1032 millimeters or 1.032 meters.
Clearly, New Yorkers have been able to stay well ahead of that 1 meter rise since the city was founded.
The next time your friends get freaked out about sea level rise, or “high water”, show them this.
Oh! The magic of photoshop . . . . and the imagination of GIGO artists!
“It is very difficult for the honorable (hu) man to compete with a “crook” . . . unless of course you want to become one . . . ”
I heard that somewhere but I don’t remember who!
Now, back to looking for a job . . . . that does not entail being the “fall guy” for some scam artist!!!
Won’t the added weight of water depress the thin crust of the ocean floor, squeezing mantle material under the continents, thus forcing the continents to bob up, deform and break apart? Seriously, global warming might cause the entire world to crack up.
Once again . . . Forgot . . Notify me of follow-up comments via email.
The fact is that as CO2 levels have gone steadily up, and surface temperatures have trended unsteadily up, the rate of sea level rise has not gone up at all. That is the single most important fact for anyone to know about sea level rise.
We’ve done the experiment: After a 1/3 increase in atmospheric CO2, with atmospheric levels rising steadily over 2/3 of a century, the rate of sea level rise has not increased at all. The so-called climate scientists who predict catastrophic rates of sea level rise are expressing ideology, not science. The evidence is overwhelming: anthropogenic CO2 emissions do not lead to measurable increases in rate of sea level rise, and the climate models which predict otherwise have been falsified.
The median rate of sea level rise at the 159 GLOSS-LTT tide stations (average record length 85 years) is nearly identical to the geographically-weighted average rate: 1.1 mm/year (3.85 inches over the next 89 years). The higher numbers you see claimed by alarmists everywhere result from model-derived adjustments to the data. For instance, the widely used GIA adjustments from Peltier add 0.3 mm/year to account for a theorized sinking of the ocean floor. But even if the number is correct (which would be surprising, considering the lack of agreement between the model-predicted GIA numbers and GPS-derived measurements) that’s not actual sea level rise anywhere except the mid-ocean. It’s some sort of water balance accounting, not real sea level rise. By that sort of accounting, if there were zero global sea level rise, then a coastal tide station where there was neither uplift no subsidence going on would measure a 0.3 mm/year decline in sea level.
Grand claims of doom without even rubbish maths to back them up..a sure sign of pure BS
So its hardly surprising to find the facts don’t back them up.
‘He has developed a model in collaboration with researchers from England’ in other words CRU which tells you almost all you need to know .
‘Their model has been adjusted backwards to the actual measurements and was then used to predict the outlook for rising sea levels.’ Well that good I like to know that these were 150 years ago or even 100 , any got the data or are we talking rather less time so that the data is actual rather meaningless over over geographical time scales ?
In the UK. the Co-Op are good with FUD.
Probably already mentioned on WUWT but govt’s at all levels are planning for and counting on a rise in sea level, likely as a convenient excuse to grab more power. I heard on the radio a few days ago that there is a San Francisco bay area agency called ABAG i believe(unelected) that has deemed it has the power to regulate/deny any building construction within 100 yards of the bay because by its thinking this land will be under water by 2050 iirc.
Is there any way we can speed up this global warming thing to get the sea level to rise faster? All those flooded buildings will make great “structure” for fish and the fishing should be great.
Did they take account of vertical land motion in their study?
Your article leaves out the important fact that, on average, the human race has grown taller over the last several hundred years.
Now, that is clear evidence of evolutionary change in response to a survival threat challenge.
“Gullible’s Travels” rides again.
The whole CAGW and modelling Krew seem to have a revulsion towards the “adaptation” option. All their scenarios really aim for an ideal “scenario” where a completely passive response to weather/climate change is all that happens. But since 70,000 ya when the last/first cohort of modern humans clung to the east coast of southern Africa, to the migrations across the Bering Bridge, to the coastal hopscotch around the margins of all the continents, to the diking of the Netherlands, the entire history of homo sap has been non-stop adaptation.
Stasis is unavailable.
I have sent this email to Dr. Grinsted:
Dear Dr Grinsted,
I wonder if you have seen the discussion of your recent paper on
http://wattsupwiththat.com/2011/10/18/the-500-year-fud-about-sea-levels/#more-49429 ?
I would be very interested in your comments. In fact, I think it would be valuable if you were to make a response on the site.
Best regards,
Richard Barnes
I think that, when an email address is provided, the best policy is to invite the person to take part in the debate.
PS. What does FUD stand for?
nutso fasst says (October 18, 2011 at 12:05 pm): “Seriously, global warming might cause the entire world to crack up.”
I don’t know about the world, but CAGW scare stories crack me up all the time.
So Anthony, was this the week’s “Friday Funny”, or do we get two this week?
“FUD”: Fear, Uncertainty, and Doubt.
A marketing strategy employed by IBM long ago, and likely by many other companies and organizations, when they realize that they are losing in a competitive situation and want to raise (often or usually unfounded, or false) concerns in the prospect or customer or “sucker’s” mind, usually about their competitor.
Of course humans dumping solid matter into the seas to create new land will also increase the sea level as will all that sediment carried into the sea by rivers.
But just what is sea level? It can’t be measured against land height as that is in a state of constant flux and satellite measurements can’t be that reliable as the basins that the sea sits in are also continuosly changing shape and volume.
based on what happens with the emission of greenhouse gases and aerosols and the pollution of the atmosphere
They should be embarassed that this unscientific twaddle comes out of an institute named after one of the greatest scientists who ever lived.
“Stonyground says:
October 18, 2011 at 11:03 am
Zac makes a good point, if all the world’s glaciers and both ice caps did melt completely, it must be possible to calculate what the sea levels would be.”
The figure normally given is about 70 meters sea level rise, but that is probably on the high side since a fair amount of water would stay in the currently ice-covered parts of Greenland and Antarctica as lakes and rivers. Note that this requires complete deglaciation of interior East Antarctica where the current annual mean temperature is below – 50 Celsius (- 60 Fahrenheit), .
Jolly farmer says:
October 18, 2011 at 1:31 pm
FUD = Fear, Uncertainty & Doubt.
From Jolly farmer on October 18, 2011 at 1:31 pm:
F***ed Up Deception
Well actually, it might as well be that, but it”s really Fear, Uncertainty, and Doubt. For example:
The green curve on Grinsted’s graph (which, if I’m interpreting the caption correctly, is the “emissions stabilized in 10 yrs” scenario) shows sea level actually dropping after about 2300 AD.
So stopping CO2 emissions will even reverse the sea level rise that’s been occurring “naturally” for millennia!
Powerful stuff, that CO2.
To check the “sea-level rise is accelerating” bit, I went to the Colorado Uni sea-level pages, and this caught my eye: “2011 Release 2 (2011-07-19) … the rate increased slightly from 3.1 to 3.2 mm/yr due to the improvements to the TOPEX SSB model and replacement of the classical IB correction with the improved DAC correction, as noted above” (http://sealevel.colorado.edu/content/release-notes).
Given that by mid 2011 the sea-level rise had clearly slowed, this statement seemed curious.
Now it just so happens that I have two earlier downloads of the Colorado sea-level data, from a bit over 6 months ago and about a year ago. Graphing the three together shows how the data has been adjusted:
http://members.westnet.com.au/jonas1/ColoradoSeaLevelDataAdjustments.jpg
Why am I not surprised that earlier years’ data have been adjusted downwards and later years upwards?
SteveE says:
October 18, 2011 at 10:23 am
Do you not think that the sea level rise is more of a worry for the likes of place that receive a tidal surge during a cyclone, 60cm might make a large difference to places like Burma and Bengal.
As has been reported here before, tidal deltas actually rise with sea level – its an effect of the river flow and silting that forms the delta. The delta silting has more than accounted for the slow rate of sea level rise in Bangladesh – I think you will find that the land area has actually grown.
Thanks to those who answered my FUD question. I did business at a French grande école, so no fear, total certainty, and no word doubt in the dictionary.
In fact, the French students all had this attitude, making it very easy to beat them at the computerised business games. They put their faith in spreadsheets.
Sound familiar..?
In Nova Scotia, Canada, along the Northumberland Strait, sea level (apparent) was between 4 and 7 metres higher than present. This can be measured by examining the upper limit of raised beaches and wave cut platforms overlain by beaches. The difference of between 4 and 7 is because the wave cut platform is tilted and thus systematically varies in height along its exposure. This is due to differential isostatic uplift since the platform was cut by the ocean during the Sangamon Interglacial. One could argue that if all things were equal, one could expect a minimum of 4 metres of additional sea level rise if conditions matched those during the Sangamon. Simple? No!
Move now 150 kilometres southwest to the Atlantic side of Nova Scotia. Now one observes that sea level has transgressed the land, at present, beyond the point where there are any paleo-beaches or other raised marine features. Oops……. so does that mean that on the southern coast of NS we should expect another 4 metres of sea level rise. Is it because the southern coast is isostatically lower now then it was during the Sangamon?
I could go on but not. What is the conclusion ….. it is obvious. It is that geology is an non-exact science open to many different interpretations using the same data. It does not lend itself to `consensus’. Something as simple as sea-level rise in a province as small as Nova Scotia is complicated, and with a `large data set’ cannot be easily explained.
YET …… climate science has reached a consensus and you can;’t even get a consensus in NS on sea-level rise? Sorry if I am skeptical.
Now a question for the readers. I remember reading on (this site or another site) a discussion about using 2nd order, 3rd order, log or exponential functions on data to make predictions. The gist was that these functions naturally go crazy based on simply increasing time….thus they are worthless. Go crazy was not the proper term used …it sounded much better ….was much better and correct. Would someone point me in the right direction for that link?
2nd question..I have a data set of tide records for Halifax, Nova Scotia well exceeding 34,000 daily averages…… with weeks of work completed fixing `stuff’ in the data set. It is a 110 year old data set and one of only a hand full of these tide gauge records that are this long and more or less continuous. However, additional data exists that takes the record back to about 1850. Its British Admiralty paper data that I plan to acquire with great effort and time (I get paid to do it but it isn’t `big oil money’.
Based on an initial look at the date around 1900, and work by Gehrels, 2005(6), it will show a sudden increase in the rate of sea-level rise around 1910ish (doubling) … long before it could relate to CO2 forcing. This additional data does not exist in the peer reviewed scientific literature. I am looking for someone to assist me with a proper statistical analysis of the data set. Stats is not my specialty and no one else in my circle of peers is much better.
If anyone is interested e-mail me at philipfinck@eastlink.ca. The result will be peer reviewed and published, probably in a few different locations and I’m more than willing to give proper recognition for the work …we can discuss it. I’m open to suggestions and discussion on additional ideas of where, how, form of where it might additionally be used.
University of Gropenshaggin’.