There’s a saying, “timing is everything”. After reading this, I think it is more true than ever. In other news. Paul Vaughn is giving Bob Tisdale serious competition in the contest over who can fit the most graphs into a single blog post. ☺ There is a helpful glossary of symbols and abbreviation at the end of this post that readers would benefit from reading before the essay. A PDF version is also available via link at the end of the article. – Anthony
Guest post by Paul L. Vaughan, M.Sc.
Lack of widespread awareness of the spatiotemporal nature of interannual terrestrial oscillations is perhaps the most paralyzing bottleneck in the climate discussion.
North Pacific Pivot
Elegant factor analyses by Trenberth, Stepaniak, & Smith (2005) concisely chart the limits of linear climate exploration, providing strong clues that the North Pacific is a globally pivotal intersection.

D – T = -SOI (an index of El Nino / La Nina – details below in “Data & Symbols” section)
WUWT readers are well-acquainted with Tsonis, Swanson, & Kravtsov (2007). Recently Wyatt, Kravtsov, & Tsonis (2011b) shared the following on Dr. Pielke Senior’s blog:
“PNA participates in all synchronizations.”
Orientation for ENSO- & PDO-centric readers:

Complex Correlation
Simple linear correlation can do a part-way decent job of summarizing the preceding intrabasin relations, but properties of interbasin & interhemispheric multiscale spatiotemporal relations clarify the need for complex summaries. For example:

Limitations of linear methods are emphasized by Maraun & Kurths (2005). A mainstream audience might not appreciate their beautifully concise section 3 primer, but there’s a simple way to look at interannual spatiotemporal phasing.

The ~2.37 year signal which is so prominent in the equatorial stratosphere is also easily detected in the troposphere, but there’s clearly “something else” contributing to interannual tropospheric variation.

Note that when iNPI’ doesn’t “go with” iAAM & iLOD, it “goes against” them, much like a switch that is either “off” or “on”. Specialists like Maraun & Kurths might speak of coherence and illustrate the nonrandom distribution of phase differences.
Multiscale complex correlation (for example using adjacent derivative based complex empirical wavelet embeddings) can measure complex nonstationary relations where simple linear correlation fails catastrophically. Naive investigators unknowingly encounter Simpson’s Paradox by falsely assuming independence and blindly running linear factor analyses (such as PCA, EOF, & SSA) without performing the right diagnostics.
Northern Hemisphere Inter-Basin Interannual Coherence
Nonrandom phase relations explored by Schwing, Jiang, & Mendelssohn (2003):


Interannual Solar-Terrestrial Phase-Relations
Terrestrial phase relations with interannual [not to be confused with decadal] rates of change of solar variables, including solar wind speed (iV’), are nonrandom:


Inter-Hemispheric Interannual Phase-Relations
For those wondering how AAO & SAM fit in:


Global Synchronicity
Synchronicity’s the norm. Orientation, configuration, amplitude, & extent of globally constrained & coupled jets & gyres are pressured while network monitoring remains stationary. Regional temporal phase summaries are intermittently flipped by the stationary spatial geometry of monitoring networks in the turbulent global context.

Note particularly (in the last 2 graphs) the strong & stable interannual synchronicity of northern annular, southern annular, & global modes for the decade beginning ~1988. The commencement of the pattern coincides with concurrent abrupt changes in Arctic ice flow (e.g. Rigor & Wallace (2004) Figure 3) and European temperature (e.g. Courtillot (2010)).
Local Connection
Here’s how NPI relates to minimum temperatures at my local weather station:


Concluding Speculation
Terrestrial geostrophic balance is affected by the concert of changes in:
a) interannual (not to be confused with decadal) solar variations.
b) decadal amplitude of semi-annual Earth rotation variations – [see Vaughan (2011) & links therein].
c) solar cycle length – [see links in Vaughan (2011)].
Nipping Potential Misunderstandings in the Bud
“So you’re claiming the North Pacific controls global climate?”
No.
Why do I hear the same places mentioned every rush hour on the traffic report? Bottlenecks are easy places to detect changes in pressure & flow (whether global &/or locally intersecting), even using the simplest methods. Methods such as those suggested by Schwing, Jiang, & Mendelssohn (2003); Maraun & Kurths (2005); and Tsonis, Swanson, & Kravtsov (2007) help expand our vision towards the rest of the network. We have a lot of work to do (both exploratory & methodological).
Further Reading
Everything written by Tomas Milanovic at Dr. Judith Curry’s blog Climate Etc.
Vaughan, P.L. (2011). Solar, terrestrial, & lunisolar components of rate of change of length of day.
Referenced Above
Courtillot, V. (Dec. 2010). YouTube Video (~30min): Berlin Conference Presentation.
http://www.youtube.com/watch?v=IG_7zK8ODGA
Maraun, D.; & Kurths, J. (2005). Epochs of phase coherence between El Nino-Southern Oscillation and Indian monsoon. Geophysical Research Letters 32, L15709. doi10.1029-2005GL023225.
http://www.cru.uea.ac.uk/~douglas/papers/maraun05a.pdf
Rigor, I.; & Wallace, J.M. (2004). Variations in the age of Arctic sea-ice and summer sea-ice extent. Geophysical Research Letters 31. doi: 10.1029/2004GL019492.
http://iabp.apl.washington.edu/research_seaiceageextent.html
Schwing, F.B.; Jiang, J.; & Mendelssohn, R. (2003). Coherency of multi-scale abrupt changes between the NAO, NPI, and PDO. Geophysical Research Letters 30(7), 1406. doi:10.1029/2002GL016535.
Trenberth, K.E.; Stepaniak, D.P.; & Smith, L. (2005). Interannual variability of patterns of atmospheric mass distribution. Journal of Climate 18, 2812-2825.
http://www.cgd.ucar.edu/cas/Trenberth/trenberth.papers/massEteleconnJC.pdf
Tsonis, A.A.; Swanson, K.; & Kravtsov, S. (2007). A new dynamical mechanism for major climate shifts. Geophysical Research Letters 34, L13705.
http://www.nosams.whoi.edu/PDFs/papers/tsonis-grl_newtheoryforclimateshifts.pdf
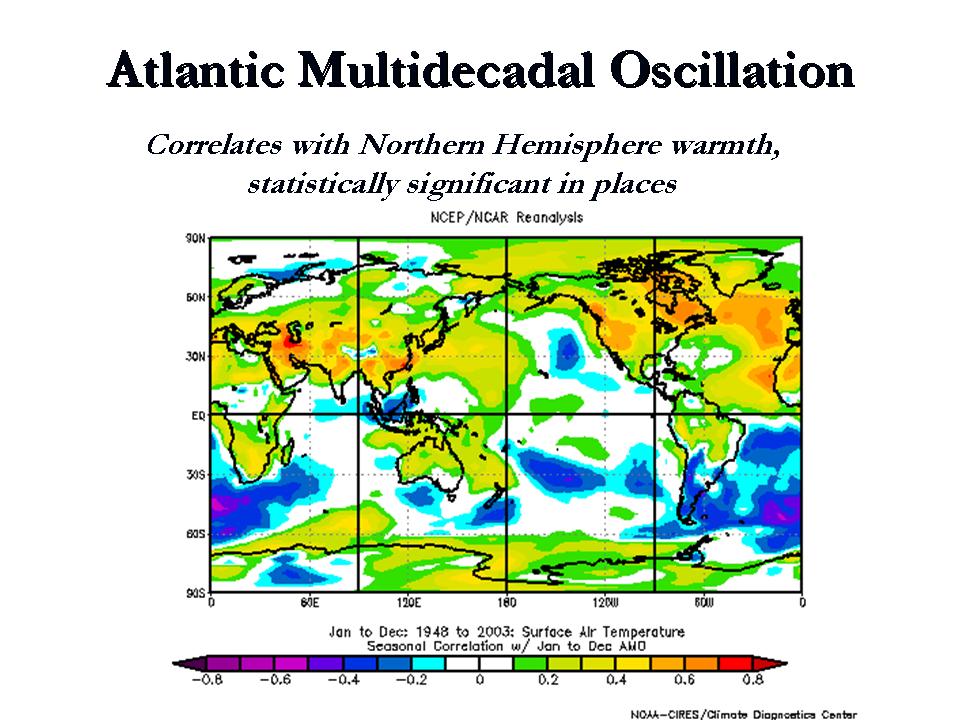
Wyatt, M.G.; Kravtsov, S.; & Tsonis, A.A. (2011). Atlantic Multidecadal Oscillation and Northern Hemisphere’s climate variability. Climate Dynamics. doi: 10.1007/s00382-011-1071-8.
Since (to my knowledge) there’s not yet a free version, see the conference poster and the guest post at Dr. R.A. Pielke Senior’s blog for the general idea:
a) Wyatt, M.G.; Kravtsov, S.; & Tsonis, A.A. (2011a). Poster: Atlantic Multidecadal Oscillation and Northern Hemisphere’s climate variability.
https://pantherfile.uwm.edu/kravtsov/www/downloads/WKT_poster.pdf
b) Wyatt, M.G.; Kravtsov, S.; & Tsonis, A.A. (2011b). Blog: Atlantic Multidecadal Oscillation and Northern Hemisphere’s climate variability.
Important Note: While Wyatt, Kravtsov, & Tsonis (2011) are likely to stimulate a lot more discussion once a free version of their paper becomes available, it needs to be pointed out assertively & clearly that the cross-correlation approach, while informative, is patently insufficient for determining the full nature of terrestrial spatiotemporal phase relations.
Appendices
In the appendices that follow, attention is concisely drawn to key items that are consistently underappreciated in climate discussions.
Appendix A: Spatial Influence on Phase – Important
Nonrandom phase relations demand careful focus on the spatial dimension. Temporal evolution isn’t the only thing driving apparent phase.
If features grow, shrink, rotate, change shape, reflect, or move relative to the stationary windows in which they are measured, phase is affected.


The effect on summaries is plain & simple. (Anyone previously puzzled by “integration across spatiotemporal harmonics” might now get the general idea.)
Appendix B: Reversals in Temperature-Precipitation Relations
Blink between winter & summer panels of Figure 6:
Trenberth, K.E. (2011). Changes in precipitation with climate change. Climate Research 47, 123-138. doi: 10.3354/cr00953.
http://www.int-res.com/articles/cr_oa/c047p123.pdf
Temperature-precipitation relations are a function of absolutes, not anomalies. This is fundamentally important.
Insight from my local (ABC) example:


Appendix C: Global Distribution of Continental-Maritime Contrast
High-amplitude regional variance leverages global summaries, but multidecadal variations often draw misguidedly narrowed focus to the North Atlantic Ocean when it is the global distribution of continental-maritime contrast (in relation to flow patterns) that should be attracting the attention. Noting the position of the relatively small North Atlantic in this broader context, carefully compare:
1. http://icecap.us/images/uploads/AMOTEMPS.jpg
2. Figure 10 here:
Carvalho, L.M.V.; Tsonis, A.A.; Jones, C.; Rocha, H.R.; & Polito, P.S. (2007). Anti-persistence in the global temperature anomaly field. Nonlinear Processes in Geophysics 14, 723-733.
http://www.icess.ucsb.edu/gem/papers/npg-14-723-2007.pdf
Data & Symbols
‘ indicates rate of change
[ ] indicates time-integration
AAM = Atmospheric Angular Momentum
AAO = AntArctic Oscillation
ABC = Agassiz, British Columbia (west coast of Canada near USA border)
AO = Arctic Oscillation
COWL = Cold Ocean, Warm Land index
D-T = -SOI = – Southern Oscillation Index = pressure difference between Darwin & Tahiti (an indicator of El Nino / La Nina cycling)
ENSO = El Nino / Southern Oscillation
i = interannual
LOD = Length Of Day
NAO = North Atlantic Oscillation
NPI = North Pacific Index
PDO = Pacific Decadal Oscillation
PNA = Pacific North America index
PPT = PreciPiTation
QBO = QuasiBiennial Oscillation
SAM = Southern Annular Mode
SOI = Southern Oscillation Index
T = Temperature (°C)
V = solar wind speed
x = extreme
Data links available upon request.
Acknowledgements
Sincere thanks to Anthony Watts, the WUWT Moderation Team, readers, and all those who make valuable contributions towards a deeper understanding of nature.
==========================================================
PDF Version of this essay available here Vaughan, P.L. (2011). Interannual Terrestrial Oscillations (375KB)
Lots of graphs in one post is good; lots of colored lines in one graph is not good.
Probably would benefit from some animated blink-o-graphs.
That all the terrestrial relations are correlated in complicated ways simply show that they are not independent, which we would not expect in the first place. Heaping more of these on top of what is already there will make no difference at all because the inter-dependencies are still there.
This: “Multiscale complex correlation (for example using adjacent derivative based complex empirical wavelet embeddings) can measure complex nonstationary relations where simple linear correlation fails catastrophically” is just spatiotemporal mumbo-jumbo with no physical content. I shall not shy away from calling the emperor’s new clothes what they are.
The only part that fall outside that web of interdependencies is the claim: “Terrestrial phase relations with interannual [not to be confused with decadal] rates of change of solar variables, including solar wind speed (iV’), are nonrandom”. Both solar activity and atmospheric variability consist of ‘episodes’ of 1-3 years duration [with no spatial relationships whatsoever]. So any ‘multiscale complex correlations’ will always find some coherence over the limited time span we have data for because the underlying data are themselves not random. This does not mean that the data is related in any way.
I don’t pretend to understand most of the science behind this (I’m just a Mechanical Engineer), but what seems obvious to me is that all the factors involved in climate must be considered and it’s not only more complicated than we know, it’s more complicated than we can know (apologies). But I venture, with as much common sense as I can muster, the local star is the single most important variable in the whole system. Everything else must flow from that. I suppose climate could be modeled (simply and inaccurately) as a “spring-mass-damper” system with the forcing mechanism being total solar energy. Does that make some sort of sense?
I agree.
Here’s a beautiful illustration of a bunch of cycles synchronized in a non-obvious manner:
link
Obviously, CO2 aligns these variables to increase global temperature. /sarc off
If this article is a joke, it’s a lot of effort for negligible result. If it’s serious, it’s simply incomprehensible; the level of gobbledygook-jargon is intolerable. If there is something to say here, please say it in English!
I don’t even pretend to understand what the article is really getting at. It seems like a lot of “A tracks with B — except for when it doesn’t. And a lot of things all seem to change at about the same time.” Not sure what any of that means, honestly.
What language is this written in? Overbearingly Smug?
I received this from a student it would have been sent back for rewrite. Structure is wrong (fails to start small and build to a main point in a logical progression), it is aimed at the wrong target audience and assumes way to much base understanding.
Looked more like “Baffle them with BS” than a “Blind them with brilliance”
Suffers from “Look at all the pretty colors” syndrome.
And I am not sure yet what the hell the point was.
Concluding Speculation
The whole point is:
Terrestrial geostrophic balance is affected by the concert of changes in:
a) interannual (not to be confused with decadal) solar variations.
b) decadal amplitude of semi-annual Earth rotation variations – [see Vaughan (2011) & links therein].
c) solar cycle length – [see links in Vaughan (2011)].
Is that something new? Or a confirmation that their is no CO2 affect?
No offense, you’ve put a lot of work into this.
But… what are your conclusions? There’s lots of variability on various scales, does that mean anything regarding climate change? Do any of these fairly short term periodic and aperiodic fluctuations add up to anything meaningful, or indicating a long term trend?
commieBob
Great video! I think I need a drink, now, though…
One of the reasons I wanted to post this was to see the reaction. Whatever you’re thinking, please say it.
I’m particularly curious to hear from the Tsonis, Swanson, & Kravtsov (2007) fans […and we know there are a good number of them around].
Thanks sincerely to those who have taken the time to comment. I look forward to carefully reading what others have to say.
I also have a request of the community. There’s a slide in Jasper Kirkby’s recent SFU IRMACS presentation that I need to find in the literature. (I’ll look up the time-index tomorrow…)
Best Regards.
I’m sorry, but you lost me with “Elegant factor analyses by Trenberth…”
Putting the word “elegant” in the same sentence as “Trenberth” seems contradictory, unless in the context about “Trenbreth’s elegant emails written to cover up climate skullduggery” or some such.
http://wattsupwiththat.com/2011/01/13/trenberths-upcoming-ams-meeting-talk-climategate-thoughts/
Paul,
May I be so bold to say that you are on to something…but, be that as it may, the Newspeak interannual blah blah blah stuff…has got to go.
In science, as you well know….might does not make right,
As a matter of fact…it often creates error.
Just by nomenclature alone, you open yourself up to criticism from the wolves….such as Dr. S.
And actually, besides rigorous tests…their criticism is is well-founded. Nobody knows what the hell you are talking about. You have to define it more clearly.
Your friend,
Chris
Norfolk, VA, USA
Leif Svalgaard wrote (May 15, 2011 at 5:41 pm):
“That all the terrestrial relations are correlated in complicated ways simply show that they are not independent, which we would not expect in the first place. Heaping more of these on top of what is already there will make no difference at all because the inter-dependencies are still there.”
Well put Leif.
Now try to explain that to climate science & statistical science, which insist on drawing so-called “conclusions” based on PATENTLY FALSE assumptions of independence.
You nicely make my PRIMARY point.
Leif Svalgaard wrote (May 15, 2011 at 5:41 pm):
“This: “Multiscale complex correlation (for example using adjacent derivative based complex empirical wavelet embeddings) can measure complex nonstationary relations where simple linear correlation fails catastrophically” is just spatiotemporal mumbo-jumbo with no physical content. I shall not shy away from calling the emperor’s new clothes what they are.”
Can you be more specific about what you find so offensive about Maraun & Kurths (2005) section 3 and related methodologies?
I’m not a scientist either, but I think I got a conclusion from this (accepting that it could have been written more clearly): standard linear analysis fails to recognise correlations between between non-random cyclical events because it cannot take account of the fact that, in a spatio-temporal chaotic system, the changes you are measuring move around. Sometimes therefore, your data will appear to be out of phase when it is in fact in-phase.
Perhaps this is something all other readers of WUWT were aware of, but it wasn’t something I’d thought of before!
CRS, Dr.P.H. says: “Putting the word “elegant” in the same sentence as “Trenberth” seems contradictory…”
Well, I beg to differ. Here are two well-known Trenberthisms:
“I remain somewhat skeptical… It is hard to make data where none exist.” (regarding Steig et al)
“The fact is that we can’t account for the lack of warming at the moment and it is a travesty that we can’t.” (from the Climategate emails)
These quotes are brief, pithy, very much to the point, and accurate. In short, elegant.
“absolutes not anomalies”
i love it!
Paul,
Does the variation represented in the vertical axis represent the state of the correlation between the indices. If not, then what?
The link to Pielke Senior between the first and second charts did not work for me.
~~~~~~~~~~~~~~~~~~
Next, I think this post fits nicely with Donald Rumsfeld’s explanation of knowns and unknowns. Namely . . .
“Lack of widespread awareness of the . . .
I am aware of the Pacific Decadal Oscillation (PDO) but I do not understand why it exists, what it is doing, nor why it changes when it does. The same can be said for many of the other oscillations mentioned, and thus this is somewhat of a “paralyzing bottleneck” toward improving my personal know, don’t know, don’t know that I don’t know list of things. The post does inform me that there seem to be a lot of known (by somebody) things that I do not know about “the spatiotemporal nature of interannual terrestrial oscillations” and will never know much about most of them.
That seems to be the general purpose of the exercise and in that sense it has succeeded.
I read it backwards on tape and Bill Clinton said “I did not have sex with that woman”.
Paul Vaughan says:
May 15, 2011 at 10:16 pm
Now try to explain that to climate science & statistical science, which insist on drawing so-called “conclusions” based on PATENTLY FALSE assumptions of independence.
I don’t think they are doing that. It seems to me that they are well aware of the fact that almost all measures of atmospheric variability are strongly correlated with each other and hence not independent.
Paul Vaughan says:
May 15, 2011 at 10:27 pm
Can you be more specific about what you find so offensive about Maraun & Kurths (2005) section 3 and related methodologies?
I don’t find them ‘offensive’. I fail to see [could simply be a failure on my part] what they bring to the table that is not trivial, new, and interesting. What do we learn that we did not already know? Where is the phenomenon that ONLY can be discovered with their methodologies? and that will not yield to standard techniques.
Now, in my field, we deal with the ultimate in spatio-temporal analysis: successful helioseismic exploitation of the integrated effect of millions of standing waves observed simultaneously over the entire solar disk. We don’t have any difficulties with what you call ‘abstract conceptualization’ [although it is not quite clear to me what you mean]. I don’t think people that search for oil with seismic techniques have difficulties either, so I fail to see how the formalisms you are pushing will improve something that works quite well already.
Paul
Your article may be a goldmine for more enthusiastic reader, but I felt overwhelmed by methodology of the presentation.
Inter annual oscillations very often have appearance of random noise. One could consider this to be a case with the Multivariant ENSO or the closely related Southern Oscillation Index (SOI).
My short excursion into analysis of these events has found a close correlation with a non-climate process with power and the means to influence, or even drive ENSO.
http://www.vukcevic.talktalk.net/SOI.htm