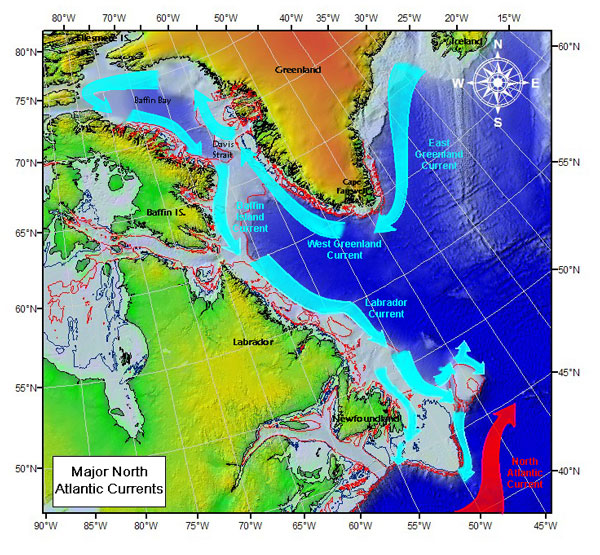
Current research for the East Greenland Current (EGC) has been focused on freshwater fluxes from melting ice. Because the EGC runs through the Greenland Sea and eventually through the Labrador Sea (as the West Greenland Current) it can have strong implications for the strengthening and or weakening of deep water formations in the Greenland and Labrador Seas. The finding of no trend is significant. If there was an increasing trend, it would indicate increased freshwater incursions from Greenland due to melting. The EGC also transports a lot of icebergs, and is said to be responsible for pushing the berg that sunk the Titanic.
Here’s figure 2 from the paper, it seems pretty darned flat to me. (thanks to Dr. Leif Svalgaard for fetching the paper for me):
; blue triangles: AR7E transports. Grey areas represent the errors”] From the American Geophysical Union journal highlights:
Probe of influential Greenland current finds no trend
The East Greenland–Irminger Current (EGIC), which flows southwestward along the eastern coast of Greenland, is important because variability in the EGIC likely influences convection in the Labrador and Irminger Seas, and could affect the global meridional overturning circulation. Daniault et al. present new measurements of the EGIC transport variability from 1992 to 2009 based on satellite altimetry data and 2 years of data from a moored array.
They find that the EGIC transport was close to average from 1992 to 1996, decreased between 1997 and 2005, and has increased since 2006. Beyond this decadal variability, the researchers find no significant trend in the 1992-2009 EGIC transport time series, confirming that EGIC transport variability has not changed significantly over the past two decades.
Source: Geophysical Research Letters, doi:10.1029/2011GL046863, 2011
http://dx.doi.org/10.1029/2011GL046863
The 1992–2009 transport variability of the East Greenland-Irminger Current at 60°N
N. Daniault
Laboratoire de Physique des Océans, UMR 6523, Ifremer, CNRS, IRD, Université de Bretagne Occidentale, Brest, France
H. Mercier
Laboratoire de Physique des Océans, UMR 6523, Ifremer, CNRS, IRD, Université de Bretagne Occidentale, Plouzané, France
P. Lherminier
Laboratoire de Physique des Océans, UMR 6523, Ifremer, CNRS, IRD, Université de Bretagne Occidentale, Plouzané, France
The East Greenland Irminger Current (EGIC) decadal transport variability likely influences deep convection intensity in the Labrador and Irminger Seas but is poorly known yet. The EGIC transport west of the 2000 m isobath was estimated, for the first time, between 1992 and 2009 by combining surface geostrophic velocities derived from altimetry with an estimate of the vertical structure of the transport variability statistically determined from a moored array deployed in 2004–2006. The reconstructed 17-year time series of the EGIC transport was then validated against independent estimates confirming that, indeed, the vertical distribution of the EGIC variability has not changed significantly over the last two decades. The 1992–2009 mean transport is 19.5 Sv with a standard error of 0.3 Sv (1 Sv = 106 m3 s−1). In 1992–1996, the EGIC transport was close to the average. Over the following decade (1997–2005), the EGIC transport declined by 3 Sv (15%) so that the 2004–2006 mean transport inferred from the moored array is 2.2 Sv (10%) less than the 1992–2009 mean. It was followed by a period of higher transport. The seasonal to interannual transport variability is coherent with the variability of the windstress curl at the center of the Irminger Sea.
Just wait until these guys come for CNRS funding…
At this rate, the Greenland ice sheet will take forever to melt! (literally, n/0 = infinity).
Catastrophic change would be evident f the data had been “adjusted” by a peer approved climate scientist.
Yet the believers keep telling us it’s worse than we thought. Study after study keeps telling us there is nothing unusual with the weather or climate.
Here is some historical perspective:
Nothing to see here, move along folks.
everyone should read Erl Happ
http://climatechange1.wordpress.com/2011/04/20/the-common-sense-of-climate-change/
They need to turn that info over to Dr. Mann so that he can apply his magical statistics to it to find the warming trend in all that noise.
I’ve just plotted Hadley SST rate of change with various smoothing.
Several things are notable.
*Since 1995 the rate of warming has dropped.
*The max rate of recent warming was not unusual in the temperature record, it has been higher.
*The last 50-60 years has been unusual in the *stability* of the rate of change. Previous changes have been much more dramatic.
*The last 50-60 years’ rate of change has been notably less than the pre-WW2 period.
On the other hand this period has been the longest sustained rise without a deep trough. It like we may have expected a trough around 1984 but it was only slight. (Though that obviously cannot be put down to AGW.)
Cooling clearly has been slowing down for about 15 years now. It’s difficult to see why Hansen believes it will start to accelerate. More to do with life long held beliefs that science.
As with the Greenland data , no warming under here.
Fairly soon, Mann will find a way to “read” tea leaves for temperature proxies.
just a couple more notes on the SST rate of change I posted above.
There is recent cooling though only seen in the lightest filter which removes variations up to the scale of the sunspot cycle. The recent prolonged minimum is having its effect.
the medium filter which starts to attenuate the primary sunspot cycle but retains the 22y cycle shows slower warming but it’s still positive at the end of filter.
The longer term filter which removes most signals shorter than 40y shows warming still rising at the end of the filter period which stops around 1995 when warming started to slow, though it can be seem to be levelling off and appears to be at the top of a peak.
Short of a severe negative trend as seen around 1900 and 1940 it seems unlikely that even the blue curve will hit negative territory in the forseeable future. If an even like that was due it would probably have occured in the 80’s . There is a small trend at that time but it was not dominant.
It appears that we can expect a notably reduced warming trend over the next twenty years. After that it’s anybody’s guess. And with a chaotic system like climate it will be a guess , however fancy your computer is.
So, every variable remains within natural variability. How can these alarmists keep seeing the human fingerprint on these natural variations?
Now, where did I put that letter of Sir Joseph Banks’, President of the Royal Society, 1817, written to the Lords of the Admiralty, bringing to their attention the lack of ice in the Arctic Circle & a new source of warmth in that area????
Q. How many peer reveiwed reports & papers do there have to be demonstrating that the “official view” is wrong, before the “official view” is changed? Surely there must be a “puter” that can give me the answer!
Study of the East Greenland Current finds no trend
That’s too bad. The map doesn’t go south far enough to show how the Labrador Current follows the coast and heads east just north of Cape Cod, where the Gulf Stream curls eastward as well on the south of the Cape. I remember summers in northern Mass. in the 60s with temps in the 90°+ range, sand too hot to walk on in bare feet that wore no shoes but in school and church for eight months of the year. Going in the water for relief was a temporary affair, one emerged literally blue within 5-10 minutes.
I try to keep abreast of these studies due to a related interest in New England’s codfish fisheries.
There are some Alarmist studies that suggest the colder currents are slowing/warming. I have no links, but recall one over at the Accuweather site around six months ago. The premise was that certain plankton skeletons from sea-bottom cores could be used as a proxy. A certain isotope was absorbed more by plankton in warmer waters than in colder waters. A graph was produced which showed steady temperatures in the past, and a recent rise.
I stirred things up at the site by questioning the proxy. I questioned it because it showed no MWP or LIA. I also wondered if the simple process of leeching-out might give one past data that was nice and flat, and the “recent rise” might be due to the fact the sample hadn’t leeched-out yet.
I only bring this up to demonstrate the variety of views that exist, concerning these currents.
One thing that I’m curious about, which could use more study, is the amount of upwelling involved. (Upwelling brings up nutrients and causes surges in fish populations.) Quite a variety of views exist concerning the existence, nature, and location of such upwelling in the Labrador Current.
P. Solar
There is recent cooling though only seen in the lightest filter which removes variations up to the scale of the sunspot cycle. The recent prolonged minimum is having its effect.
Ignoring there is no correlation between SST and sunspots (or there is about the same correlation as between a 9 yr sinewave and a 11 yr sinewave). http://virakkraft.com/HadSST-sunspot.png