UPDATE: Live The last radar image from Willis Island added below. The last radar image is truly striking.
Also, see below for the differences between the Australia hurricane scale and the familiar Saffir-Simpson scale used in the USA. They are not equal.
From Australia’s BoM, time to “get outta Dodge” as they say:

Simon at Australian Climate Madness notes this for rebuttal of the inevitable “Yasi caused by global warming” links that will be pushed on the blogs and by the press:
Tropical cyclone Mahina hit on 4 March 1899. It was a Category 5 cyclone, the most powerful of the tropical cyclone severity categories. In addition, Mahina was perhaps one of the most intense cyclones ever observed in the Southern Hemisphere and almost certainly the most intense cyclone ever observed off the East Coast of Australia in living memory. Mahina was named by Government Meteorologist for Queensland Clement Wragge, a pioneer of naming such storms.
Here’s what BoM has to say on their tracking page:
The forecast path shown above is the Bureau’s best estimate of the cyclone’s future movement and intensity. There is always some uncertainty associated with tropical cyclone forecasting and the grey zone indicates the range of likely tracks of the cyclone centre.
Due to the uncertainty in the future movement, the indicated winds will almost certainly extend to regions outside the rings on this map. The extent of the warning and watch zones reflects this.
This product is designed for land-based communities; mariners should read the coastal waters and high seas warnings.
Remarks:
SEVERE TC YASI IS A LARGE AND VERY POWERFUL TROPICAL CYCLONE AND POSES AN EXTREMELY SERIOUS THREAT TO LIFE AND PROPERTY WITHIN THE WARNING AREA, ESPECIALLY BETWEEN CAIRNS AND TOWNSVILLE.
THIS IMPACT IS LIKELY TO BE MORE LIFE THREATENING THAN ANY EXPERIENCED DURING RECENT GENERATIONS.
TC Yasi, CATEGORY 5, will continue to move in a west-southwesterly direction during the day. The cyclone is expected to cross the coast in the Innisfail area at about midnight.
Coastal residents within the warning area, and particularly between Cairns and Ayr are specifically warned of an EXTREMELY DANGEROUS SEA LEVEL RISE [i.e. storm tide] as the cyclone approaches, crosses the coast and moves inland. The sea is likely to steadily rise up to a level which will be VERY DANGEROUSLY above the normal tide, with EXTREMELY DAMAGING WAVES, STRONG CURRENTS and FLOODING of low-lying areas extending some way inland. People living in areas likely to be affected by this flooding should take measures to protect their property as much as possible, and be prepared to follow instructions regarding evacuation of the area if advised to do so by authorities.
DAMAGING WINDS with gusts to 90 km/hr that are currently developing on coastal islands, are forecast to develop about the coast by late morning and about the tropical interior overnight.
Between Cape Tribulation and Ingham these winds will become DESTRUCTIVE with gusts in excess of 125km/hr during the afternoon and early evening and VERY DESTRUCTIVE with gusts up to 300 km/hr between Cairns and Ingham during the evening as the cyclone approaches and crosses the coast. These VERY DESTRUCTIVE winds can also occur on the seaward side of hills to the north of the cyclone and are also forecast to reach the Atherton Tablelands.
Winds are forecast to ease about the east coast during Thursday morning as the cyclone moves inland.
FLOODING RAINS will develop from Cooktown to Sarina during the afternoon and then extend inland overnight.
People between Cape Melville and Sarina, extending inland to Croydon and Richmond should complete preparations quickly and be prepared to shelter in a safe place.
– Boats and outside property should be secured.
– For cyclone preparedness and safety advice, visit Queensland’s Disaster Management Services website (www.disaster.qld.gov.au)
– For emergency assistance call the Queensland State Emergency Service (SES) on 132 500 (for assistance with storm damage, rising flood water, fallen trees on buildings or roof damage).
People about the remaining tropical interior east of Camooweal and north of Winton should consider what action they will need to take if the cyclone threat increases.
– Information is available from your local government
– For cyclone preparedness and safety advice, visit Queensland’s Disaster Management Services website (www.disaster.qld.gov.au)
– For emergency assistance call the Queensland State Emergency Service (SES) on 132 500 (for assistance with storm damage, rising flood water, fallen trees on buildings or roof damage).
Name: Severe Tropical Cyclone Yasi
Details:
| Time (EST) | Intensity Category | Latitude
(decimal deg.) |
Longitude
(decimal deg.) |
Estimated Position
Accuracy (km) |
|
|---|---|---|---|---|---|
| 0hr | 7 am February 2 | 5 | 16.1S | 150.9E | 20 |
| +6hr | 1 pm February 2 | 5 | 16.7S | 149.1E | 45 |
| +12hr | 7 pm February 2 | 5 | 17.2S | 147.5E | 75 |
| +18hr | 1 am February 3 | 4 | 17.8S | 145.8E | 100 |
| +24hr | 7 am February 3 | 2 | 18.5S | 144.1E | 130 |
| +36hr | 7 pm February 3 | 1 | 19.8S | 141.1E | 190 |
| +48hr | 7 am February 4 | tropical low | 20.9S | 138.4E | 250 |
The next Forecast Track Map will be issued by 11:00 am EST Wednesday
===============================================================
UPDATE:
Commenter sHx writes:
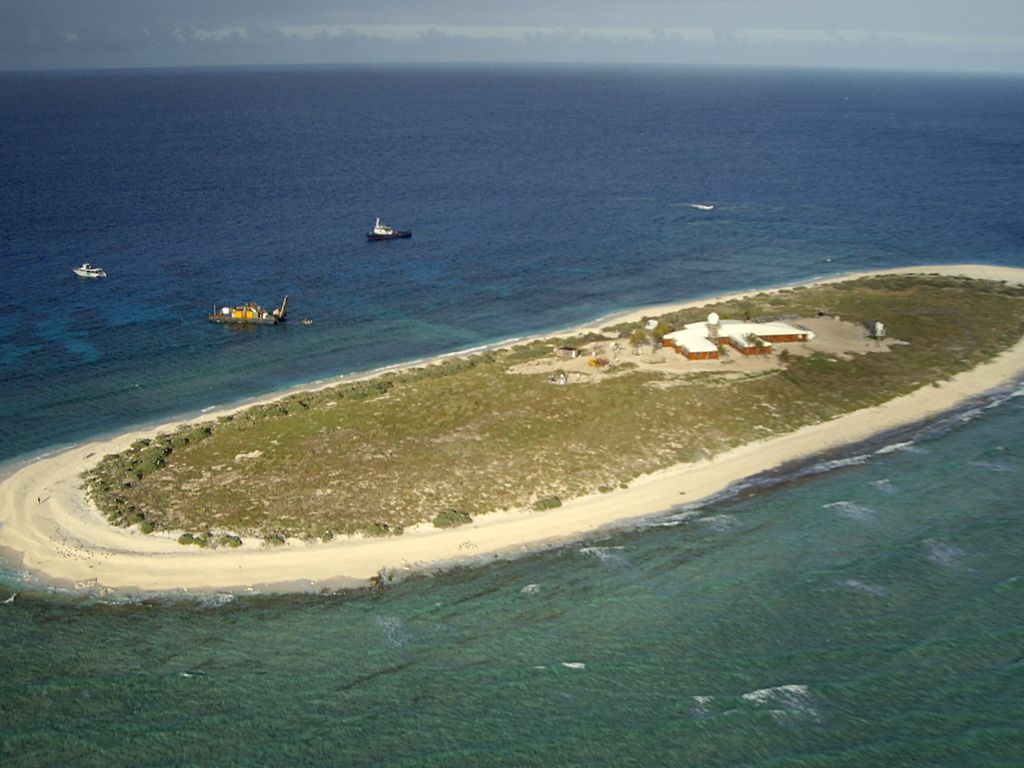
AS of this moment Yasi is right on top of Willis Island. http://en.wikipedia.org/wiki/Willis_Island
Apparently the island has a meteorological post. It even has radar! http://www.bom.gov.au/products/IDR412.loop.shtml

It must be frightening to be that radar operator looking at this, knowing when that eyewall hits you are going to be subject to Cat5 winds and you have a 30meter tall radar tower right next to you, and there’s really no shelter elsewhere on the island and no place to go. I wonder how long we’ll continue to get a signal from the Willis Island’s radar?
UPDATE2: Just about the time I pressed “update” the radar went out, the radar station is offline. The last image from the station is above. We hope for the best for the BoM employees there. The storm surge must be ferocious. Hopefully BoM evacuated them and they left the radar on “auto”. Given the size and composition of the island versus the size of the hurricane, Willis Island may very well be erased by this storm.
===============================================================
Good luck to our friends in Queensland, especially Dr. Bob Carter and Nigel, who helped during my tour in Townsville last year.
===============================================================
UPDATE 3: Hurricane expert Dr. Ryan Maue brings to our attention the differences in tropical cyclone scales. The Saffir-Simpson scale used maximum sustained one-minute winds while the Australian Region scale uses ten-minute averaged sustained winds. The convention to convert is (10-minute)*1.14 = 1-minute sustained (units are knots). This image combined from Wikipedia’s article.

The JTWC advisory intensity at 00Z Feb 2 of 125 knots is a strong Category 4 on the Saffir-Simpson scale. The Australian Bureau of Meteorology reports central pressure of 930 hPa, and backs out Category 5 winds from that. Also, feel free to call Yasi a “willy-willy“.
Discover more from Watts Up With That?
Subscribe to get the latest posts sent to your email.
Reply to Ross Brisbane’s comments.
Cyclone Yasi has just passed my beach home just north of Townsville, and heading inland as it weakens. I have lived 70+ years in the North Queensland , and I have seen many severe cyclones as I worked all over this area. When I was a lad the informed senior locals used to judge a severe cyclone by the degree that the winds bent coconut trees nearly parallel to the beach. They had no satellite image to tell them how strong it was.
As Yasi moved towards the coast and before the BoM figures were released on the actual wind speeds in cities like Townsville and Cairns became available, I reflected on past years and I recalled lower wind speeds with cyclones that had large “eyes”.
I therefore questioned the forced evacuations, and the projected storm surge figures that were being projected by the government authorities as Yasi had a large “eye”..
As the forced evacuation only affected those people in the projected storm surge area, a lot of my family and friends choose to stay in their homes that since the 1970 period
have been largely bought up to the catagory 3 standard and their buildings are all O.K…
It will be interesting to see a report by JCU’s building strength team on the cyclones impact on dwellings in the cyclones area of influence. It is a fact that all cyclones are frightening events to live through, but the theory that AGW has caused much stronger cyclones that some political people chose to pronounce is false in my view. Science must be proven to be acceptable to me, and AGW science on the CO2 influence is far from proven.
A G Fostesr gives some lovely satellite images –
February 1, 2011 at 7:33 pm
MTSAT visible (stationary): http://www.goes.noaa.gov/FULLDISK/MTVS.JPG
MTSAT infrared (stationary): http://www.goes.noaa.gov/FULLDISK/MTIR.JPG
On each, there is a peculiar feature on the north front of the 2,000 km of cloud that stretches eastwards from the spiral, way out into the Pacific. This is the “feathery” appearance of filaments a hundred km or more long, pointing to the north like teeth on a comb. My instinct was that these were clouds forming and being drawn south; but on time lapse, they start in the white mass and stretch out northwards like tendrils. They are new to me and I lack key words to search. Anyone able to explain?
graham g
You said:
Science must be proven to be acceptable to me, and AGW science on the CO2 influence is far from proven.
I say:
Well I tell you as fact as I have looked into projections over the next process of temperatures going higher. Based on quantum calculations of the greenhouse effect which is an established law of physics in science it is solid science. There will indeed be even stronger Cyclones as we glimpse into the long sighted looking glass in a warmer global climate. I have seen the models based on a 1 degree Celsius projection and cyclonic aberrations will indeed intensify. They will get very frightening by 2050.
The science papers are out there for anyone to check. No I am not referring to the IPCC or Gore presentation stuff. Many of these papers are not even in the 2007 IPCC reports. Science has made quantum leaps in what know about climate now. The knowledge and objective measurements of such events far exceed the knowledge we had even 10 years ago. They are more accurate and lift the mystery from these events. It is not then a wild off the cap idea of the cliché verbal it is climate change – no. It’s really making a statement that a warmer planet predisposes these Cyclones to develop much larger then they may have been.
I also consider the fact you did not evacuate you are lucky that it did not swing right in your path – we know about the girth of its eye but you were indeed playing with fire based on your own knowledge. I personally would not have done that. More over the precautionary principle would have cut in for me. Not based on some notion of political disagreement to prove some satisfactory point. Rather I would look at my wife and my children in the eye and do the best thing for their safety.
Why is it the older folk think they have better survival skills and better judgments. I recall as a very young child the great rains of the late 50s in QLD – I do not recall my father ever alluding to 75% of the State in a state of flooding all at the SAME time. I knew that cyclones were on the way. In fact I said to a few in 2007 there would be so much water in the dams that a Brisbane flood would eventuate. I made those statements based on few trends – a globally warming earth and the switch to a very strong La Nina event. Now I was also influenced by what I read in those models that showed this an inescapable event.
We live in dynamic changes. God bless.
Smokey says: February 1, 2011 at 10:01 pm:
“There are no folks I admire more than Australians. It wouldn’t bother me at all if they ruled the world.”
Goodly point Smokey, but too much time explaining our sense of humour me thinks.
And that we actually like our weather and Constitution. Well the majority of us that is.
“”””” Ross Brisbane says:
February 2, 2011 at 6:08 pm
Smokey,
I can answer your objection but on terms of what caused the warming.
…………………………………….
So what do we have – CO2 did not cause directly the storms and it does not work that way.
What CO2 does is create the mechanism and first cause to warming “drift” in climate – its called nudging. The rest is how water vapor/clouds/oceans RESPOND – climate sensitivity. “””””
Ross, have you ever considered just how untenable that position is ?
So CO2 ‘starts the ball rolling’ by just giving the climate a nudge (off top dead center I presume) and then H2O takes over.
Last time I checked, Water vapor, Clouds, and oceans, were ALL mostly H2O, not CO2.
The only energy transport mechanism, active in the earth climatic environment, that in any way involves CO2, is the LWIR Radiant emissions from earth surface/oceans/atmosphere captured by CO2 in what is called the “Greenhouse effect” except we know green houses don’t really work that way.
No other energy transport process, such as upward atmospheric convection for example, involves CO2 or any other non-condensing GHG.
So the whole thing was in a nice stable “equilibrium” until MAN came, and introduced some CO2 to the atmosphere ??
Just where abouts in our climate history did that “nudge” occur. Was it at 315 ppm in 1957, or was it earlier than that; was it when we crossed the 280 ppm Sacred value that should never be exceeded.
Since the effect of CO2 is logarithmic (so the established science concensus says), their would have been a 3.0 deg C Temperature “nudge” given by CO2 going from 140 ppm to 280 ppm; did that wake up the H2O monster ?
Those of you in that camp, seem to freely admit, that it is the H2O in vapor and cloud form (oceans too) that really does the climate damage; CO2 is just the wimp that gives the water a nudge; but it is the water that is the 800 pound gorilla that sends Temperatures sky rocketing, and storms hitting new records.
That is such a silly idea; you should be ashamed to offer that as an explanation. If water is such a powerful feedback that amplifies the miniscule CO2 effect, it would seem that just leaving the garden hose on for a few minutes would be enough of a nudge to cause the runaway effect that CO2 is charged with creating.
Water by itself, without any nudging, is perfectly capable of running the whole show itself; it doesn’t need any nudging from CO2 of Ozone, or Methane; or even from accidently released dental laughing gas.
For a start; the system isn’t even vaguely in equilibrium anyway. We can have a total global Temperature spread on any summer day (north) of as much as 150 deg C; and everything in that range may be present somewhere on earth.
Surely in at least one of those places, the local H2O should feel like taking charge, and amplifying the effect ow whatever the local CO2 happens to be.
This morning, the Temperature was right around zero (deg C), and my breath deposited a thin ice slick on my windshield. There was not a sign of any dew, nor a cloud in the sky, a complete hemisphere of cloudless emptiness, and clear air. Temperatures yesterday were low 70s (degF), around 22 degC yet this morning it was zero. And this was in industrial silicon Valley; nobody has CO2, if we don’t.
CO2 didn’t do a damned thing about nudging the Temeprature off top dead center.
Water in any form, in any place in the atmosphere, anywhere on earth, ALWAYS reduces the total amount of solar energy that can and does reach the earth surface (and oceans); every single additional H2O molecule in the air, further reduces that collected solar energy; no matter what. Evn CO2, because of its near IR absorption bands, also acts to reduce the amount of solar energy that the earth collects. Ozone in the upper atmosphere also reduces ground level solar energy; anywhere on earth that it occurs.
That is incontrovertible, and also irrefutable, experimental fact. It is not the output of some Teraputer video game run.
CO2 can’t do diddley about keeping the earth warm in the absence of H2O at reasonable levels in the atmosphere; and anyone who has ever spent a night in an alpine desert knows that too well. And I doubt that there is any place in the atmosphere where weather/climate occurs, where CO2 is ever in excess of the local H2O abundance.
So much for givng things a nudge.
George E. Smith
I never implied the CO2 directly transports energy.
That energy source is the sun. But its the daily 24 hour cycle of this in any net gain that can cause global warming progressively.
There is cause and there is a flow on effect. Energy must in the final analysis be held in.
We know the properties of minor CO2 hold in and retain the radiative effect of the sun. without the effect of CO2 in the atmosphere the earth would freeze at night.
With additional free CO2 being added we are adding the net held in energy over a day/night cycle.
As we increase ppm levels we also increase the net gains of retained energy.
You are muddling my post.
Whilst you are saying things it is mixed and convoluted with the laws of physics of the CO2 radiative that is correct and then sprinkled with misuse and wrong assertion.
Water Vapor – the greenhouse effect – yes we know it is one for sure. It is a greenhouse effect. But without some forcing from a known cause of energy it DOES NOT get created from no energy inputs. By itself it does not become a driver of warmth or cool. There must be inputs of energy into the global climate system.
The million dollar – does water amplify global warming as a negative or positive feedback. Well from what I’ve seen of QLDs climate over the past three months it DOES! Yes that is a very short variability but understand our Summer experienced such heavy cloud for three months it was dim in summer noon. Now temperatures in some are at 45 degrees Celsius so all I can assume this massive cloud cover did cool the landmass at all. Let alone the torrential rains.
So increasing ppm of CO2 increases the likely accounting quantum of energy held in as a positive forcing not a negative one.
One fatality reported after Yasi.
“”He was sheltering inside a residence when he was overcome with fumes from a generator,”
http://www.smh.com.au/environment/weather/cyclone-yasi-claims-first-victim-20110201-1acgp.html
“Ross Brisbane says:
February 2, 2011 at 3:45 pm
Try 110 degrees in Sydney.”
This is the only point in your post I want to talk to. 110f/43c in Sydney, and surrounding areas, isn’t unusual. And these figures you are quoting are in the deep west of Sydney, away from the coast, Penrith for example which regularly gets to 110f/43c in summer. What does appear unusual this summer is that hot temperatures of 105f+/40c+ have occured in February, with high levels of humidity, and with just 3 weeks of summer remaining, will drop to average or below average after this Sunday. Up to this week it’s been average to below average in Sydney. In fact the January/February record highs for Sydney were set in 1939 and 1926 respectively. Not one record high has been broken in NSW this summer. I live near on of Sydneys airports, and its temperature is regularly used in weather reports. Some significant bias happens when airport based temperature readings are used in weather reports.
As for Qld and Brisbane in particular, there was not one single day in Brisbane above 30c for the entire spring.
I do believe your post is misleading.
Patrick Davis,
There are trends emerging for QLD’s temperatures that indicate the most powerful La Nina on record and the greatest cover cloud QLD has ever experienced over December/January IS NOT dampening temperatures. The ENSO factored in appears to have only compensated by much less a half a degree Celsius on the average to averaging since 1950.
Dr Roy Spencer is wrong to assert cloud formations are negative feedbacks as they are far too temporal on the temperatures and are caused by net gained energy inputs anyway. The radiative factoring of global warming seems to reaching a new level of what was global minimums. you should also realise despite the most powerful La Nina ever experienced we are certainly not sufficient impacts to prove variability. These within careful reading of BOM summaries of temperatures is subtle signal of global warming over arching the temperatures. I see it and but you cannot – well aren’t that interesting. The same goes fro our counterparts freezing in the North – you should not read much into snow and ice falls. All it positively points is that somehow a warming mechanism is driving extra extraordinary water vapor into the upper atmosphere. This extra energy does not come from somewhere out of the mother nature’s variability make believe energy creation. The snow storms emanate from higher energy INPUTS in the first place! As goes QLD the freezing are not a sign of global cooling – they are effects of extreme inputs “seeking” climate equilibration.
Another blow to clouds being negative feedback is that the energy that would have lost to space is stored in the water turning to water vapor of condensation. When rain falls the air temperatures cool but the ground actually heat up in cycle.
So the greenhouse effect of CO2 is actually amplified by clouds and water vapor rising into atmosphere. The feedbacks are often ignored in calculating the nudge factor of CO2 is which a weak nudge to a warmer not cooler planet.
Here is in part a QLD BOM summary:
Maximum temperature
The state-averaged mean maximum temperature for January was 34.46 °C, compared with the long-term average of 34.80 °C.
Daily maximum temperatures were 6 to 8 °C above the January average over the southern Channel Country, Maranoa and Warrego and far southwestern Darling Downs on the 25th in the northwesterly airflow ahead of a slow-moving trough over South Australia. On the 26th, daily maximum temperatures reached 8 to 10 °C above the January average over large parts of the Maranoa and Warrego and southern Channel Country and over the far southwestern Darling Downs and Granite Belt as the trough approached the southwest Queensland border. A small area near the Queensland border was even more than 10 oC above average. On the 27th, daily maximum temperatures were 8 to 10 °C above the January average over large parts of the Channel Country and Maranoa and Warrego. Daily maximum temperatures were 8 to 10 °C above the January average over small parts of the far southwest Channel Country and Maranoa and Warrego on the 28th.
The highest daily maximum temperatures recorded in Queensland during January occurred on the 27th and 28th, with 47.4 °C at Birdsville Airport and 47.0 °C at Bedourie Police Station on the 27th, followed by 46.1 °C at Birdsville Airport on the 28th. Daily maximum temperatures were 4 to 6 °C above average over large parts of the west of the state on the 29th.
The warmest days on average occurred at Bedourie Police Station with 40.7 °C, followed by Birdsville Airport with 40.6 °C, followed by Urandangi with 39.4 °C.
The coolest days on average were at Applethorpe with 25.5 °C, followed by Maleny Tamarind St with 25.6 °C, followed by Toowoomba Airport with 26.0 °C.
The lowest daily maximum temperatures recorded in Queensland during January were on the 6th, with 18.2 °C at Applethorpe, followed by 19.0 °C at Stanthorpe Leslie Parade, followed by 19.4 °C at Toowoomba Airport.
Some sites had their lowest January mean daily maximum temperature for at least 20 years. See a map of mean maximum temperatures. See a map of maximum temperature anomalies.
Minimum temperature
The state-averaged mean minimum temperature for January was equal to the long-term average of 22.67 °C. Daily minimum temperatures were 6 to 8 °C above the January average over the far southwestern Channel Country on the 25th in the northwesterly airflow ahead of a trough over South Australia, spreading to a large part of the southern Channel Country and a small part of the far southern Darling Downs and Granite Belt on the 26th as the trough approached the southwest Queensland border. This area extended northeast on the 27th and daily minimum temperatures were up to more than 8 oC above average over far southern border regions. On the 28th daily minimum temperatures were 6 to 8 oC above average over the far western Channel Country and parts of far southern interior and more than 8 oC above average over the far southwest. They were more than 6 oC above average over the far southwest on the 29th and 30th.
The coldest night was at Applethorpe with 12.1 °C on the 24th, followed by Stanthorpe Leslie Parade with 12.9 °C on the 24th, followed by Applethorpe with 13.0 °C on the 15th.
The coolest nights on average were at Applethorpe with 15.7 °C, followed by Stanthorpe Leslie Parade with 16.2 °C, followed by Warwick with 17.3 °C.
The warmest nights on average were at Birdsville Airport with 26.9 °C, followed by Sweers Island with 26.4 °C, followed by Mornington Island with 26.0 °C.
The highest daily minimum temperatures recorded in January were 31.8 °C at Thargomindah Airport and 31.5 °C at Birdsville Airport on the 28th, followed by 30.8 °C at Birdsville Airport on the 8th. Some sites had their lowest January mean daily minimum temperature for at least 20 years. See a map of mean minimum temperatures. See a map of minimum temperature anomalies.
Wind
The strongest wind gust was at Hamilton Island Airport with 128 km/h on the 30th, associated with TC Anthony, followed by Mackay M.O with 111 km/h on the 7th, followed by Double Island Point Lighthouse with 102 km/h on the 9th, followed by University of Queensland Gatton with 102 km/h on the 12th.
______________
You should carefully read the BOM summary. You will find I have not been misleading. You cannot just use REGIONAL minimums as these are not sustained – clouds are temporal and only provide very short relief from the relentless very slow climb in global temperatures.
The snow USA has been experiencing I predict is a temporal shift caused by built up flux energy in the form of massive water vapor free in the upper atmosphere causing a massive clash to condensation in cooler fronts and falling as massive record breaking snows. It points to a climate on the move and not static because extra energy is being quantum-ed into the global system.
America I predict will experience the worst heat waves this coming Summer in their history. The Arctic ice will be a rapid melt back and the tipping point for this region may strike within 5 to 10 years.
I know I write simply but behind all this is a reading of copious material, data and studies on climate at the empirical and historical levels.
Ross (DigitalAdvisor/ConcernedCitizen?), once again you are offering your nonsense interpretations of science. There is no point in trying to help you correct what you say because you just do not want to learn. You were ranting on like this and about those “tipping points” that you are so enthusiastic about on Senator Fielding’s “climate change” threads for much of 2009 and 2010. May I suggest that you concentrate on your English grammar and theology studies and leave the science to scientists.
http://agmates.ning.com/forum/topics/a-handy-hyper-heatwave-and-yet?xg_source=activity&id=3535428%3ATopic%3A124180&page=73#comments :
“I am also trained and highly skilled on matters of theology from the more orthodox evangelical faith to which you belong.”
Best regards, Pete Ridley