I’ve held the normal Sunday Sea Ice news until NSIDC released their monthly report, which they did today. I’m repeating it here verbatim. The main issue with Arctic extent has to do with the persistent Arctic Oscillation induced high over eastern Canada, which has kept that area warm this past month, and kept Hudson Bay from freezing over like it normally does. Otherwise, inside the Arctic circle is mostly filled with ice and the areas not filled per normal for this period are mostly outside the Arctic Circle. Click this image for reference:

And if you’ll have a look at this image from NSIDC, you’ll see Hudson bay has started to freeze up as the AO changes.
There’s also some interesting news on the new Multisensor Analyzed Sea Ice Extent (MASIE) which we’ll examine at a future date.
===========================================================
From NSIDC:
Repeat of a negative Arctic Oscillation leads to warm Arctic, low sea ice extent
Arctic sea ice extent for December 2010 was the lowest in the satellite record for that month. These low ice conditions are linked to a strong negative phase of the Arctic Oscillation, similar to the situation that dominated the winter of 2009-2010.

Figure 1. Arctic sea ice extent for December 2010 was 12.00 million square kilometers (4.63 million square miles). The magenta line shows the 1979 to 2000 median extent for that month. The black cross indicates the geographic North Pole. Sea Ice Index data. About the data.
—Credit: National Snow and Ice Data Center
Overview of conditions
Arctic sea ice extent averaged over December 2010 was 12.00 million square kilometers (4.63 million square miles). This is the lowest December ice extent recorded in satellite observations from 1979 to 2010, 270,000 square kilometers (104,000 square miles) below the previous record low of 12.27 million square kilometers (4.74 million square miles) set in 2006 and 1.35 million square kilometers (521,000 square miles) below the 1979 to 2000 average.
As in November, ice extent in December 2010 was unusually low in both the Atlantic and Pacific sides of the Arctic, but particularly in Hudson Bay, Hudson Strait (between southern Baffin Island and Labrador), and in Davis Strait (between Baffin Island and Greenland). Normally, these areas are completely frozen over by late November. In the middle of December, ice extent stopped increasing for about a week, an unusual but not unique event.

Figure 2. The graph above shows daily Arctic sea ice extent as of January 2, 2011, along with daily ice extents for previous low-ice-extent years in the month of November. Light blue indicates 2010-2011, pink shows 2006-2007 (the record low for the month was in 2006), green shows 2007-2008, and dark gray shows the 1979 to 2000 average. The gray area around the average line shows the two standard deviation range of the data. Sea Ice Index data.
—Credit: National Snow and Ice Data Center
Conditions in context
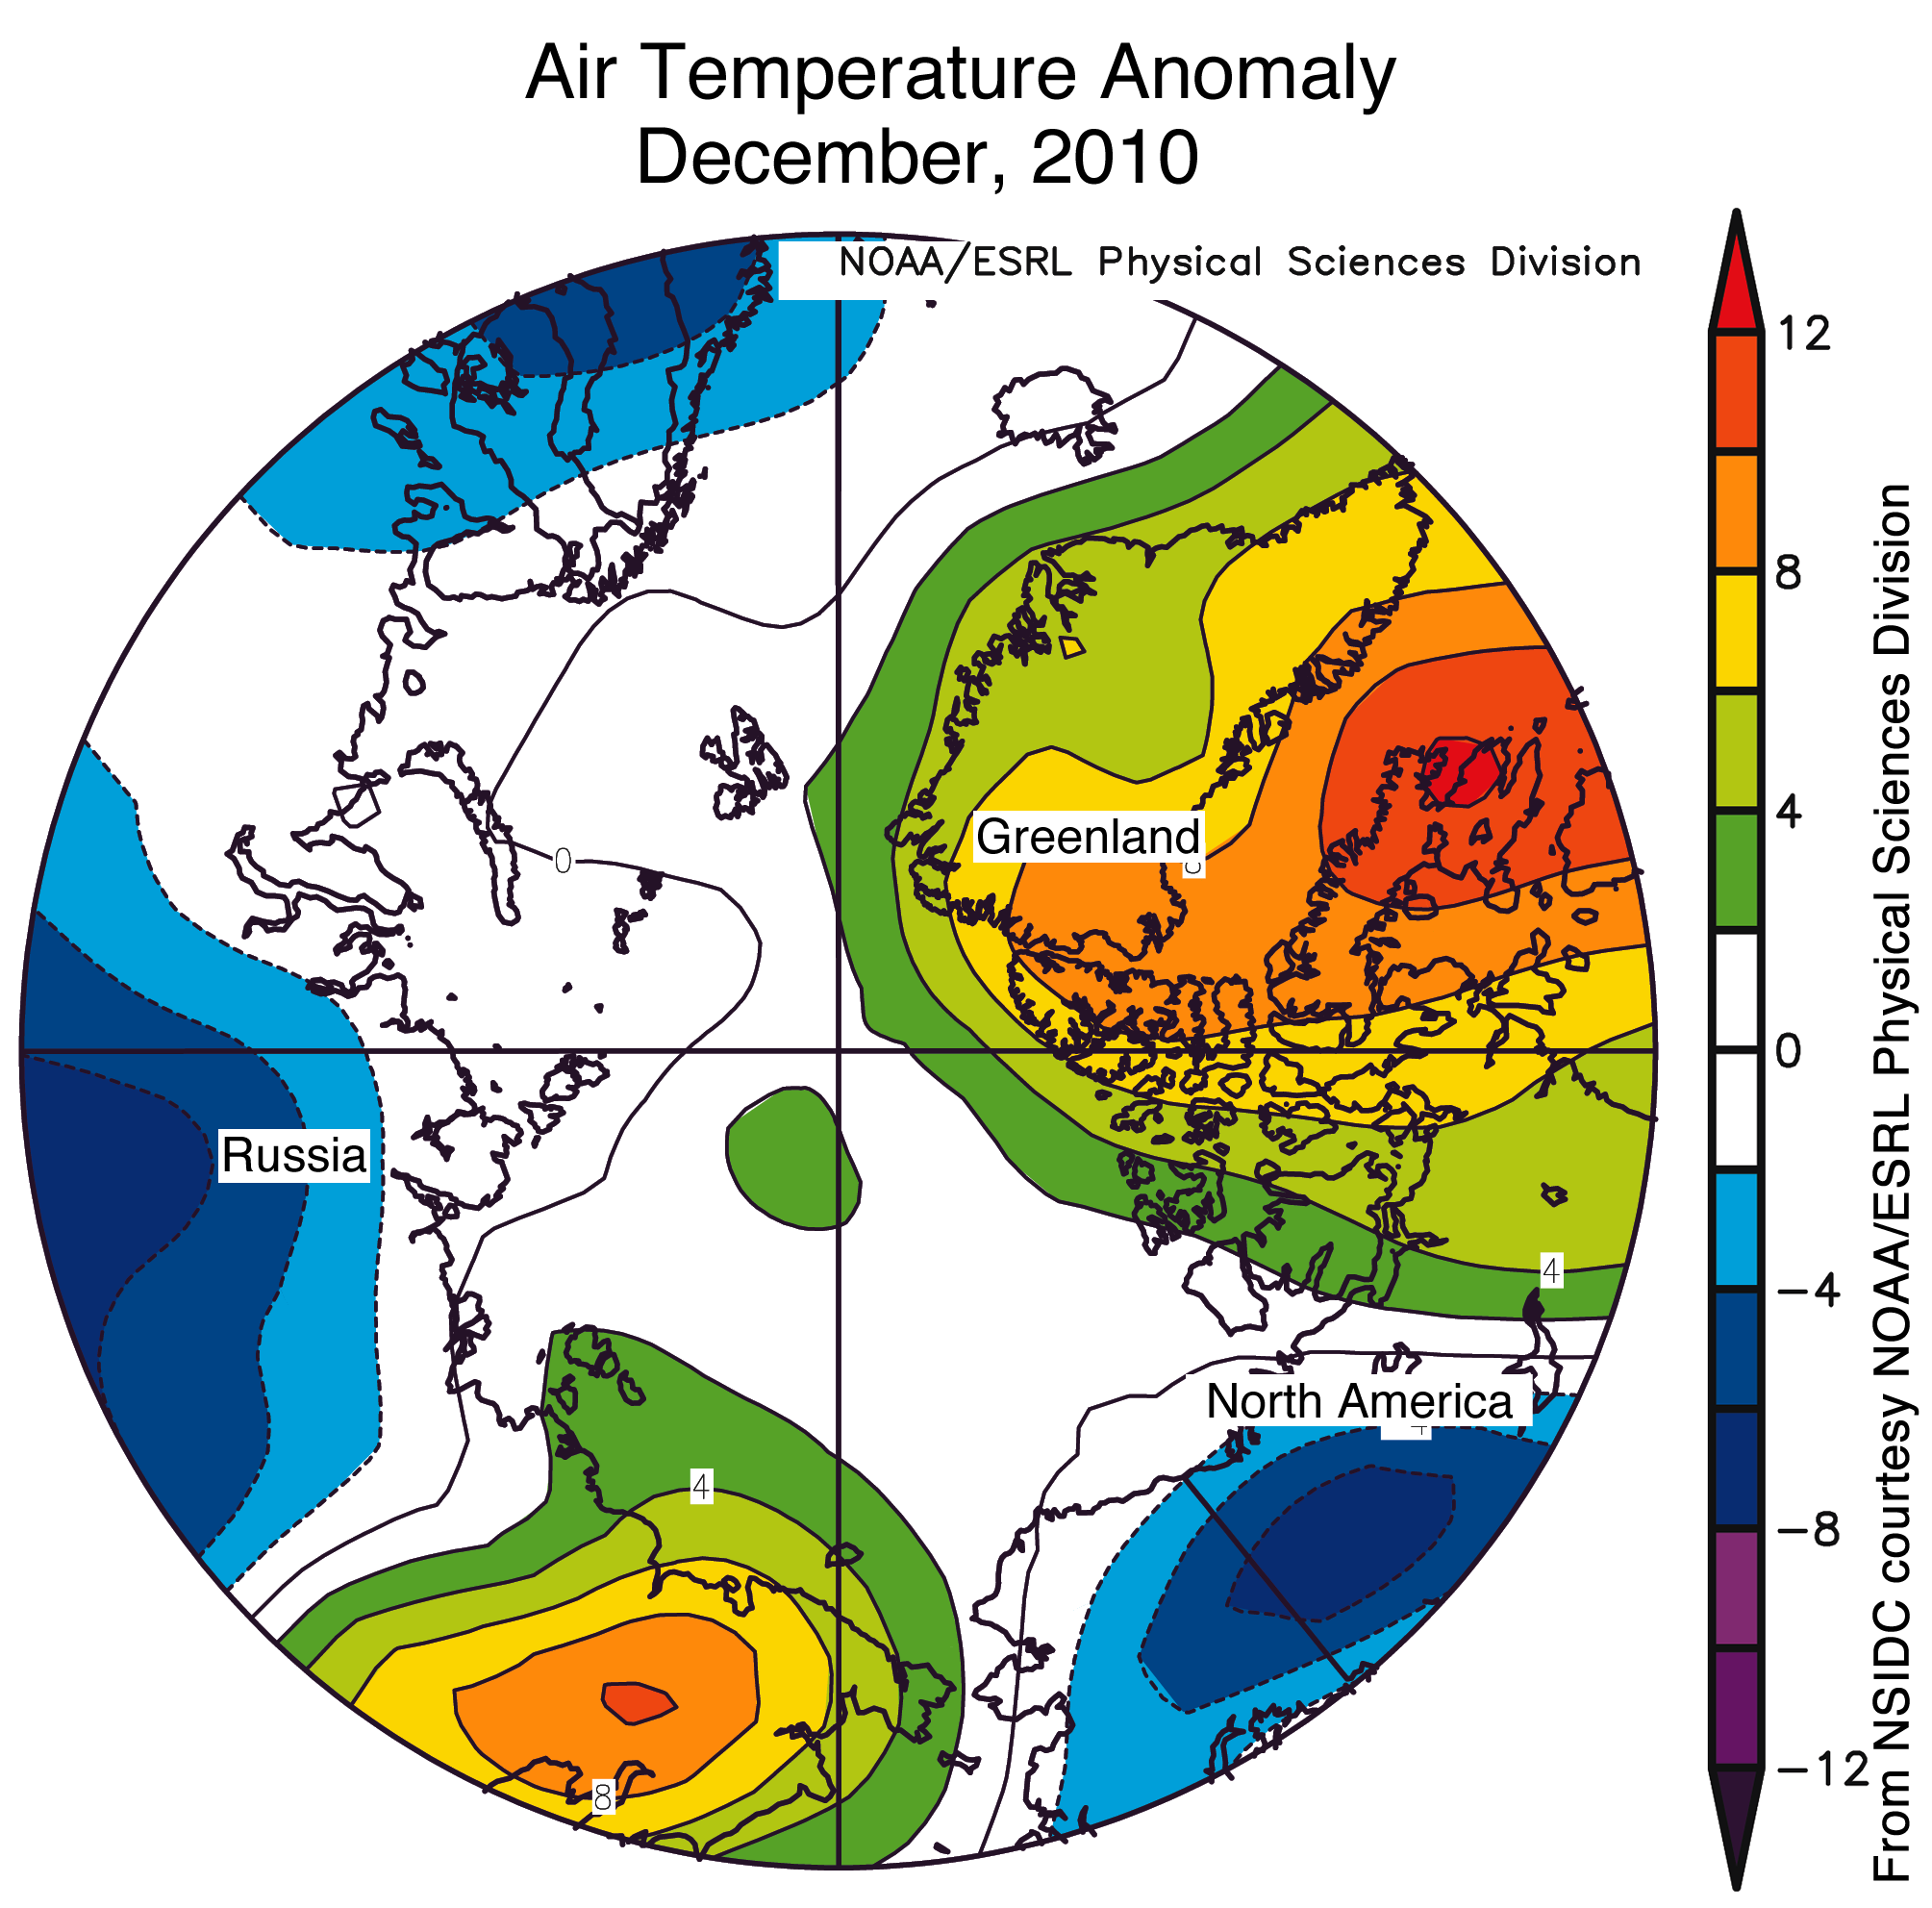
The low ice conditions in December occurred in conjunction with above-average air temperatures in regions where ice would normally expand at this time of year. Air temperatures over eastern Siberia were 6 to 10 degrees Celsius (11 to 18 degrees Fahrenheit) above normal in December. Over the eastern Canadian Arctic Archipelago, Baffin Bay/Davis Strait and Hudson Bay, temperatures were at least 6 degrees Celsius (11 degrees Fahrenheit) higher than average. Southern Baffin Island had the largest anomalies, with temperatures over 10 degrees Celsius (18 degrees Fahrenheit) higher than normal. By sharp contrast, temperatures were lower than average (4 to 7 degrees Celsius, 7 to 13 degrees Fahrenheit) over the Alaska-Yukon border, north-central Eurasia, and Scandinavia.
The warm temperatures in December came from two sources: unfrozen areas of the ocean continued to release heat to the atmosphere, and an unusual circulation pattern brought warm air into the Arctic from the south. Although the air temperatures were still below freezing on average, the additional ocean and atmospheric heat slowed ice growth.
 Figure 3. Monthly December ice extent for 1979 to 2010 shows a decline of 3.5% per decade.
—Credit: National Snow and Ice Data Center
December 2010 compared to past yearsDecember 2010 had the lowest ice extent for the month since the beginning of satellite records. The linear rate of decline for the month is –3.5% per decade.
 Figure 4. Air temperatures were higher than normal over Baffin Island, Hudson Bay, and eastern Siberia for the month of December, which was associated with low sea ice extent in those areas. The temperature pattern resulted from a negative phase of the Arctic Oscillation.
—Credit: NSIDC courtesy NOAA/ESRL PSD
Negative phase of the Arctic Oscillation
As in December 2009, a strongly negative phase of the Arctic Oscillation dominated the middle and high latitudes of the Northern Hemisphere in December 2010, bringing higher-than-normal pressures to the Arctic region, with lower-than-normal pressures in middle latitudes. However, unlike 2009, when higher-than normal pressures centered near the central Arctic , in December 2010 higher pressures centered near Iceland and the eastern tip of the Aleutians in the Pacific, and yielded a different pattern of winds. As a result, different areas experienced warm anomalies in 2010, and a different pattern of ice extent emerged.
Our January 5, 2010 post discussed the connection between very warm temperatures over much of the high Arctic in December 2009 and a strongly negative phase of the Arctic Oscillation.
 Figure 5. This full-year graph puts 2010 sea ice extent in context. The gray line shows the 1979 to 2000 climatology, thick blue-gray indicates the 1979 to 2008 (30-year) climatology, dashed green shows 2007, and 2009 is shown in sky blue. Sea Ice Index data.
—Credit: National Snow and Ice Data Center
2010 year in review
Despite a late date of the maximum in winter sea ice extent, the minimum sea ice extent for September 2010 was third lowest in the 1979 to 2010 satellite record, above only 2007 (the record low) and 2008. The late summer of 2010 saw an open Northwest Passage: this year, the deep water channel (the northern route) from M’Clure Strait to Lancaster Sound was navigable. The Northern Sea Route along the Siberian coast also became briefly navigable.
2010 started out with a highly negative phase of the Arctic Oscillation, an atmospheric pattern that in the past has favored the survival of old ice through the winter, and more ice at the end of this summer. But this tendency seems to be changing. A recent study led by Julienne Strove of NSIDC showed that while wind patterns linked with the strongly negative Arctic Oscillation winter of 2009-2010 transported much old ice into the southern Beaufort and Chukchi Seas, most of this ice later melted. It may be that with a warmer Arctic, old rules regarding links between the atmospheric pressure patterns and sea ice extent no longer hold. So far the winter of 2010-2011 has also had a strongly negative Arctic Oscillation, but it is not yet clear how this pattern will affect summer sea ice.
 Figure 6. The graph of Antarctic sea ice extent as of January 3, 2011. Light blue indicates 2010-2011, dark blue shows 2009-2010, and dark gray shows the 1979 to 2000 average. The gray area around the average line shows the two standard deviation range of the data
—Credit: National Snow and Ice Data Center
A note on Antarctica
While sea ice is growing in the Arctic, it is early summer in the Antarctic and sea ice is melting. For the past four months, Antarctic sea ice extent has remained well above average. The high ice extent around Antarctica appears to relate to a persistently positive phase of the Southern Annular Mode—an Antarctic counterpart to the Arctic Oscillation—and to the mild La Niña conditions in the Pacific. In December 2010, the monthly mean Southern Annular Mode index was lower, and Antarctic sea ice extent had dropped back to within about standard deviation of the mean.
For more information about Antarctic sea ice, see the Frequently Asked Questions section. Antarctic sea ice data is available on the Sea Ice Index.
New sea ice data
NSIDC has recently released a new sea ice extent product, called the Multisensor Analyzed Sea Ice Extent (MASIE). The MASIE project is a collaborative effort with the U.S. National Ice Center to provide a daily high-resolution sea ice extent estimate based on the NOAA Interactive Mapping System (IMS) product. This new product is considered more accurate for tracking the current position of the ice edge; for climate studies, the passive microwave product (on which Arctic Sea Ice News & Analysis is based) is preferred for a more consistent, long-term average. For more information, read an article about the product at the NSIDC Monthly Highlights Web site.
Further reading
Stammerjohn, S. E., D. G. Martinson, R. C. Smith, X. Yuan, and D. Rind, 2008. Trends in Antarctic annual sea ice retreat and advance and their relation to El Nino — Southern Oscillation and Southern Annular Mode variability. Journal of Geophysical Research, 113, C03S90, doi: 10.1029/2007JC004269.
Stroeve, J.C., J. Maslanik, M. C. Serreze, I. Rigor, W. Meier, and C. Fowler. 2010. Sea ice response to an extreme negative phase of the Arctic Oscillation during winter 2009/2010. Geophysical Research Letters. In Press.
===============================================================
As always, up to date info is available 24/7/365 on the WUWT Sea Ice Page
I mentioned a couple of years ago that I thought the ocean current velocities appeared to be increasing. It still looks like that is occurring. The waters between Canada and Greenland are warmer and that seems to be releasing a lot of energy to the air there and causing the development of a strong low pressure. If the ocean currents are moving faster, I would expect stronger currents to be found near the Canadian coast instead of along the Eastern shores of Greenland. It would explain why the ice is slow to develop in the Arctic when the temperatures there are quite cold. It was -59C in Siberia today and it has been very cold before today. These cold temperatures are periodically moderated up to the -30’sC as low pressures pass near by because of the open water so far North. It looks to me like these low pressures are forming near both poles on a regular basis and I think it is due to faster moving ocean currents releasing heat energy from the equator.
If true, a blocking pattern should stay in place making Europe cold for the next few years. The increased release of heat and water vapor to the polar regions should continue to cause increased snow at high latitudes and continued cooling of the equatorial oceans. There should be more snow persisting into the Summer months. The combination of cooling poles, reduced solar output, and open water in the Arctic could be the perfect recipe for continental glaciers to begin to form.
RE: wobble
January 5, 2011 at 3:34 pm
Yes, there is monthly data from NSIDC available going back to 1979 (for both Arctic and Antarctic). Here’s the link:
ftp://sidads.colorado.edu/DATASETS/NOAA/G02135/
Arctic ice has a negative 30-year trend in all 12 months, and is most pronounced in July, August, September, and October (least so in the late winter/early spring months).
The map above shows some ice in the Sea of Okhotsk but way below the mean.
The fishing boat probably took a chance and got caught. Not a new ice age but greed and stupidity.
Is there any information of the ice extent changes around the coast of Antarctica during the last few thousands of years in more visual form than Vostok graph?
I have been thinking about this Arctic Oscillation pressure phenomenon and have been considering the possibility that in order to experience a little or a big ice age, cold air from the Arctic must invade latitudes further South. In order to do that, the AO must flip to a negative mode and stay there for quite a while. Else the high pressure vortex of Arctic air stays circulating around the Arctic creating a shield as it were to what would otherwise be a pretty cold Northern Hemisphere.
I say this as an alternative to the argument presented by many AGWers that a negative AO is a signal of a warmer world. I think it is just the opposite. Cold Arctic air must invade in order to create an ice age. Therefore the AO must be negative and persistently so. A warming world would show signs of a persistent neutral to positive AO.
The above is offered to allow me to present the idea that this ice extent could possibly be the lull before the storm. Is it probable? I don’t know. But I do think it is possible that we could be on the edge of a colder world for quite some time. Even though, ice extent seems weak and contrary to a colder world.
What is important about sea ice is the long-term trend. 2010 (and now early 2011) continue to support the long-term downtrend in Arctic ice extent. There will always be some specific “reason” given for one low season to the next, from warmer water pushing in from the Atlantic or Pacific and melting the ice from the bottom, a negative AO, wind pushing the ice out of the Fram strait, etc., but what is important to note is that all of these events involve energy, and specifically the motions of large masses of warmer air and warmer water into the Arctic. As a warmist, I am one who think that the GCM’s are probably have it right, and that by the end of this century at the very latest (and probably much sooner) we’ll have an ice free Arctic in the summer. Finally, to those who think that this long term decline in Arctic ice is simply the motion of wind etc. and does not involve higher than normal amounts of energy remaining in and around the Arctic, consider the simple fact that permafrost is melting as well. We don’t get much wind 12 feet underground where we’re seeing the permafrost melt. All this is exactly the kinds of early signs that GCM’s have for a long time modelled as sign of AGW. But it’s entertaining to see how AGW skeptics try to explain all this through any other means available…
REPLY: 30 years of satellite data, with the last 15 showing a decline is not a “long term trend” in the scheme of our planetary cycles. That’s where alarmists fail. You should read this article. – Anthony
Just The Facts says:(January 5, 2011 at 3:26 pm)
Dave in Canmore says:(January 5, 2011 at 3:46 pm)
Thanks for taking the time to respond and post links.
R. Gates says: (January 5, 2011 at 7:38 pm)
“As a warmist, I am one who think that the GCM’s are probably have it right, and that by the end of this century at the very latest (and probably much sooner) we’ll have an ice free Arctic in the summer”
If, as the links posted by those mentioned above seem to show, that this year’s lower anomaly is mainly due to Hudson Bay, why do you still claim that the Arctic sea ice, the sea ice actually within the Arctic Circle, is in such free fall? Isn’t the inclusion of Hudson Bay in these calculations simply a man made boundary decision? Does that really reflect the conditions around the north pole?
And the total mass of ice is ___________, and last years mass is ____________.
Thicker ice that is not as wide spread may linger longer than thinner ice during warmer periods , right?
“The warm temperatures in December came from two sources: unfrozen areas of the ocean continued to release heat to the atmosphere, and an unusual circulation pattern brought warm air into the Arctic from the south.”
Is not the area now short of ice the same area that a few weeks ago was under an intense High Pressure? Is High Pressure not a compressive movement of descending and adiabatically warming air? Would we not expect air to be moving away from this region, not into it?
Maybe my time-line if wrong. When and where from did the “warm air” originate that is mentioned in the above quote?
. . .<b<is wrong
latitude,
…isn’t it about time someone sat down and established . . .
Fine, but there is no data!
When folks from Main St. to Wall St. do such, they go to jail. You must contact your government agencies for this to be done.
The Petoukhov paper (realclimate) supposes that warmed ocean releases heat in the Barents Sea and that would prevent freezing and create cold winters in Europe. Yet if he looked at the NSIDC map for december 2010, he’d see that the Barents sea sea ice is right within the median 1979-2000. Therefore quoting Petoukhov to explain harsh winter in Europe as Rhamstorf and the Team do is ill founded.
True the arctic sea ice extent in November/December was very low; But where? Eastern Hudson Bay, Labrador and south Greenland. Well at the front of the high pressure anticyclones that brought cold and froze lemontrees in Florida the strong temperature gradient will force the advection of a huge amount of warm and moist air northward, that very same air that dumped snowmaggedon on the NE USA recently. Therefore the lack of sea ice in the above mention areas is a direct consequence, not the cause of the dynamics of circulation. There is nothing unusual about it, contrary to the alarmist BS from Mark Serreze at NSIDC.
Therefore using arctic sea ice as a clear indicator of GHG global warming is BS. In fact all arctic sea ice parameters can be explained through dynamical circulation conditions that are in transition toward a cooling since high pressure systems are stronger and occuring more often. Ignoring meteorology as many warmers and others who are taking their cue from biased scientist/activists such as Overland and Team, make them an easy target to debunk.
Reply to ” John McManus says: January 5, 2011 at 5:28 pm
The map above shows some ice in the Sea of Okhotsk but way below the mean.
The fishing boat probably took a chance and got caught. Not a new ice age but greed and stupidity.” unquote
which was a comment to my earlier post “xyzlatin says: January 5, 2011 at 3:09 pm ”
John I did not mention “the fishing boat”. The first paragraph clearly says 10 ships.
“Since 30 December, Russian ships have been trapped by ice in the Sea of Okhotsk, part of the Gulf of Sakhalin, and rescue attempts have so far been frustrated. The drama, redolent of the 1983 ice crisis, apparently involves ten ships, including a research vessel and what are described as three “fishing boats”. With crews totalling 400, it is more likely that these are factory or processing ships.”
Now why would you make your statement denigrating Russian fishermen? If you want to find out more, go to the link I provided to Richard North’s EU Referendum blog, which has photos.
There is clearly a lot more ice in those areas than is being shown in official maps.
Pamela Gray says:
January 5, 2011 at 7:22 pm
Else the high pressure vortex of Arctic air stays circulating around the Arctic creating a shield as it were to what would otherwise be a pretty cold Northern Hemisphere.
============================
As always, well said, Pamela. Except no such thing as a “high pressure vortex.”
Maybe “high-pressure anti-vortex”. Semantics really and I get what you are saying but still.
Cyclone = Low Pressure = Vortex
Anticyclone = High Pressure = Anti-vortex
Regards,
Chris
Norfolk, VA, USA
R. Gates says:
But it’s entertaining to see how AGW skeptics try to explain all this through any other means available…
=========================
Talk about “entertaining”!!
It has been splendidly entertaining to watch you continue to talk out of your arse over these many months.
At least, through the spin, lies, and half-truths….you finally identify yourself as a “warmist.”
Congratulations. [Though not really].
We pegged that one a long LONG time ago.
Chris
Norfolk, VA, USA
The sea ice where those boats got stuck is at least 50% of its normal thickness.You can see thickness here:
http://www.weatheroffice.gc.ca/data/analysis/350_100.gif
The icebreaker Admiral Makarov can be followed here:
http://www.sailwx.info/shiptrack/shiplocations.phtml?lat=54.717902674587&lon=141.20917447982&radius=498
I don’t see continental glaciers forming under a persistent Arctic air mass which is generally very dry air. Instead, I see glaciers forming with the alternating Positive and Negative AO conditions that are occurring now, and that provide an abundance of moisture over large areas of North America, Europe and Asia. Glaciers need more snow accumulating than melting. I think we might be surprised when it is only a couple of degrees cooler than it is now, and the oceans keep transporting the heat and moisture to higher latitudes from the equatorial regions. The rate of heat transport in the oceans is responsible for these Arctic Oscillations in my opinion.
What about the increased UV solar radiation? Is this continuing at the same time that the sun spot cycle is waning? What ramifications will this have?
Surely, Arctic solid ice thickness is more relevant than the extent of 15% of free-floating, surface ice? And why include sea ice that is not within the Artic Circle?
So the arctic ice continues it’s decline.
Now the excuse is that a negative AO is causing it. But wasn’t the old excuse that a positive AO had caused the melt?
So I guess we just have a situation where the arctic ice is in some kind of death spiral. That’s all we know.
Pamela Gray said:
“Therefore the AO must be negative and persistently so. A warming world would show signs of a persistent neutral to positive AO.”
Exactly and that is consistent with all previous AGW contentions whereby the warming from more CO2 was pushing the jets poleward (more positive AO).
Now they are spinning in the opposite direction.
So the Artic unusually high air temperatures is due to heat released into the atmosphere when there is less ice, but also when there is … more ice. Climate science can explain anything.
NSIDC , January 5, 2011:
unfrozen areas of the ocean continued to release heat to the atmosphere
NSIDC November 10, 2008 :
The process of ice formation also releases heat to the atmosphere. Part of the anomalous temperature pattern seen in Figure 3 is an expression of this process, which is generally called the latent heat of fusion.
Onino said:
“Now the excuse is that a negative AO is causing it. But wasn’t the old excuse that a positive AO had caused the melt?”
It was warmists who said the positive AO was causing the melt and that the positive AO had been caused by human emissions.
Sceptics mostly took the view that it was the ingress of warm water to the Arctic Circle after 30 years of strongly positive El Nino events, low global cloudiness and low global albedo.
Now all that is in reverse yet CO2 in the air has kept rising. The Arctic ice will recover soon enough.
“…kept Hudson Bay from freezing over like it normally does.”
For the first time in known history, probably even written history.
xyzlatin:
MSN says 5 caught, 2 released the others out today.
Fishermen from all countries follow fish. These two boats obviously sailed from open water into ice. The lack of ice may have led them to believe they could scoop up a catch and then get out quick. If that was the case, they were wrong.
This topic and the attached maps brings up a Canadian topic. Our neo-con prime minister thinks that the navigation of open arctic waters will benefit Canada. He has been prancing about bragging about militarization of Nunavit, super icebreakers and other compensatory bluster. The maps mentioned show the passage will open along Russia’s north coast long before it does on Canada`s. Just more silly libertarian magical thinking.
Why is it currently warm in Hudsons Bay/Greenland?
Its a question that has exercised my mind and in this thread I have had the opportunity to re-examine the issue and hopefully to learn. As I see it now there are four factors contributing
1. Warm air descending from the straotosphere. As soon as the AO goes negative we see a geopotential height anomaly appear at latitudes higher than 60°north representing ozone rich air that absorbs long wave radiation from the Earth. There is no UV to be had in the polar night. The only way this air can warm is by absorbing OLR. So the source air in the descending polar circulation is warmer. It represents air slipping down through the ozone profile with more above and less below.
2 The warmed source air is further warmed as it descends via compression.
3 As Tom Rude points out:Well at the front of the high pressure anticyclones that brought cold and froze lemontrees in Florida the strong temperature gradient will force the advection of a huge amount of warm and moist air northward, that very same air that dumped snowmaggedon on the NE USA recently.
4. And all forms of precipitation release latent heat.
But all this is temporary because continued low AO will suck the guts out of the westerlies and promote the polar easterlies as it did between 1940 and 1978 and the Arctic will freeze over again. So, what you are getting at the moment is a taste of an old fashioned ice and snow promoting winter. The warm moist air will still come up from the tropics but it will be fighting cold Arctic Air all the way. Its a winter circulation pattern in the northern hemisphere rather than an all year circulation pattern as it is in the southern hemisphere.
The interesting contradiction about low AO is that Arctic pressure is higher while the centre of the vortex of descending air represents a low pressure zone. As the circulation intensifies the whole thing descends to the surface (its usual habitat in the Arctic is in the stratosphere) and starts to do what you see happening in the Antarctic all year round.
And which hemisphere is the icy one? And soon there will be two. But only in winter.
I hope that makes sense.