By Steve Goddard
Summer has come to a premature and frosty end at Santa’s workshop.
")
http://psc.apl.washington.edu/northpole/webphotos/noaa2.jpg
It has been the coldest summer on record north of 80N, and temperatures have dropped below freezing ahead of the average date.
")
The entire ice covered region is now below freezing.
")
http://www.esrl.noaa.gov/psd/map/images/fnl/sfctmp_01.fnl.gif
It also appears that the summer melt season will be the shortest on record. The maximum was reached very late in March, and it appears likely that we are headed for an early minimum.
")
Mark Serreze at NSIDC has stated :
As the climate warms, the summer melt season lengthens …”
He was also reported as saying :
Mark Serreze of the center forecast the ice decline this year (2010) would even break 2007’s record.
Another interesting fact is that we are almost certain to see a large increase in the amount of multi-year ice (MYI) next year. The reason being that almost all of the 1-2 year old ice (turquoise) in the NSIDC map below will become classified as MYI next spring.
")
We have seen a remarkably rapid recovery from the 2008 low volume.
PIOMAS continues to report record low volumes of ice, despite all evidence to the contrary. The image below shows in red how far off the mark their August 15 forecast was. Their modeling error will get much worse over the next two weeks – because they model much of the thick multi-year ice in the Beaufort Sea and Arctic Basin as only a few tens of centimetres thick.

With the cold temperatures, ice area loss has almost stopped.

http://arctic-roos.org/observations/satellite-data/sea-ice/observation_images/ssmi1_ice_area.png
However, ice extent continues to drop – because the Arctic Oscillation has turned negative and winds are compacting the ice towards the pole. This bodes well for continued growth of ice in 2011.
")
http://www.ijis.iarc.uaf.edu/seaice/extent/AMSRE_Sea_Ice_Extent.png
PIPS shows average ice thickness increasing, due to the compression of the ice.
")
There has not been a lot of ice loss during August. The modified NSIDC image below shows in red, areas that have lost ice since August 1. Note that the Greenland Sea appears to have lost ice. This is due to the fact that there has been very little transport out of the Arctic Basin through the Fram Strait, which again bodes well for ice gain in 2011.

The modified NSIDC image below shows ice gain since 2007.

NSIDC maps continue to show more gain (16%) than their graphs (10%.) I have not been able to get a satisfactory explanation from them about the cause of that discrepancy. DMI shows a 25% gain in 30% concentration ice over 2007.
My forecast (dashed line below) minimum of 5.5 million (JAXA) continues to look conservative. It all comes down to what the winds do over the next few weeks. If the winds keep compressing the ice, the minimum may go a little below 5.5. If the winds quiesce, the minimum may come in a little above 5.5 – which is looking like a pretty good number right now. Some people at NSIDC started out with a 5.5 forecast this year, but seem to have backed away from it since.

Academic theories about the Northwest Passage becoming a commercial shipping opportunity appear pretty clueless.
“The plans that you make can change completely,” he says. This uncertainty, delay, liability, increased insurance and other costs of using the Northwest Passage are likely to deter commercial shipping here. A ship with a reinforced hull could possibly make it intact through the passage. But if it got stuck, it would cost thousands of dollars for an icebreaker like the Amundsen to come to the rescue. So even if the Northwest Passage is less ice-choked than before, the route may not become a shipping short-cut in the near future, as some have predicted.
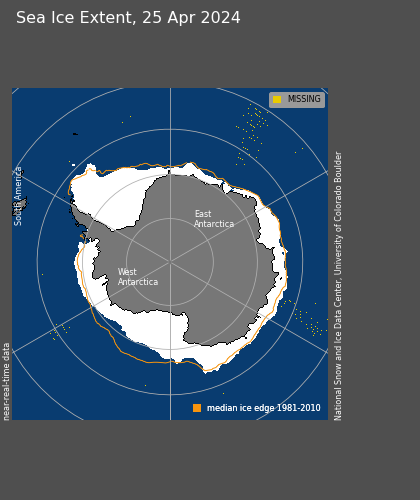
The South Pole will almost certainly set a record for most sea ice this season. It is almost there, and there are still several months of growth remaining.
")
http://www.iup.uni-bremen.de:8084/amsr/ice_ext_s.png

http://nsidc.org/data/seaice_index/images/daily_images/S_daily_extent.png
As seen below, the symmetry between the North and South Pole is impressive through the satellite record. They always seem to move opposite each other and produce an approximately constant amount of sea ice. It would be nice if the experts focused on solving this relationship rather than making up forced explanations like the “Ozone Hole” – which has just started forming for the year and will be gone before Christmas.

UIUC North/south anomalies overlaid on top of each other.
http://arctic.atmos.uiuc.edu/cryosphere/IMAGES/seaice.anomaly.arctic.png
http://arctic.atmos.uiuc.edu/cryosphere/IMAGES/seaice.anomaly.antarctic.png
(Note to posters and ice experts. Before you embarrass yourself making comments about how seasons are out phase at opposite poles, remember that this is normalised data and the period is in excess of 30 years.)
Conclusions:
The “long term trend” (30 years) in Arctic ice continues to be downwards, and would be even if the ice minimum was a record high this summer. But the three year trend shows strong growth of extent, thickness and age. Meanwhile, Antarctic ice is blowing away the record books. Yet the press continues to spread massive disinformation about the state of ice at both poles. Who could possibly be responsible for that?
Sponsored IT training links:
Get COG-112 materials along with 352-001 dumps to practice and pass 000-977 exam in timely and cost saving manners.
Julienne
I looked at the North Pole web cams (mainly PAWS) almost every day this summer and they were nearly continuously overcast with low clouds. Which probably explains the low temperatures.
WOW look at the New NSIDC Sea Ice News (Aug 17) – – way at the end !
A MELT ONSET anomaly MAP !
http://nsidc.org/arcticseaicenews/
Found a different Sea Ice Concentration site
http://www.osdpd.noaa.gov/m1/ocean/seaiceprd.html
BUT this is from Polar sats so we see LOW concentration “holes” near the Pole, instead of a big Blackout Circle.
Sorry forgot to mention: the problem with 2010 has been the Early melt END.
—Looked up the DMI site for my Sea Ice Update – – only 2 years are even CLOSE to as cold in mid-year – – and both after 2000. 2010 especially unique after Day 200 (July 19, i think). Does correllate with Wayne Davidson’s claim that lots of Open water leads to Clouds, unless the Dipole Anomaly – – he says unless an EARLY LA NINA — chases the Clouds away. Hmmm.
2005 is out.
Looks like DMI ice extent is nose diving.
DR
similar to what’s happened before
http://img337.imageshack.us/img337/6342/0000000000000000000.png
2 more
http://img153.imageshack.us/img153/4027/quickdrops.png
EFS_Junior says:
August 17, 2010 at 4:09 pm
I disagree with the uncertainty reaching zero at the minimum. This is because you don’t know WHEN the minimum happens in a real-time dataset. It’s not until after the fact that you know the minimum has been reached (sometimes several days/weeks after), thus there should still be uncertainty.
-Scott
It is looking more and more like a 5 million minimum. Difficult to support either a 5.5 or 4.5 minimum at this point. With only 30 days or so of the melt season left, 5.5 would require an average of approx. 10,000 per day; 4.5 would require an average of approx. 43,000 per day. The average for the past few years is approx. 27,000 per day.
David Gould
Statistics don’t drive wind patterns.
Scott says:
August 17, 2010 at 8:30 pm
EFS_Junior says:
August 17, 2010 at 4:09 pm
I have a statistical model, updated each day with the latest JAXA number, so I could give you a new number every day. I’ve posted several times, with each SIEU, since #12 (or #13), my first estimate was 3.9E6 km^2, as each day passes, all future estimates pivot from that new data point (+/- four sigma, I chose +1 sigma BTW), the model automatically converges to the actual minima (you’ll note that the standard deviation decreases chronologically, in all my estimates (and obviously to zero at the minima).
I disagree with the uncertainty reaching zero at the minimum. This is because you don’t know WHEN the minimum happens in a real-time dataset. It’s not until after the fact that you know the minimum has been reached (sometimes several days/weeks after), thus there should still be uncertainty.
-Scott
___________________________________________________________
Yes that would be correct, there is always uncertainty going forward, that increases with time.
78 000 uncorrected for yesterday, it will be interesting how soon the rate drops off, possibly before the weekend, but then what will it be? 40-50’s or 20-30’s??
Andy
stevengoddard,
But the statistics are basically the statistics of wind patterns, as that is what drives extent loss at this time of year. Average wind patterns give us around 800,000 extent loss for the rest of the season.
stevengoddard,
The wind a major factor loosing ices. I have been living in the north all of my life. Every spring I have seen ice melting. The wind actually makes the final step of loosing ices. You can’t cut the wind out of the equations.
Steve is just looking for a narrative to excuse his prediction if it turns out to be wrong.
He talks about wind like it’s some kind of new thing.
Next he’ll blame the sun or summer or magic elves.
I’m starting to doubt that if his prediction is wrong he’ll man up and just admit it.
As the Saharan Dust storms have supressed the Hurricane season
— how much are the RUSSIAN PEAT FIRES cutting the winds ?
Look at the NOAA Global Aerosol Map — they extend all the way from Africa PAST CUBA.
http://www.osdpd.noaa.gov/ml/air/aer_month.html
PS http://www.osdpd.noaa.gov/ml — leads to a LOT of products, including the different Sea Ice under “Oceans”
Jeff P
LOL I have written at least a dozen articles recently highlighting the importance of wind. Many specifically devoted to that topic. Here is a good one for you to start with.
http://wattsupwiththat.com/2010/06/09/2007-sea-ice-post-mortem/
Could the recent departure of heat out of Russia be contributing to the sudden rise in Arctic temps in recent days?
So was the wind hiding before 2007? And now it shows up twice in 3 years to lower the ice extent numbers.
LOL, as if wind wasn’t around before 2007 and isn’t part of the average ice extent.
You live by the JAXA numbers you die by the JAXA numbers.
Just as: if the ice extent remains above 5.5 million K^2 you will brag that ice is recovering.
Then: If JAXA even cracks 5.5 million K^2 your “ice is recovering” theory will need to be reworked. And “I’m right except when there is wind in the arctic” doesn’t cut it.
DR
Absolutely. The negative Arctic Oscillation has caused mixing of air with lower latitudes and southerly winds.
Jeff P
My narrative/forecast hasn’t changed one iota. You just haven’t bothered to read the articles.
Hi stevengoddard,
nice article. Some comments about :
“As seen below, the symmetry between the North and South Pole is impressive through the satellite record. They always seem to move opposite each other and produce an approximately constant amount of sea ice. It would be nice if the experts focused on solving this relationship rather than making up forced explanations like the “Ozone Hole” – which has just started forming for the year and will be gone before Christmas.”
-> so it obviously shows, that sun exposure to Earth is quite stable in given period and thus humidity formation and further ice formation. But the heat exhaust distribution thru Poles fluctuates. So sometimes either of dominates the process, like SP now. This is possible because the heat flow is somewhat quantized, so depending on summer-winter conditions at that moment that the heat/humidity decides to travel, the direction is kind of randomly selected (or not??).
-> now it looks also more clear how this influences us. we have been living extreame summer here subpolar areas, like record number of above 25 C days and also monthly alltime high temperatures. Russian are still suffering forest fires, this is because Gulf stream does not pump humidity thru heat normally, but both have travelled to SP. Normal Atlantic south-west mixing humid wind pattern is missing because of lacking driving force and continental mid-east summer is spreading even to Scandinavia. This is interesting, because this missing flow was already visible during winter 2009/2010 in Northern Atlantic temperature patterns, but I was not able interpret it correctly at all, but knew that some change will take place. I was more expecting just opposite what actually happened. But as Russian stated, they really saw once every 1000 years summer there. So not an easy point to understand.
-> so just for curiosity, please check Joensuu (holds now Finnish record temperature of 37,2 on 62,7 N, can you imagine!!!) Jul-2010 for the jump in GISS:
http://data.giss.nasa.gov/work/gistemp/STATIONS//tmp.614029290001.1.1/station.txt
http://data.giss.nasa.gov/cgi-bin/gistemp/gistemp_station.py?id=614029290001&data_set=1&num_neighbors=1
Jeff P
Whether final ice extent comes in a little above or below 5.5000000 million, the amount of MYI should see significant growth by next spring.
You are aware NSIDC’s official forecast was also 5.5 million? I’m assuming that you are familiar with the concept of precision and error bars.
The last two days’ losses have been fairly high, and for the first time in almost two weeks the “use previous minima to predict this year’s minimum using current extent” method is yielding a result below 5e6 km^2. This number for me represents a bit of an imaginary threshold, as staying above this means we’re well above 2007/08. It is also the halfway point between the predictions of Steve and R. Gates.
Anyway, these losses need to slow soon or any chance of reaching last year’s extents will rapidly disappear.
-Scott
Steve Goddard: “My narrative/forecast hasn’t changed one iota.”
Not quite:
In Sea Ice #8 you narrated: “Conclusion : Based on current ice thickness, we should expect September extent/area to come in near the top of the JAXA rankings (near 2003 and 2006.)”
Your ice thicknesses were miscalculated and so obviously not a good predictor. The Jaxa ice area is already well below both 2003 and 2006 minimum values, while the extent should drop below tomorrow. There are still weeks of the melt season left.
I don’t expect your more recent prediction of 5.5 million square kilometers to look very good by the end of the month, either.
I am prepared to be surprised by your explanations for all this, though.