By Steve Goddard
Summer has come to a premature and frosty end at Santa’s workshop.

http://psc.apl.washington.edu/northpole/webphotos/noaa2.jpg

It has been the coldest summer on record north of 80N, and temperatures have dropped below freezing ahead of the average date.

The entire ice covered region is now below freezing.

http://www.esrl.noaa.gov/psd/map/images/fnl/sfctmp_01.fnl.gif
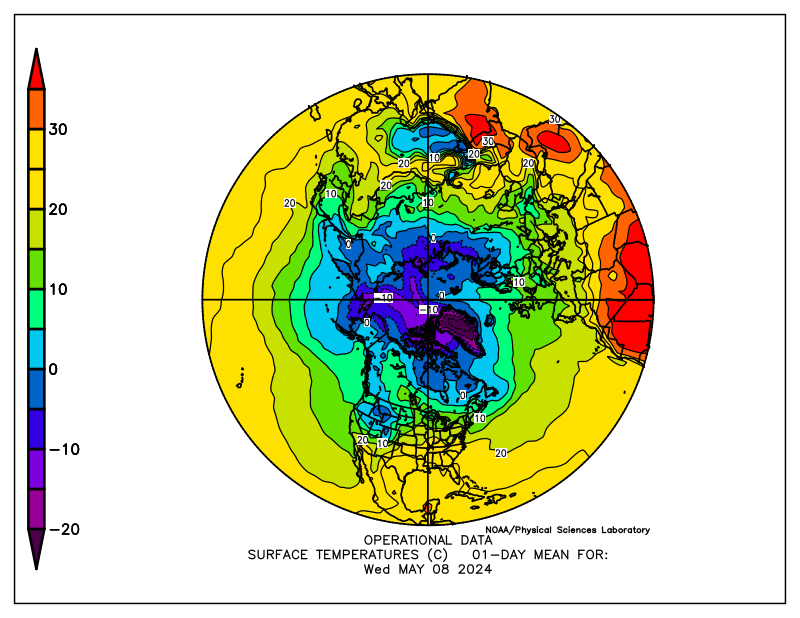
It also appears that the summer melt season will be the shortest on record. The maximum was reached very late in March, and it appears likely that we are headed for an early minimum.

Mark Serreze at NSIDC has stated :
As the climate warms, the summer melt season lengthens …”
He was also reported as saying :
Mark Serreze of the center forecast the ice decline this year (2010) would even break 2007’s record.
Another interesting fact is that we are almost certain to see a large increase in the amount of multi-year ice (MYI) next year. The reason being that almost all of the 1-2 year old ice (turquoise) in the NSIDC map below will become classified as MYI next spring.

We have seen a remarkably rapid recovery from the 2008 low volume.
PIOMAS continues to report record low volumes of ice, despite all evidence to the contrary. The image below shows in red how far off the mark their August 15 forecast was. Their modeling error will get much worse over the next two weeks – because they model much of the thick multi-year ice in the Beaufort Sea and Arctic Basin as only a few tens of centimetres thick.

With the cold temperatures, ice area loss has almost stopped.

http://arctic-roos.org/observations/satellite-data/sea-ice/observation_images/ssmi1_ice_area.png

However, ice extent continues to drop – because the Arctic Oscillation has turned negative and winds are compacting the ice towards the pole. This bodes well for continued growth of ice in 2011.

http://www.ijis.iarc.uaf.edu/seaice/extent/AMSRE_Sea_Ice_Extent.png

PIPS shows average ice thickness increasing, due to the compression of the ice.

There has not been a lot of ice loss during August. The modified NSIDC image below shows in red, areas that have lost ice since August 1. Note that the Greenland Sea appears to have lost ice. This is due to the fact that there has been very little transport out of the Arctic Basin through the Fram Strait, which again bodes well for ice gain in 2011.

The modified NSIDC image below shows ice gain since 2007.

NSIDC maps continue to show more gain (16%) than their graphs (10%.) I have not been able to get a satisfactory explanation from them about the cause of that discrepancy. DMI shows a 25% gain in 30% concentration ice over 2007.
My forecast (dashed line below) minimum of 5.5 million (JAXA) continues to look conservative. It all comes down to what the winds do over the next few weeks. If the winds keep compressing the ice, the minimum may go a little below 5.5. If the winds quiesce, the minimum may come in a little above 5.5 – which is looking like a pretty good number right now. Some people at NSIDC started out with a 5.5 forecast this year, but seem to have backed away from it since.

Academic theories about the Northwest Passage becoming a commercial shipping opportunity appear pretty clueless.
“The plans that you make can change completely,” he says. This uncertainty, delay, liability, increased insurance and other costs of using the Northwest Passage are likely to deter commercial shipping here. A ship with a reinforced hull could possibly make it intact through the passage. But if it got stuck, it would cost thousands of dollars for an icebreaker like the Amundsen to come to the rescue. So even if the Northwest Passage is less ice-choked than before, the route may not become a shipping short-cut in the near future, as some have predicted.
The South Pole will almost certainly set a record for most sea ice this season. It is almost there, and there are still several months of growth remaining.

http://www.iup.uni-bremen.de:8084/amsr/ice_ext_s.png


http://nsidc.org/data/seaice_index/images/daily_images/S_daily_extent.png
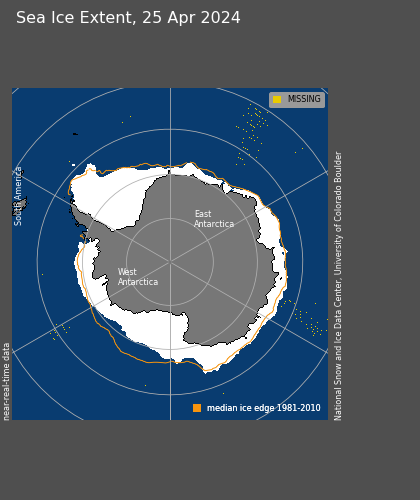
As seen below, the symmetry between the North and South Pole is impressive through the satellite record. They always seem to move opposite each other and produce an approximately constant amount of sea ice. It would be nice if the experts focused on solving this relationship rather than making up forced explanations like the “Ozone Hole” – which has just started forming for the year and will be gone before Christmas.

UIUC North/south anomalies overlaid on top of each other.
http://arctic.atmos.uiuc.edu/cryosphere/IMAGES/seaice.anomaly.arctic.png

http://arctic.atmos.uiuc.edu/cryosphere/IMAGES/seaice.anomaly.antarctic.png

(Note to posters and ice experts. Before you embarrass yourself making comments about how seasons are out phase at opposite poles, remember that this is normalised data and the period is in excess of 30 years.)
Conclusions:
The “long term trend” (30 years) in Arctic ice continues to be downwards, and would be even if the ice minimum was a record high this summer. But the three year trend shows strong growth of extent, thickness and age. Meanwhile, Antarctic ice is blowing away the record books. Yet the press continues to spread massive disinformation about the state of ice at both poles. Who could possibly be responsible for that?
Sponsored IT training links:
Get COG-112 materials along with 352-001 dumps to practice and pass 000-977 exam in timely and cost saving manners.
Everybody get ready for youtube to be flooded with “rotten ice” videos. Maybe they’ll come up with a new term since that one is pretty well debunked. They’ll likely stick to the biggest polynas they can find to avoid getting icebound, claim they are in a position they are not, and start claiming “phantom ice” that doesn’t really exist, its the water that’s fooling the satellites… I can see it now, they’ll claim that “air chilled boundary layer water” is fooling the satellites into thinking open water is ice covered.
Well Tom P, what was your prediction at the beginning or previous to the melt season? I have respect for anyone with the cojones to stick their neck out and make testable predictions. Obviously you’re not one of them.
Armchair quarterbacks, back seat drivers and finish line betters are always the most obnoxious.
mikelorrey says:
August 18, 2010 at 8:48 am
Everybody get ready for youtube to be flooded with “rotten ice” videos. Maybe they’ll come up with a new term since that one is pretty well debunked.
Mike, just because it is traditional to ridicule the concept of “rotten ice” in this solipsistic circle of fellow believers doesn’t mean that it’s true. I have yet to see a so called “skeptic” do a Google” search on the most basic subject or term before he/she spouts the party line.
“ROTTEN ICE” HAS BEEN A BONAFIDE TERM IN DESCRIBING A WIDE VARIETY OF DISINTEGRATING ICE ON GROUND AND SEA FOR AT LEAST 150 YEARS! YOU COULD HAVE FOUND THAT OUT YOURSELF BY DOING A THIRTY SECOND GOOGLE SEARCH!
Below you will find a link to a 1914 book, The heart of the Antarctic, Volume 1
By Sir Ernest Henry Shackleton., where the term is used eight times in that one book!
http://books.google.com/books?id=kXkSAAAAYAAJ&pg=PA320&dq=rotten+ice&hl=en&ei=hQ9sTLCLKIn0tgOBkbTtBw&sa=X&oi=book_result&ct=result&resnum=8&ved=0CE0Q6AEwBzgK#v=onepage&q=rotten%20ice&f=false
AND YET ANOTHER EXAMPLE FROM 1913.
The conquest of Mount McKinley: the story of three expeditions … – Page 144- Belmore Browne, 1913
Fifty feet above us a rotten ice-bridge sagged from a shattered berg to the main wall, and as we looked a cold mist crept over us and everything was blotted from sight.
http://books.google.com/books?id=FtcBAAAAMAAJ&pg=PA144&dq=rotten+ice&hl=en&ei=hQ9sTLCLKIn0tgOBkbTtBw&sa=X&oi=book_result&ct=result&resnum=3&ved=0CC8Q6AEwAjgK
http://www.google.com/search?q=rotten+ice&hl=en&tbo=1&tbs=bks:1&ei=YA9sTPbnDYycsQP3q-CxBw&start=10&sa=N
Tom P says:
August 18, 2010 at 8:21 am
Steve Goddard: “My narrative/forecast hasn’t changed one iota.”
Not quite:
DR says:
August 18, 2010 at 9:50 am
Well Tom P, what was your prediction at the beginning or previous to the melt season? I have respect for anyone with the cojones to stick their neck out and make testable predictions. Obviously you’re not one of them.
DR, Tom P was not criticizing Steven Goddard for being wrong but for not admitting that he had changed his narrative/forecast.
By the way mine was 5 million.
Tom P,
You forgot to quote the entire paragraph. [snip]
Tom P said
August 18, 2010 at 8:21 am
Steve Goddard: “My narrative/forecast hasn’t changed one iota.”
Not quite:
In Sea Ice #8 you narrated: “Conclusion : Based on current ice thickness, we should expect September extent/area to come in near the top of the JAXA rankings (near 2003 and 2006.)”
Your ice thicknesses were miscalculated and so obviously not a good predictor. The Jaxa ice area is already well below both 2003 and 2006 minimum values, while the extent should drop below tomorrow. There are still weeks of the melt season left.
I don’t expect your more recent prediction of 5.5 million square kilometers to look very good by the end of the month, either.
I am prepared to be surprised by your explanations for all this, though.
_________________________________________________
Indeed, Anthony said the Arctic sea ice would put on 500 000 km^2 this year and said Steve and he agreed with that. Steve said nothing to contradict it at the time.
Steve continually plays on the wind being a major factor and ignores temperatures and melt, so being out of step with most folk who see it as a combination of factors.
Andy
Re: mecago on August 18, 2010 at 10:20 am
(to cite one of many examples)
Sad part is, you may really think all that funky emphasizing makes your comments more impressive and somehow more worth reading.
Well, the formatting can make for a good chuckle…
AndyW
You are talking about an estimate Anthony made almost a year ago. Chances are it comes closer than PIOMAS current forecast.
AndyW
Blah, blah, blah…
Ice thickness is an excellent predictor, and my PIPS based calculations are quite accurate. The only forecast I have made is 5.5, and see no reason to change it now.
NSIDC has lowered their forecast by 16%. How do you feel about that?
Steve,
Science is not a big game of chicken, where the one who stands by their claim the longest wins. Science is about using available data to make hypotheses, revising them in the face of contradictory evidence and thereby coming closer to the truth. Not this hairbrained, macho, ‘I was there first’ type of idea. Especially, when the hypothesis in the first place was a fairly rough guess. And even more especially in cases like this where a guess leads to no greater understanding of the problem at hand, and does nothing to further knowledge of a phenomenon.
Only fools and dead men don’t change their minds. Fools won’t and dead men can’t. ~John H. Patterson
Re: Matt on August 18, 2010 at 1:15 pm
Gee, I wonder how many (C)AGW proponents will accept they’ve now been called unscientific and fools…
🙂
You’ve missed something important. You defend your hypothesis, tear into the contradictory evidence, then consider if whatever remains can be worked into your hypothesis or if it needs modification. If nothing remains, no consideration is needed. Works in science, works in troubleshooting as well.
Matt
At the end of the season I will draw a target, plot out everyone’s predictions, and see who was closest to the bullseye.
How far has the insanity extended that we proclaim that ice “has recovered” -inferring its loss was some sort of ‘concern’.
Makes one think that the entire continent covered in miles of the stuff would be “wonderful”.
Black Flag says:
August 18, 2010 at 8:10 pm
How far has the insanity extended that we proclaim that ice “has recovered” -inferring its loss was some sort of ‘concern’.
Makes one think that the entire continent covered in miles of the stuff would be “wonderful”.
================================
Repeated for effect. Excellent!
Matt says:
August 18, 2010 at 1:15 pm
Steve,
Science is not a big game of chicken, where the one who stands by their claim the longest wins.
Only fools and dead men don’t change their minds. Fools won’t and dead men can’t. ~John H. Patterson
=====================
Sounds like the CAGW phenomenon to me.
[I know that is not what you meant, but thanks for being the pot calling the kettle black].
Chris
Norfolk, VA, USA
kadaka (KD Knoebel) says:
August 18, 2010 at 12:01 pm
Re: mecago on August 18, 2010 at 10:20 am
(to cite one of many examples)
Sad part is, you may really think all that funky emphasizing makes your comments more impressive and somehow more worth reading.
Wrong Kadaka. Sometimes I emphasize entire blocks of print, like I’m doing now, to distinguish it easily from other blocks of print.
However, the main reason I emphasize like I do is not because I think that people will find it more interesting but because experience has shown that some people are very dense. So dense that I hope, in defiance of the gods of rationality, that they may actually understand what I’m saying and not take it out of context.
Unfortunately, it does not work. I’ve come to the conclusion that some process in the brain automatically distorts whatever communication is being made to those who simply don’t want to listen. I metaphorically refer to it as “short circuiting” their minds.
So, I have to sadly regret that even a bullhorn, inches away from their ears, will fail to get the point across. Too bad. On other sites I was actually having fun using multi-colored text, highlighting, bold, italics, underlining and even large sized print, in all sorts of combinations, to get the point across.
It may have looked amusing in a garish way, but it wasn’t my idea of getting attention, as you imagined. It was simply my way of beating a dead horse.
From: mecago on August 18, 2010 at 9:50 pm
More like reasonable people tend to ignore those who continually feel the need to shout to get their points across. Italics and bold together, and frequent use of all caps?
If your points are good they will stand just fine without the continual emphasizing. You can’t do much for people who won’t listen to any reason and have their minds made up, no matter how loud you scream. To those who may be inclined to be reasoned with, right now you’re the raving lunatic on a streetcorner. Might be worth watching for the show, but the content just becomes part of the act.
Black Flag says:
August 18, 2010 at 8:10 pm
How far has the insanity extended that we proclaim that ice “has recovered” -inferring its loss was some sort of ‘concern’.
Makes one think that the entire continent covered in miles of the stuff would be “wonderful”.
It’s not as if the choice has to be between one state or the other. You have heard of Goldilocks I’m sure.
People will see, within 10-20 years; an ice free Arctic in the summer, at least for a few days at first, in 10-20 years. Weather changes will begin before total meltdown in about half that time, 2015-2020.
Yes, I’m aware of the foolish excuse used by many to shrug off the implications of such a radical change. Ohhh duhhh, it happened before so what?
Well . . . I guess this is where I’m supposed to get into a well thought out; highly detailed; and lengthy explanation. Instead, I’ll use another tactic.
“Do not give dogs what is sacred; do not throw your pearls to pigs. If you do, they may trample them under their feet, and then turn and tear you to pieces.” Matthew 7:6. New International Version
Since I’m not religious, I’ll translate it into non theological language. Find out yourselves or die in your ignorance.
Dear Mr.Watts and Mr.Goddard,
Since you did not post any analysis method, nor any data source, can you please inform us how you obtained your conclusion that “It has been the coldest summer on record north of 80N” ?
Especially since the summer officially does not end until September 12, this statement seems rather premature.
Also, can you please confirm (or deny) that your data source for the first graph in your post is from DMI :
http://ocean.dmi.dk/arctic/meant80n.uk.php
and can you please tell us how you obtained your conclusions that “Summer has come to a premature and frosty end” and “It also appears that the summer melt season will be the shortest on record” and “it appears likely that we are headed for an early minimum.” now that the temperature trend reversed, is again above 0 C, and is going up ?
Moreover, now that the trend is reversed, which part of your remaining projections and the starting point of your post (“Summer has come to a premature and frosty end at Santa’s workshop.”) and (“It has been the coldest summer on record north of 80N”) would still look anything more than wishfull thinking ?
Thank you
Rob
Re: Rob on August 19, 2010 at 12:40 am
From: Neither Mr. Watts nor Mr. Goddard
Oh come on! Of course that’s the DMI graph. As far as “coldest summer” goes, Steve already mentioned about that:
http://wattsupwiththat.com/2010/08/15/sea-ice-news-18/#comment-459428
Just run through the archive and see how much area is above the 273K (0°C) line. It’ll take a while above that line for this year to lose its “coldest” ranking, and I don’t see it happening with this blip. In any case, see the Sea Surface Temperatures. This little bit of warm air isn’t going to warm all that water up. The melt season will be ending, soon.
BTW, meteorological summer is June, July, and August. Meteorologists go by whole months. Thus August 31 is the last day of summer, just 12 days from now.
Re: mecago on August 19, 2010 at 12:40 am
But mecago, there is no choice. Per IPCC AR4, we are headed for many decades of further global warming, even if we shut down civilization and all related CO2 emissions now. It will go on for centuries to come, it may be a millennium until the rise finally stops.
Thus the temperature will rise, and all the glaciers and all that Arctic and Antarctic ice will melt away, no matter what we do. Thus adapting to the changes that will come is our only hope for the human species to survive.
Bye bye, Arctic ice! It was nice knowing you!
So kadaka, we have had the coldest summer on record north of 80N and during July and the first 10 days of August (the most important period of the melting season when decrease rates are highest) we’ve seen adverse weather conditions that greatly influenced the melt.
But despite all of that, both the Northwest Passage and the Northern Sea Route are opening up, and 2010 still has a chance of going below 2009 and perhaps even the 5 million mark (although weather is looking to flip again next week).
How is this possible? Wasn’t the ice so thick we would definitely see another ‘recovery’? Can you imagine what would have happened if instead of 6 weeks we’d had only 3 weeks of adverse weather conditions and a stalled Beaufort Gyre and Transpolar Drift Stream?
I can imagine. We’d be below 5 million square km right now and discussing whether a new record minimum extent was in the books.
mecago,
Here is another saying for you:
“We have no right to inflict our solutions upon the problems that our kids have not yet experienced or have”.
In other words, acting now for a problem that does not exist will most definitely create far worse problems for the future.
I am very confident that our children will be able to deal with their lives and their issues without our dabbling in pretense that we actually know what is going on.
stevengoddard says:
August 18, 2010 at 7:59 am
Jeff P
Whether final ice extent comes in a little above or below 5.5000000 million, the amount of MYI should see significant growth by next spring.
You are aware NSIDC’s official forecast was also 5.5 million? I’m assuming that you are familiar with the concept of precision and error bars.
———————-
LOL if you know what the MYI is going to be for next year where are you predictions for minimum ice extent for 2011, 2012 and 2013?
Yup, I am familiar with error bars and haven’t seen any on your predictions. If I’ve missed them please provide the link.
mecago says:
August 19, 2010 at 12:40 am
“Well . . . I guess this is where I’m supposed to get into a well thought out; highly detailed; and lengthy explanation. Instead, I’ll use another tactic.
“Do not give dogs what is sacred; do not throw your pearls to pigs. If you do, they may trample them under their feet, and then turn and tear you to pieces.” Matthew 7:6. New International Version
Since I’m not religious, I’ll translate it into non theological language. Find out yourselves or die in your ignorance.”
Hmm, I’m guessing a more realistic interpretation is:
“The high priests of the AGW cult have declared these pearls of wisdom sacred. Let not the unwashed masses examine them too closely or they will trample upon our divined data and tear our arguments to pieces.”
I can see why Matthew 7:6 could be making the rounds in the AGW community. It fairly accurately describes both their attitude and their actions toward those holding dissenting views. Ah, Climategate, a door that, once opened, cannot be closed.