By Steve Goddard
Summer has come to a premature and frosty end at Santa’s workshop.
")
http://psc.apl.washington.edu/northpole/webphotos/noaa2.jpg
It has been the coldest summer on record north of 80N, and temperatures have dropped below freezing ahead of the average date.
")
The entire ice covered region is now below freezing.
")
http://www.esrl.noaa.gov/psd/map/images/fnl/sfctmp_01.fnl.gif
It also appears that the summer melt season will be the shortest on record. The maximum was reached very late in March, and it appears likely that we are headed for an early minimum.
")
Mark Serreze at NSIDC has stated :
As the climate warms, the summer melt season lengthens …”
He was also reported as saying :
Mark Serreze of the center forecast the ice decline this year (2010) would even break 2007’s record.
Another interesting fact is that we are almost certain to see a large increase in the amount of multi-year ice (MYI) next year. The reason being that almost all of the 1-2 year old ice (turquoise) in the NSIDC map below will become classified as MYI next spring.
")
We have seen a remarkably rapid recovery from the 2008 low volume.
PIOMAS continues to report record low volumes of ice, despite all evidence to the contrary. The image below shows in red how far off the mark their August 15 forecast was. Their modeling error will get much worse over the next two weeks – because they model much of the thick multi-year ice in the Beaufort Sea and Arctic Basin as only a few tens of centimetres thick.

With the cold temperatures, ice area loss has almost stopped.

http://arctic-roos.org/observations/satellite-data/sea-ice/observation_images/ssmi1_ice_area.png
However, ice extent continues to drop – because the Arctic Oscillation has turned negative and winds are compacting the ice towards the pole. This bodes well for continued growth of ice in 2011.
")
http://www.ijis.iarc.uaf.edu/seaice/extent/AMSRE_Sea_Ice_Extent.png
PIPS shows average ice thickness increasing, due to the compression of the ice.
")
There has not been a lot of ice loss during August. The modified NSIDC image below shows in red, areas that have lost ice since August 1. Note that the Greenland Sea appears to have lost ice. This is due to the fact that there has been very little transport out of the Arctic Basin through the Fram Strait, which again bodes well for ice gain in 2011.

The modified NSIDC image below shows ice gain since 2007.

NSIDC maps continue to show more gain (16%) than their graphs (10%.) I have not been able to get a satisfactory explanation from them about the cause of that discrepancy. DMI shows a 25% gain in 30% concentration ice over 2007.
My forecast (dashed line below) minimum of 5.5 million (JAXA) continues to look conservative. It all comes down to what the winds do over the next few weeks. If the winds keep compressing the ice, the minimum may go a little below 5.5. If the winds quiesce, the minimum may come in a little above 5.5 – which is looking like a pretty good number right now. Some people at NSIDC started out with a 5.5 forecast this year, but seem to have backed away from it since.

Academic theories about the Northwest Passage becoming a commercial shipping opportunity appear pretty clueless.
“The plans that you make can change completely,” he says. This uncertainty, delay, liability, increased insurance and other costs of using the Northwest Passage are likely to deter commercial shipping here. A ship with a reinforced hull could possibly make it intact through the passage. But if it got stuck, it would cost thousands of dollars for an icebreaker like the Amundsen to come to the rescue. So even if the Northwest Passage is less ice-choked than before, the route may not become a shipping short-cut in the near future, as some have predicted.
The South Pole will almost certainly set a record for most sea ice this season. It is almost there, and there are still several months of growth remaining.
")
http://www.iup.uni-bremen.de:8084/amsr/ice_ext_s.png

http://nsidc.org/data/seaice_index/images/daily_images/S_daily_extent.png
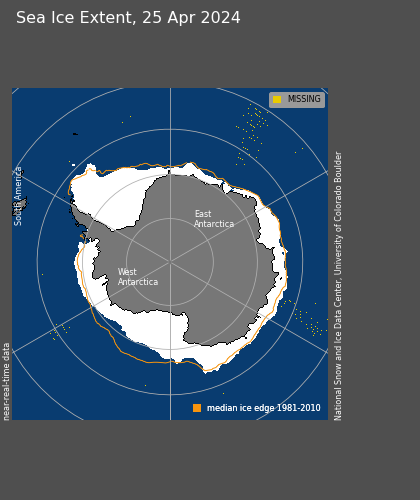
As seen below, the symmetry between the North and South Pole is impressive through the satellite record. They always seem to move opposite each other and produce an approximately constant amount of sea ice. It would be nice if the experts focused on solving this relationship rather than making up forced explanations like the “Ozone Hole” – which has just started forming for the year and will be gone before Christmas.

UIUC North/south anomalies overlaid on top of each other.
http://arctic.atmos.uiuc.edu/cryosphere/IMAGES/seaice.anomaly.arctic.png
http://arctic.atmos.uiuc.edu/cryosphere/IMAGES/seaice.anomaly.antarctic.png
(Note to posters and ice experts. Before you embarrass yourself making comments about how seasons are out phase at opposite poles, remember that this is normalised data and the period is in excess of 30 years.)
Conclusions:
The “long term trend” (30 years) in Arctic ice continues to be downwards, and would be even if the ice minimum was a record high this summer. But the three year trend shows strong growth of extent, thickness and age. Meanwhile, Antarctic ice is blowing away the record books. Yet the press continues to spread massive disinformation about the state of ice at both poles. Who could possibly be responsible for that?
Sponsored IT training links:
Get COG-112 materials along with 352-001 dumps to practice and pass 000-977 exam in timely and cost saving manners.
It will be interesting to see how much ice those warm southerly winds will melt in situe before the change Steve and, I think, someone else forecast earlier.
Andy
Steve,
In your initial post you said
“It has been the coldest summer on record north of 80N, and temperatures have dropped below freezing ahead of the average date.”
Have you got the data source for that, ie the actual temp values? It doesn’t make it clear where you got the data to come up with that information.
Andy
AndyW
DMI temperature data is here. You can click on any year since 1958 for comparison.
http://ocean.dmi.dk/arctic/meant80n.uk.php
Steve, you may be right about the compression, but looking at the concentration image at http://www.ijis.iarc.uaf.edu/cgi-bin/seaice-monitor.cgi?lang=e it seems that there are some central areas that have less ice concentration than last year at this time. But of course we may still see an earlier end to the melt season this year than last year.
The final days of the 2010 melt season are here and the horse race is on.
2010 is the 9th year in the JAXA record. How will it place?
As of today 2010 already has the 2003 minimum beat. Sorry 2003 you will remain in last place. This puts 2010 in a comfortable 8th place so far.
Next up is 2004 at 5.78 million k^2. Will it fall? Only time will tell.
stevengoddard says:
August 17, 2010 at 6:28 am
AndyW
DMI temperature data is here. You can click on any year since 1958 for comparison.
http://ocean.dmi.dk/arctic/meant80n.uk.php
Are you saying you just eyeballed it and don’t have the figures? How can you be sure that you don’t have a bias introduced due to your leanings on this matter?
I think you should have at least put some sort of point to that affect with your statement if that is what you did.
Andy
AndyW
Gee. If climate people would start releasing the data which they use to make graphs, it would sure make life easy for us, wouldn’t it?
JAXA seems to be about the only organisation which provides simple, daily X-Y digital data.
I don’t know about the DMI data, but I just created a Jun-Jul mean from NCEP/NCAR 925 mbar air temperatures from 1948-2010 for the 80-90N region. The 1948-2010 average Jun-Jul 925 mbar air temperature is -0.34C. For 2010 the value is 0.58C. Thus, 2010 is not tracking as the lowest ever temperature for 80-90N in this reanalysis data set.
The mean for 2010 is lower than for 2007-2009, but it remains warmer than the 1948-2010 mean.
stevengoddard says:
August 17, 2010 at 8:50 am
AndyW
“Gee. If climate people would start releasing the data which they use to make graphs, it would sure make life easy for us, wouldn’t it?”
Good point. I doubt this will not be UEA mk2 though 🙂
As an aside do you have any thoughts on why there are such big fluctuations apart from in the summer months? I’m sure that point has cropped up before but I am more JAXA than this site so it may have passed me bye. It seems a bit odd.
Andy
oops spelling!
Thanks Julienne that’s good to know. The reason I came back to Steve’s point is that his statement has appeared somewhere else on the web and already he is being both misquoted and it is now becoming “fact” that Arctic summer 2010 is the coldest ever, even though it has not ended.
Andy
From: mecago August 17, 2010 at 4:45 am
Wikipedia:
From GBN’s “About GBN: What We Believe” page:
And the Ideas section of GBN’s main page:
Berkeley, “The West” losing relevance, and the Rockefeller Foundation.
Was that crack about a “sneaky Communist plot” supposed to be a joke?
True Communism is dead, the “intellectual elite” has gotten scared after seeing what happens when the “uneducated peasants” work their way into the power structure, as in the former USSR (or CCCP if you prefer), or a family line of megalomaniacs as in North Korea, and they have noted the Chinese example where their Communist Party has adopted elements of capitalism to prosper while maintaining rigid control over the people.
Thus One World Government controlled by the Intellectual Elite has been the goal for awhile now. Per Maslow, the “common people” must have their basic needs fulfilled: keep them clothed and sheltered with food in their bellies (by government handouts as needed), give them work to keep them occupied (even government jobs as needed and possible), let them feel they are accomplishing something (e.g. ownership of a home by paying off a large mortgage), and let them know they will not be discarded (Social Security, Medicare/Medicaid leading to “universal” health care). Thus they will be quiet and amenable to being led by their superiors (per China). Let capitalism control the economy, but in a tightly-controlled fashion, with capitalism being handy for blaming for any economic woes even when they are actually caused by the government. Then press for a One World government (Rockefeller Foundation, GBN’s repeated mentions of the importance of NGO’s which normally coordinate with the UN) so their government model is the only one available.
Thus the elite can have control, the power and the money, and not worry about the Ignorant Unwashed Masses screwing things up (for them) as usual.
Nope, not a Communist plot at all.
And of course, the Urgent Need to combat
Anthropogenic Global WarmingCLIMATE CHANGE is a great excuse for the resultant decline from the previously-expected Western (read United States-type) lifestyle…🙂
Breaking Global Warming (Climate Change) down to it’s purest base element: If all U.S. Government grants, subsidies and other funding for the studies, etc., of them were to cease today, so would they.
It really is that simple.
Put another way: Algore wasn’t able to use it to get himself into the White House, but he’ll take the next best thing– the penthouse.
Julienne
I am having a difficult time believing that the average summer temperature north of 80N is below freezing. I have always read that it is between 1 and 2 C, as DMI shows.
Most of the cold has been in August anyway, which is not included in your analysis.
Steve, I’m not able to include August yet since I used the monthly time-series link in the NCEP/NCAR data (http://www.esrl.noaa.gov/psd/cgi-bin/data/timeseries/timeseries1.pl).
One thing you should note is that I am reporting on near-surface air temperatures at 925 mbars and I’m not exactly sure what DMI is reporting. I do not trust surface temperatures from reanalysis data sets since reanalysis fields for variables such as terms of the surface energy budget are less reliable as they are not directly influenced by observations of that variable. It is also not clear (or easy to find out) what is actually assimilated at a given time and location.
This is about AO index which affects Northern temps. The NOAA CPC website shows May-August AO index as an undulating curve, with highs a bit over +1 and lows at -2.
http://www.cpc.noaa.gov/products/precip/CWlink/daily_ao_index/ao_index.html
Yet the 3- month running mean AO index graphic shows a positive value of +2 right now. Am I missing something?
http://www.cpc.noaa.gov/products/precip/CWlink/daily_ao_index/month_ao_index.shtml
Well my current forcast for 2010 Arctic sea ice minimum is 4.84E^ km^2 (standard deviation = 0.22E6 km^2).
2010 passes (is lower than) the minima for 2004, 2006, 2005, and 2009 on 8/19, 8/19, 8/29, and 8/31, respectively.
From: EFS_Junior on August 17, 2010 at 11:25 am (Sea Ice News #18)
From: EFS_Junior on August 10, 2010 at 11:08 am (SIN #17)
That’s the spirit! Keep being optimistic and adjusting that forecast upwards, maybe it’ll even get close to the final figure!
How long has Steven kept with his original numerated forecast made way back on…?
😉
Matt says “Binary ice data for the northern and southern hemispheres are here …”
Thanks for the tip Matt, but I have drawn a blank. I don’t know how to get data out of those binary files.
I’m looking for is a fairly simple series of daily southern hemisphere sea ice extent (or area or index or anomalies) in a csv file or txt file. There are graphs all over the place, but I cannot locate a data series.
NH is easy to get from JAXA.
Julienne
It appears that there have been low clouds over the North Pole for almost the entire summer. If those clouds are lower than 925 mb (800 metres) then your numbers are probably not going to be a good indicator of 1000 mb temperatures.
Julienne,
I looked up the info on the source of your “reanalysis” data and it’s described thus:
“PSD maintains a collection of reanalysis datasets for use in climate diagnostics and attribution. Reanalysis datasets are created by assimilating (“inputting”) climate observations using the same climate model throughout the entire reanalysis period in order to reduce the affects of modeling changes on climate statistics. Observations are from many different sources including ships, satellites, ground stations, RAOBS, and radar. Currently, PSD makes available these reanalysis datasets to the public in our standard netCDF format:
*
NCEP/NCAR Reanalysis I (1948-present)
This reanalysis was the first of it’s kind for NOAA. NCEP used the same climate model that were initialized with a wide variety of weather observations: ships, planes, RAOBS, station data, satellite observations and many more. By using the same model, scientists can examine climate/weather statistics and dynamic processes without the complication that model changes can cause. The dataset is kept current using near real-time observations.”
I’m sorry, but while this data might be useful for determining broad temperature trends, to use it to claim a few tenths of a degree trend over several decades is, to me at least, total nonsense, especially given what Anthony Watts has managed to uncover about the surface stations themselves. And should I really trust NOAA to tell me the temperature of the Arctic for the past 62 years when all sorts of arguments have broken out in here over their published Arctic temps for just the past 6 months?
Now, the DMI graphs might suffer similar issues, or different issues, but they, at least, seem to be focused on the Arctic north of 80 degrees. My inclination is to presently give them more credence than a model designed to analyze (or re-analyze) data all over the globe. (I wish someone would explore the issue of reliability of DMI’s data, by the way.) I should add that the only use I’ve made of it is to cycle through the years 1958 to present, comparing summer temperatures graphically. If one does that it will become quite clear that they indicate that this is the coldest summer ever in the arctic, by their measures.
As I keep saying in here, the data in this field is really suspect. The more I learn, the more corrupted it seems to me. By the way, is this “Satellitegate” nonsense going around now for real, or is it just some more loony talk we should ignore? The first report I saw on it seemed so far-fetched that I put it in the “ignore” bucket.
Rod, you should understand that DMI is based on ECMWF. They are not producing the temperature fields, they are only showing you the temperature fields extracted from ECMWF. You can extract “focused”80-90N NCEP/NCAR temperatures the same way as DMI is doing from the ECMWF data. You can also do it from the JRA-25 Reanalysis (which is supposed to be more accurate) or from the MERRA reanalysis data set (which is supposed to be the latest and greatest reanalysis dataset). JRA-25 isn’t as current though as ECMWF or NCEP which is why these are typically used for near real time analysis. To believe the DMI extracted temperatures are more accurate than NCEP is false. (note ECMWF and ERA40 are the same thing). You can go here for some more information on the accuracies of the different reanalysis data sets (and then click on appropriate links):
http://gmao.gsfc.nasa.gov/research/merra/reanalysis_precipitation_climatology.php
Steve, what is your source for cloud cover and cloud heights for the Arctic this summer? Have you looked at Calipso data or some other satellite data source? Or is it based on station data?
kadaka (KD Knoebel) says:
August 17, 2010 at 12:09 pm
From: EFS_Junior on August 17, 2010 at 11:25 am (Sea Ice News #18)
Well my current forcast for 2010 Arctic sea ice minimum is 4.84E^ km^2 (standard deviation = 0.22E6 km^2).
From: EFS_Junior on August 10, 2010 at 11:08 am (SIN #17)
My current estimate for Arctic sea ice extent, bases on JAXA data 2003-2010 inclusive is 4.79E+^ km^2 (standard deviation is 0.25E+6 km^2).
That’s the spirit! Keep being optimistic and adjusting that forecast upwards, maybe it’ll even get close to the final figure!
How long has Steven kept with his original numerated forecast made way back on…?
😉
____________________________________________________________
If enough people guess a number, one of them is bound to guess the right number.
I have a statistical model, updated each day with the latest JAXA number, so I could give you a new number every day. I’ve posted several times, with each SIEU, since #12 (or #13), my first estimate was 3.9E6 km^2, as each day passes, all future estimates pivot from that new data point (+/- four sigma, I chose +1 sigma BTW), the model automatically converges to the actual minima (you’ll note that the standard deviation decreases chronologically, in all my estimates (and obviously to zero at the minima).
Or I could just guess a number, as SG has done.
IMHO, not a very foolproof methodology.
Steven Goddard:
A question. I remember hearing Dr Lindzen mention that that whipsaw temperature swings that occur in the DMI reading in winter-spring and fall-winter were likely caused by weather systems moving into the region. Can you post weather maps to go along with the ice charts etc so we can get an idea of what’s happening north of 80? Not that you don’t have enough to do…
Sean Peake
Arctic summer weather is different. It is buffered by the heat required to melt ice and remains in a narrow range.