Readers may recall a story on WUWT from April titled: Solar Dynamics Observatory – STUNNING first images and movies
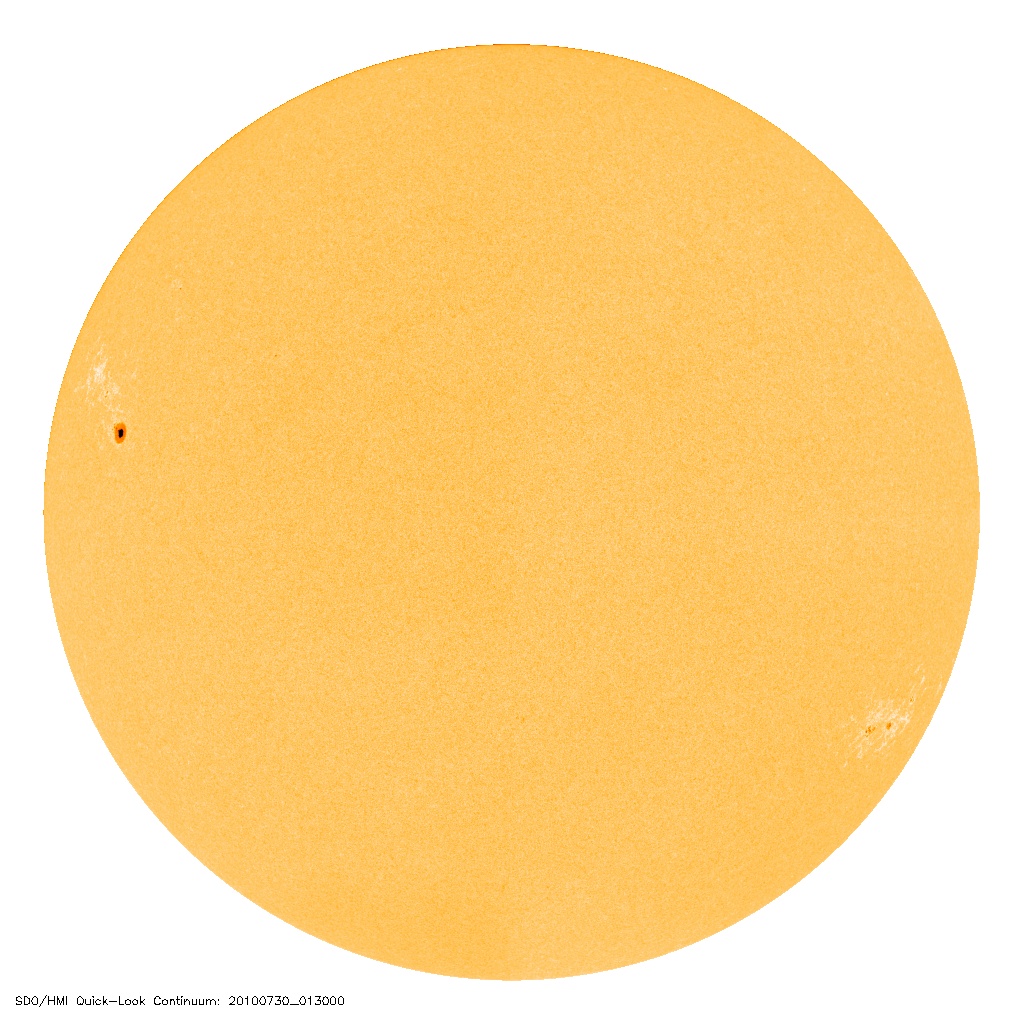
Now, SDO imagery of the sun is online. This week spaceweather.com has started using SDO sunspot imagery in place of the familiar SOHO MDI image on their left sidebar. See all resolutions: 4096, 1024, 256 The upside of the 4096 pixel image is that the detail is striking, the downside is that even tiny sunspecks are now visible in exquisite detail.

The real question now is; what will this new detail do to sunspot counts. As we saw in August 2008, when SIDC retroactively counted a sunspeck to snatch away a spotless month, will the SDO now be the new speckometer? Older telescopes and projection methods would never have seen the sunspecks we see today.
As we see with Geoff Sharp’s Layman’s Sunspot Count, both SIDC and NOAA’s counts are higher than the layman’s count. Now with SDO imagery, will even more miniscule sunspecks widen the gap between them? See the graph below comparing SIDC, NOAA, and LSC:

From Geoff Sharp’s website, here’s how the new Layman’s count works:
THE LAYMAN’S COUNT METHOD & HISTORY
There has been a lot of comments recently about the tiny specks that have been counted as sunspots. A tiny speck can get a daily count of 11 which severely skews the record. Also I have noticed on the SIDC record some days where the Sun is completely blank but the records show a sunspot count. NOAA is another magnitude higher than the SIDC, NOAA using a different method not meant to compare with the historical count. During times of high speck count we need a new standard to record sunspots that gives us a realistic measure of today’s activity verses the last Grand Minimum.
Robert Bateman a very motivated amateur solar enthusiast and myself started a thread at www.solarcycle24.com (which has unfortunately developed into an anti Landscheidt, Pro AGW forum) and soon devised a plan to come up with a reliable standard. We would use the existing SOHO 1024 x 1024 Continuum images and measure the pixels involved in a Sunspot. Initially it had to be determined what a standard sunspot should represent in size and density, to try and represent a minimum counter like Wolf may have done 200 years ago. After some deliberation and advise from Robert who also dabbles in Astronomy with his own equipment, we came up with a minimum standard.

To be counted, a sunspot or group must have 23 pixels which have a reading in the green channel of 0-70 for at least 24 hours.
All pixels in a digital image have a RGB reading which split out into separate Red, Blue, Green channels and can be easily measured and counted in one action using a freeware graphics program called GIMP.
So the standard was set, which now enabled us to go back over the records and weed out the offending specks and blank days.
The official Layman’s Sunspot Count is compared against the SIDC record which is considered conservative when compared with other institutions involved. Basically we use the same sunspot number as SIDC but replace them with zero on days that don’t make the grade. When the SIDC count is made up of two or more areas and if any of the area’s do not make the Layman’s Count, the overall SIDC daily count will be reduced by the areas that fail. Spots that count 23 pixels and over before midnight and then continue on to pass the 24 hour rule will take the SIDC value of that day. Existing Spots that have made the grade but measure less than 23 pixels at midnight are not counted on the next day.
===================================================
Unless solar science comes up with a way to deal with the advances in technology and properly merge it into the older human-optical record, the sunspot record will start looking like the surface temperature record, with upwards trends due to adjustments (or lack thereof).
I think Sharp and Bateman are on to something, and if you’ll provide me a graphic that isn’t drop shadowed onto a dark background, I’ll add it to the upcoming WUWT solar page with a link to yours. – Anthony
Leif Svalgaard says:
July 31, 2010 at 11:50 pm
The problem with Wolf’s threshold is that it is not quantified [or even quantifiable], not even by himself.
Wolfer argued that this was much too vague and advocated [which ALL reasonable observers today follow] to count everything that was visible. Differences between observers could then be handled by the ‘constant’. To put in a threshold is to bias the count from the get-go and is VERY BAD PRACTICE, but may serve your purpose well.
Perhaps you should read your last statement and pause for a moment. What are we trying to achieve with the Layman’s Count?
We are tying to count this cycle and maybe the next, the way Wolf counted/reconstructed so that (as everyone else seems to appreciate) we can compare this possible grand minimum event with the last. You may disagree that a grand minimum is happening, but the signs are ominous and its far easier to measure it now as it was done in the past, instead of retrospectively.
Wolf obviously had his own threshold which appears to be lost to history, and you didn’t answer the question regarding the counting of specks in a larger group, so there is some vagueness. I think we have come up with a method that is close, which will allow proper comparison.
I think the problem we’ve got in understanding solar activity goes much deeper than arguing about number of sun spots.
Our observational history of the suns behaviour only goes back around 1000y with much of the early data being patchy, yet the sun has been in existence for about 4.5 billion years, so we have only seen a tiny fraction of our variable stars total gamut of behaviour.
After a few more million years of observation we might actually know what goes on, rather than having to use guestimates based on short term data.
If Svalgaard et al hypothesis is right than we are at the door of Grand Minimum (Dalton not Maunder type), which will last 2 at the most 3 cycles
http://www.vukcevic.talktalk.net/LFC2.htm
A Maunder type minimum is due 2180 – 2235
Hathaway’s SC4 prediction is due in a day or two.
http://solarscience.msfc.nasa.gov/images/ssn_predict_l.gif
He’s been practising downhill slalom starting at elevation of 175 and now has reached 60.
Is he still on the hillside slope (coming down) or reached bottom of the valley?
What do you think?
Daily Sun: 01 Aug 07
http://spaceweather.com/archive.php?view=1&day=01&month=08&year=2007
Sunspot number: 11
http://spaceweather.com/images2007/01aug07/midi512_blank.gif
“the downside is that even tiny sunspecks are now visible in exquisite detail.” Who needs sunspecks????
Daily Sun: 01 Aug 10
http://spaceweather.com/archive.php?view=1&day=01&month=08&year=2010
Sunspot number: 12
The new SDO Continuum images displayed on spaceweather.com seem to be elusive. Do they have a special deal?
Geoff Sharp says:
August 1, 2010 at 3:15 am
We are tying to count this cycle and maybe the next, the way Wolf counted/reconstructed so that (as everyone else seems to appreciate) we can compare this possible grand minimum event with the last.
Wolf did not count [and neither did hardly anybody else] during the Dalton Minimum. He tried to guess the SSN using auroral frequency, magnetic needle, and a few scattered observations. So there is nothing to compare with.
Wolf obviously had his own threshold which appears to be lost to history
You can reconstruct the ‘threshold’ by taking a modern image with many spots/specks and then successively throw away the smaller ones until you get the SIDC count, or you can simply multiply by 0.6.
and you didn’t answer the question regarding the counting of specks in a larger group, so there is some vagueness.
The grouping is not important for this. As far as I can tell, a spot was/is counted no matter where it is. Hoyt & Schatten tried to sidestep the problem by not counting any spots at all, only the groups. They find for modern data that the Wolf number should be 12 times the number of groups. You could interpret this as one group on average having 11 spots/specks.
I think we have come up with a method that is close, which will allow proper comparison.
As far as I can tell, all the curves you show are identical within the noise, and you really should multiply the SWPC count by 0.6 to bring it to the same scale. What you are doing now is akin to plot Fahrenheit and Centigrade temperatures on the same graph and saying ‘see they are different’.
You can make no real comparison with Dalton as the data simply aren’t there to do this, except in the crudest terms. The SSN back then is uncertain by a factor of two, even to the point where people claim [wrongly IMHO] there was an extra cycle that was lost.
And don’t forget that the SIDC count is presently too low compared to everybody else who counts spots.
One more time: there is no good data for the Dalton minimum. It matters not what Wolf’s threshold was as he was not observing. The magnetic needle data [the little we have] suggest that cycles 5 and 6 were small, see slides 9 and 14 of http://www.leif.org/research/H02-FRI-O1430-0550.pdf
but we don’t really know how small with any precision. Cosmic ray data also suggests a small cycle http://www.leif.org/research/Solar-Activity-1785-1810.png but again with large uncertainty. In view of all this it seems pointless to try to degrade modern data to match observations that Wolf didn’t even make.
M White says:
August 1, 2010 at 6:42 am
Daily Sun: 01 Aug 07
“the downside is that even tiny sunspecks are now visible in exquisite detail.” Who needs sunspecks????
But that’s just the point here, isn’t it?
Why, with just a bit more power with which to observe, the pseudo-counters would actually be counting virtually the entirety of the photosphere anomalies of the Sun!
There’s something there about ‘A little bit of knowledge is dangerous …’
Give a kid a magnifying glass and he sets small fires. But give him a Fresnel lens and he’ll set the whole world ablaze!!!
Leif Svalgaard says:
July 31, 2010 at 9:15 pm
The Greenwich data is available somewhere, I’m sure.
The only data I can get ahold of is O’Gyalla and Haynald, http://fenyi.solarobs.unideb.hu/HHSD.html
Beograd is also publicly available.
ftp://ftp.ngdc.noaa.gov/STP/SOLAR_DATA/SOLAR_IMAGES/Beograd_WhiteLight_57to59/
Wendelstein: ftp://ftp.ngdc.noaa.gov/STP/SOLAR_DATA/SOLAR_IMAGES/Full_Sun_Drawings/Wendelstein/
If you have a case example that fits with the times of O’Gyalla/Haynald, let’s look at it.
Greenwich is behind an expensive paywall, and no way to know what you are going to get before the $$ is laid down.
rbateman says:
August 1, 2010 at 9:00 am
The only data I can get ahold of is O’Gyalla and Haynald
As the Waldmeier jump was in ~1946 or so, we need data for ten years before that until ten years after that [at least]. I don’t see any benefit for us to try to second guess what Greenwich so carefully already have measured for us. We do have digital Ca II data back to 1915 and they fully confirm the Waldmeier jump. So, where is the problem?
Leif Svalgaard says:
August 1, 2010 at 11:22 am
The problem is that Greenwich did not count the sunspots, they photographed & measured them.
CaII data may have jumped, but that’s not the visible sunspot activity being photographed.
CaII data is the faculae + network.
So, if the CaII photographic data shows a jump/no jump, does that indicate that the reason has to be a counting change, or could it be an exposure/emulsion sensitivity jump, or a change in Solar behavior?
I don’t have enough information at hand to say whether you are right or wrong.
rbateman says:
August 1, 2010 at 11:54 am
So, if the CaII photographic data shows a jump/no jump, does that indicate that the reason has to be a counting change, or could it be an exposure/emulsion sensitivity jump, or a change in Solar behavior?
It could be any of these, but since none of the other solar indices show a jump when Waldmeier took over, you have to either assume that they all jumped or that Waldmeier jumped. I prefer the latter.
The digitization [and calibration] of the Mt. Wilson Ca II images is done is such a way that sensitivity changes are eliminated. The observers describe their procedure here:
http://arxiv.org/abs/1005.5402
I don’t have enough information at hand to say whether you are right or wrong.
Luckily, I have, and I have shared that with everybody.
Leif Svalgaard says:
August 1, 2010 at 12:33 pm
I would rather not assume, but to see the images before and after Waldemeier, and compare them with the counts.
So, let’s say it was Waldmeier. What then?
If we change counts to make the discrepancy go away, it won’t do anything to prevent future or correct previous miscounts.
If we derive the counts from measurements, the uncertainty will be reduced, and new detection technologies will not affect things the way they do now.
Now, what if it wasn’t Waldmeier, but a Solar behavior change affecting only the visible?
The counts are still not agreeing with the other indices, but they are correct.
Is then the SSN doomed to wander in and out of correlation?
Again, if the indice is derived from actual measurements, the SSN won’t be the only thing to go out of correlation.
You can have your indice, and it will be more precise.
rbateman says:
August 1, 2010 at 5:01 pm
I would rather not assume, but to see the images before and after Waldmeier, and compare them with the counts.
That is what people have done. But please go ahead. Here are some pre-Waldmeier images:
http://www.astro.ucla.edu/~ulrich/MW_SPADP/ExtractedImages/Webpages/Imagepages/Page384.html
and here are some post-Waldmeier images:
http://www.astro.ucla.edu/~ulrich/MW_SPADP/ExtractedImages/Webpages/Imagepages/Page477.html
So, let’s say it was Waldmeier. What then?
If we change counts to make the discrepancy go away, it won’t do anything to prevent future or correct previous miscounts.
First, these are not ‘miscounts’, they were the best, experienced, and conscientious observers could do. That the series are not homogeneous is a fact of life [it is difficult] and that problem will always be with us. But there will always be careful scientists [like yours truly] that will keep an eye on this and do their best to maintain the scientific values of our long-term series.
Now, what if it wasn’t Waldmeier, but a Solar behavior change affecting only the visible?
L&P might be a sign of this being possible, but in case of Waldmeier, I think the case is clear enough. He even himself expressed doubt that he might not have gotten it right.
The counts are still not agreeing with the other indices, but they are correct.
The counts are meaningless without the circumstances of their production [person, telescope, seeing, etc]. So they are correct, but meaningless numbers in themselves. Here is a correct number: “42”.
Is then the SSN doomed to wander in and out of correlation?
Nobody cares about the SSN as such. What we are after is a reasonable measure of solar activity. The SSN can be such a measure to a degree. We have found that the calibration is not simple or constant, but we can manage that and still construct a measure of solar activity by careful attention to detail and using all available information. What is a bit frustrating is the resistance to such efforts [e.g. “the historical record stands”]
The silly thing to do is to try to compare with observations that Wolf didn’t even make, etc. It is, of course, necessary to also take into account peoples’ agendas and reasons for doing this. As scientists [such as myself] we do the very best that can be done with available material.
L&P might be a sign of this being possible, but in case of Waldmeier, I think the case is clear enough. He even himself expressed doubt that he might not have gotten it right.
We won’t know that with CaII images as above. I too have considered that Waldmeier might have witnessed a change in visible Solar Activity, and not known about it. The early Sunspot observers had no idea that sunspots were a regular phenomenon when they disappeared in the Maunder.
Nobody cares about the SSN as such. What we are after is a reasonable measure of solar activity. The SSN can be such a measure to a degree. We have found that the calibration is not simple or constant, but we can manage that and still construct a measure of solar activity by careful attention to detail and using all available information. What is a bit frustrating is the resistance to such efforts [e.g. “the historical record stands”]
A reasonable measure would be to measure and derive the SSN accordingly. At the very least, for the modern photographic record, the SSN would be much less prone to the human element.
First, these are not ‘miscounts’, they were the best, experienced, and conscientious observers could do. That the series are not homogeneous is a fact of life [it is difficult] and that problem will always be with us.
Miscounts as in counting ever tinier spots (that Wolf was afraid would happen) and whoops, there goes the consistency.
Is this not the topic- Sunspots at high detail now available from SDO – what will this do to the sunspot count?
No available photoheliograms from Greenwich = out of sight, and out of mind. ‘Tis a shame, if you ask me, to let a treasure go to waste.
rbateman says:
August 1, 2010 at 9:36 pm
We won’t know that with CaII images as above. I too have considered that Waldmeier might have witnessed a change in visible Solar Activity, and not known about it. The early Sunspot observers had no idea that sunspots were a regular phenomenon when they disappeared in the Maunder.
Visible solar activity is irrelevant [with the possible exception of TSI]. The UV is where the action is. It is highly unlikely that Waldmeier saw a change in sunspots. The Greenwich areas do not show this [and they were visible too].
A reasonable measure would be to measure and derive the SSN accordingly. At the very least, for the modern photographic record, the SSN would be much less prone to the human element.
Almost everybody does a good job measuring the SSN. The human element is not so important; seeing is the main culprit.
Miscounts as in counting ever tinier spots (that Wolf was afraid would happen) and whoops, there goes the consistency.
Wolf was not afraid of this, he just realized that going back into the [for him] historical record he would not get the tiny spots. Wolfer was right: all spots must be counted, no matter how small. There is no disagreement anymore on this. Consistency is impossible with wolf’s method. Only by counting all spots can we gain consistency. The problem of correcting Wolf’s ‘miscounts’ can be solved by calibrating [as Wolf did himself] the SSN using the geomagnetic data.
So, here is my recommendation:
1) count all spots/specs/pores [i.e. NO threshold]
2) calculate SSN = k*10*(Groups+Spots), to retain the simple, original formula [k=1 for official count].
3) update Wolf’s counts to the modern scale, by multiplying the Rz,i by the inverse of 0.6, namely 1.667.
4) fix the various glitches that have been identified” Wolf-Wolfer ~1880. Brunner-Waldmeier 1945, Zurich-Brussels 1981, 1 August 2001
Then we have consistency, and we can preserve the precious historical record.
Is this not the topic- Sunspots at high detail now available from SDO – what will this do to the sunspot count?
I don’t think it will do anything, as the number of tiny specks does not increase beyond a certain resolution which many observers already have.
2) calculate SSN = k*10*(Groups+Spots)
Better get the math right:
SSN = k*(10*Groups+Spots), with k=1 for the official count.
Monthly sunspot figures in for July.
NOAA(prelim) 23.5
SIDC 16.1
Layman’s 12.9
Lots of specks counted this month.
Geoff Sharp says:
August 2, 2010 at 1:24 am
NOAA(prelim) 23.5
SIDC 16.1
You should really multiply the NOAA count by 0.6 to bring it onto the same same scale as the others. Not doing so is akin to reporting the temperatures in New York and Brussels as 85 and 24.
Lots of specks counted this month.
As they should be.
Leif Svalgaard says:
August 2, 2010 at 3:53 am
You should really multiply the NOAA count by 0.6 to bring it onto the same same scale as the others. Not doing so is akin to reporting the temperatures in New York and Brussels as 85 and 24.
Lots of specks counted this month.
As they should be.
Yes Leif most of us are aware NOAA are doing their own thing, but what you are missing is that the 0.6 factor post Wolfer might be in the ballpark during normal solar activity but fails miserably when the speck ratio changes in times of solar downturn.
Leif Svalgaard says:
August 2, 2010 at 3:53 am
The informed might know…but do you think the general public discounts the NOAA sunspot value when reading spaceweather .com or indeed the widget Anthony displays on this website?
Geoff Sharp says:
August 2, 2010 at 7:58 am
Yes Leif most of us are aware NOAA are doing their own thing
They do NOT do their own thing, they count just like the rest of the world.
but what you are missing is that the 0.6 factor post Wolfer might be in the ballpark during normal solar activity but fails miserably when the speck ratio changes in times of solar downturn.
You language here is designed to spread FUD [fail, miserably] and does not have any factual contents.
If one compares NOAA and SIDC the past 20 years http://www.leif.org/research/NOAA-vs-SIDC.png is is evident that the 0.6 factor is applicable at all levels of solar activity from the peak in 1991 to the bottom in 2008.
The yellow and green dots depict the ratio SIDC/NOAA and have an average of 0.64, independent of solar activity. It is, of course, also clear that the scatter is larger when the SSNs are very small. This is normal statistical behavior when you divide a small number by another small number.
If there is any difference it is the 12% drop between the yellow and green drops that is the result of SIDC undercounting spots by that amount, as I have already pointed out [slide 13 of http://www.leif.org/research/SHINE-2010-Microwave-Flux.pdf ].
Geoff Sharp says:
August 2, 2010 at 8:44 am
The informed might know…but do you think the general public discounts the NOAA sunspot value when reading spaceweather .com or indeed the widget Anthony displays on this website?
They should not discount the NOAA values as they are quite OK [probably better than SIDC, actually], anymore than they should discount temperatures measured in Fahrenheit over those measured in Centigrade.
You should realize that to make the two series comparable, they should be expressed in the same units, so either you multiply NOAA by 0.6 or you increase SIDC by 1.67. Claiming that the two series are somehow different and that that is a severe problem that cries out for a ‘solution’ is misleading the general public.
Leif Svalgaard says:
August 1, 2010 at 10:28 pm
You have lost me. The story on Wolf vs Wolferer is not standing still.
Either Wolf preferred to measure rather than count, or he did not.
Either Wolf was right (as you have repeatedly told us) or he was not.
Now Wolferer is right.
Please clarify.
Does resolution matter when contrast is low?
http://www.robertb.darkhorizons.org/Count.jpg
Taken from SDO/ AIA-4500 20100802_160008