By Steven Goddard
The topic this week is verification of data sources. NSIDC reports :
At the end of the month, extent fell near the level recorded in 2006, the lowest in the satellite record for the end of May
That sounds bad! Let’s see how 2010 compares with ten, twenty and thirty years ago :

Ice looks healthier than 10 years ago

Ice looks healthier than 20 years ago

Ice looks healthier than 30 years ago
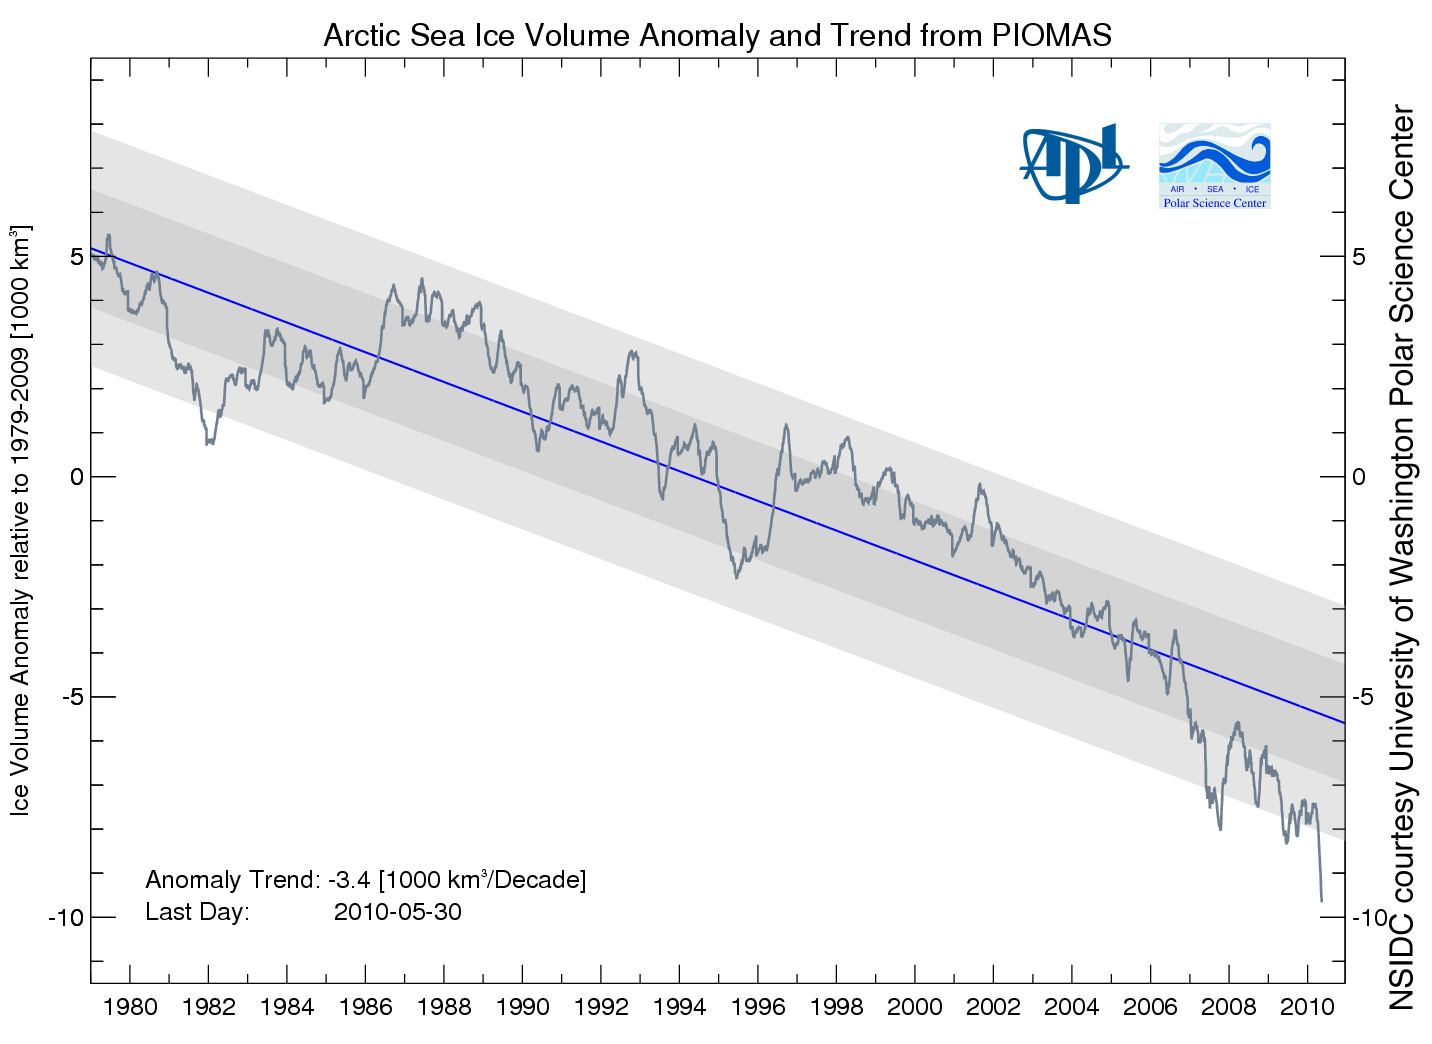
Then NSIDC discussed my favorite graph from PIOMAS, showing a record low anomaly of Arctic ice volume.

PIOMAS shows an anomaly nearly 50% greater than 2008. If that is correct, then surely we will have a record minimum this summer. However, the PIOMAS data seems inconsistent with PIPS2 data, which shows thicker ice covering a much larger area in 2010. My guess is that PIOMAS is looking at only a small region of the Arctic interior.
Next data source to look at are the Arctic Ice Concentration maps. UIUC has archived lower resolution maps since the start of the satellite record, such as the one below for June 11, 2010.

Their newer maps appear to show a lot more detail.
")
Note that the newer map shows a lot of low concentration ice in the Beaufort Sea (green, yellow, light pink.) Let’s see how that compares with a current satellite photo.

I must be missing something, because I don’t see much of that low concentration (green) ice in the satellite photo. The two videos below compare satellite vs new and old concentration maps. New comparison first :
The old concentration maps correlate much more closely with the satellite photo.
You can also see in the video below how erratic the bands of yellow and green are in the newer maps. They appear one day and disappear the next.
In the low colour version of the video, it appears that they may be having trouble differentiating between cloud cover and low concentration ice. We see large areas of open water switching to saturated ice overnight, and vice-versa.
It appears that the precision of the newer maps is much greater than their accuracy. Better to use a low precision map which is matched correctly with its accuracy.
Moving on, Barrow Sea Ice is starting to show first signs of thinning. By June 16, 2007 the ice had already broken up.
.
http://seaice.alaska.edu/gi/observatories/barrow_sealevel/brw2010/BRW_MBS10_overview_complete.png
Temperatures in the Arctic have continued below normal and below freezing for the last few weeks.
")
http://ocean.dmi.dk/arctic/meant80n.uk.php
NCEP is forecasting below freezing temperatures for much of the Arctic Basin during the next week.

This week, the sun reaches its highest point in the sky. Next week it starts its decline towards winter.
Now, the really interesting stuff. Arctic Basin sea ice volume (calculated from PIPS maps) remains close to the 2006 track, and well above the last three years

Area is slightly below 2006 and 2009.

Thickness is nearly identical to 2006 and 2007.

Conclusion : 2010 minimum extent is on track to come in just below 2006. With the cold temperatures the Arctic is experiencing, the likelihood of a big melt is diminishing.
NSIDC shows extent lower than 2007. The modified NSIDC map below shows where they believe the gaps are (in red.)

On the surface, this appears to disagree with my measurement above that Arctic Basin ice area is greater than 2007. The difference is that I am only considering regions that have perennial ice – i.e my PIPS calculations assume that there is no summer ice in Hudson Bay or the Barents Sea, and that they are a “don’t care” for estimating minimum extent. You can see in my PIPS ROI (Region of Interest) maps for June 14 below, that there is excellent agreement between PIPS and NSIDC. 2007 had less ice in the Chukchi and Laptev Sea, and more in the Beaufort Sea.

PIPS June 14, 2010

PIPS June 14, 2007
The modified NSIDC image below shows ice loss since June 3.

The modified NSIDC image below shows ice loss since early April.

And finally, the modified NSIDC image below shows regions which have below normal ice extent.

My analysis indicates the highest late summer extent since 2006. In discussing, please remember that the regions in red above normally have no ice in September. They don’t figure in to the summer minimum.
Roger Knights says:
June 17, 2010 at 1:20 am
Perhaps it is better to keep betting out. Some may be shrewd but still subject to the law of averages. Good try though, the 43% that is, but it’s bound to muddy the waters for some. If that was the purpose, yes it works for some.
Smokey says:
June 17, 2010 at 5:22 pm
Nightvid Cole,
You talk about “cherry picking,” then you only post an Arctic reference.
————————
Don’t use the Antarctic as a diversion or excuse. In all aspects they are poles apart. The Arctic Ocean is surrounded by land, the Antarctic by oceans. The dynamics are different. If you want to discuss Antarctica call for a thread, avoiding references or comparisons with to the arctic; any direct relationship is tenuous and they are not sharing ice.
Smokey says:
June 17, 2010 at 5:39 am
CO2 says:
June 16, 2010 at 11:17 pm:
If independent replications were not possible, then what is the basis for the vanishing?
You said; “I and others downgraded CO2=CAGW from a hypothesis to a conjecture, which is what it is, by definition. And we pointed it out many moons ago, and repeatedly, not just in this thread. You’re new here, but you can check the archives. Absent falsifiability, refutability, or testability, CO2=CAGW is nothing but a non-scientific scare tactic.”
As for commenting, yes I’m new but I read a number of blogs from both sides of the argument. So you and others downgraded the hypothesis, so what makes that valid?
On pseudo science you said; “OK. For examples of pseudo-scientific opinion, I give you: RealClimate, DeSmogBlog, climate progress, tamino, etc. And any other source that still believes the repeatedly debunked idea that a tiny trace gas controls the Earth’s climate, and will bring about runaway global warming and climate catastrophe. The real world disagrees; who are you going to believe?
That’s not telling me what you understand pseudu science is. You state that all those opposing your view offer pseudo science, regardless of whether they are scientists or not. I am not about to start debating CO2 ‘the tiny trace gas’ with you, I don’t believe in preaching to the converted. If this is what you believe, no one is going to change your mind. Not even Mother Nature because whatever happens, it will all have happened before; if not hundreds, then thousands of years ago and failing that millions of years ago.
Then you say; “Perhaps — if the lay person’s opinion is independent, and not bought and paid for by organizations with a CAGW agenda. If you haven’t noticed, climate science has been corrupted by money.”
Does that apply to both sides of the argument?
Your final question;
“I’ve answered your questions. Now please answer just one of mine: what’s your favorite alarmist blog? You know, the one you came here from?”
In fact, until recently I have not commented on any blog whatsoever. I read a lot of scientific papers from both sides of the argument. I am saddened by the fact that science has become politicized and disturbed by allegations of a global conspiracy. I ask myself if someone like Lord Christopher Moncton has reached the point of emberrassment for even the global skeptics. His recent diatribe about arctic sea ice almost made me blush.
This writing which you cite by Tim Ball (who is known for using repeatedly re-debunked climate ~SNIP~ myths such as the claim that the lag of CO2 behind temperature in ice core data somehow falsifies AGW theory) is not a scientific writing. It is published in a policy context, not a scientific journal.
CO2:
I just knew you would dodge my one and only question.
NC:
As I explained along with a solid reference, AGW is not a “theory,” and CO2=CAGW — the real debate — is nothing but an unsupportable conjecture designed to wring more money out of taxpayers by using false alarmism. Words matter, and mis-using words is typical of the warmist crowd.
And by all means, let us know when you’ve learned as much as Dr Tim Ball.
K? Thx bye.