UPDATE 4/23 4PM: I’ve been in contact with the Eureka Weather Station manager, and despite the incredible nature of the temperature jumps that are outside of normal experiences, such as July 14 2009, they do appear to be real. The METAR coding errors are another issue. I have many pictures now, plus a plan map, and a better meteorological insight than what can be gained from the meager online metadata. I’ll have an updated post later tonight or tomorrow – Anthony
Ecotretas find more cases of missing “M”s and mangled data in METAR reports making it into climatic temperature data. I’ve reposted his findings below and added some of my own notes [in brackets] to strengthen his findings. This time it’s Eureka, Nunavut, Canada. From “Up Here” magazine:
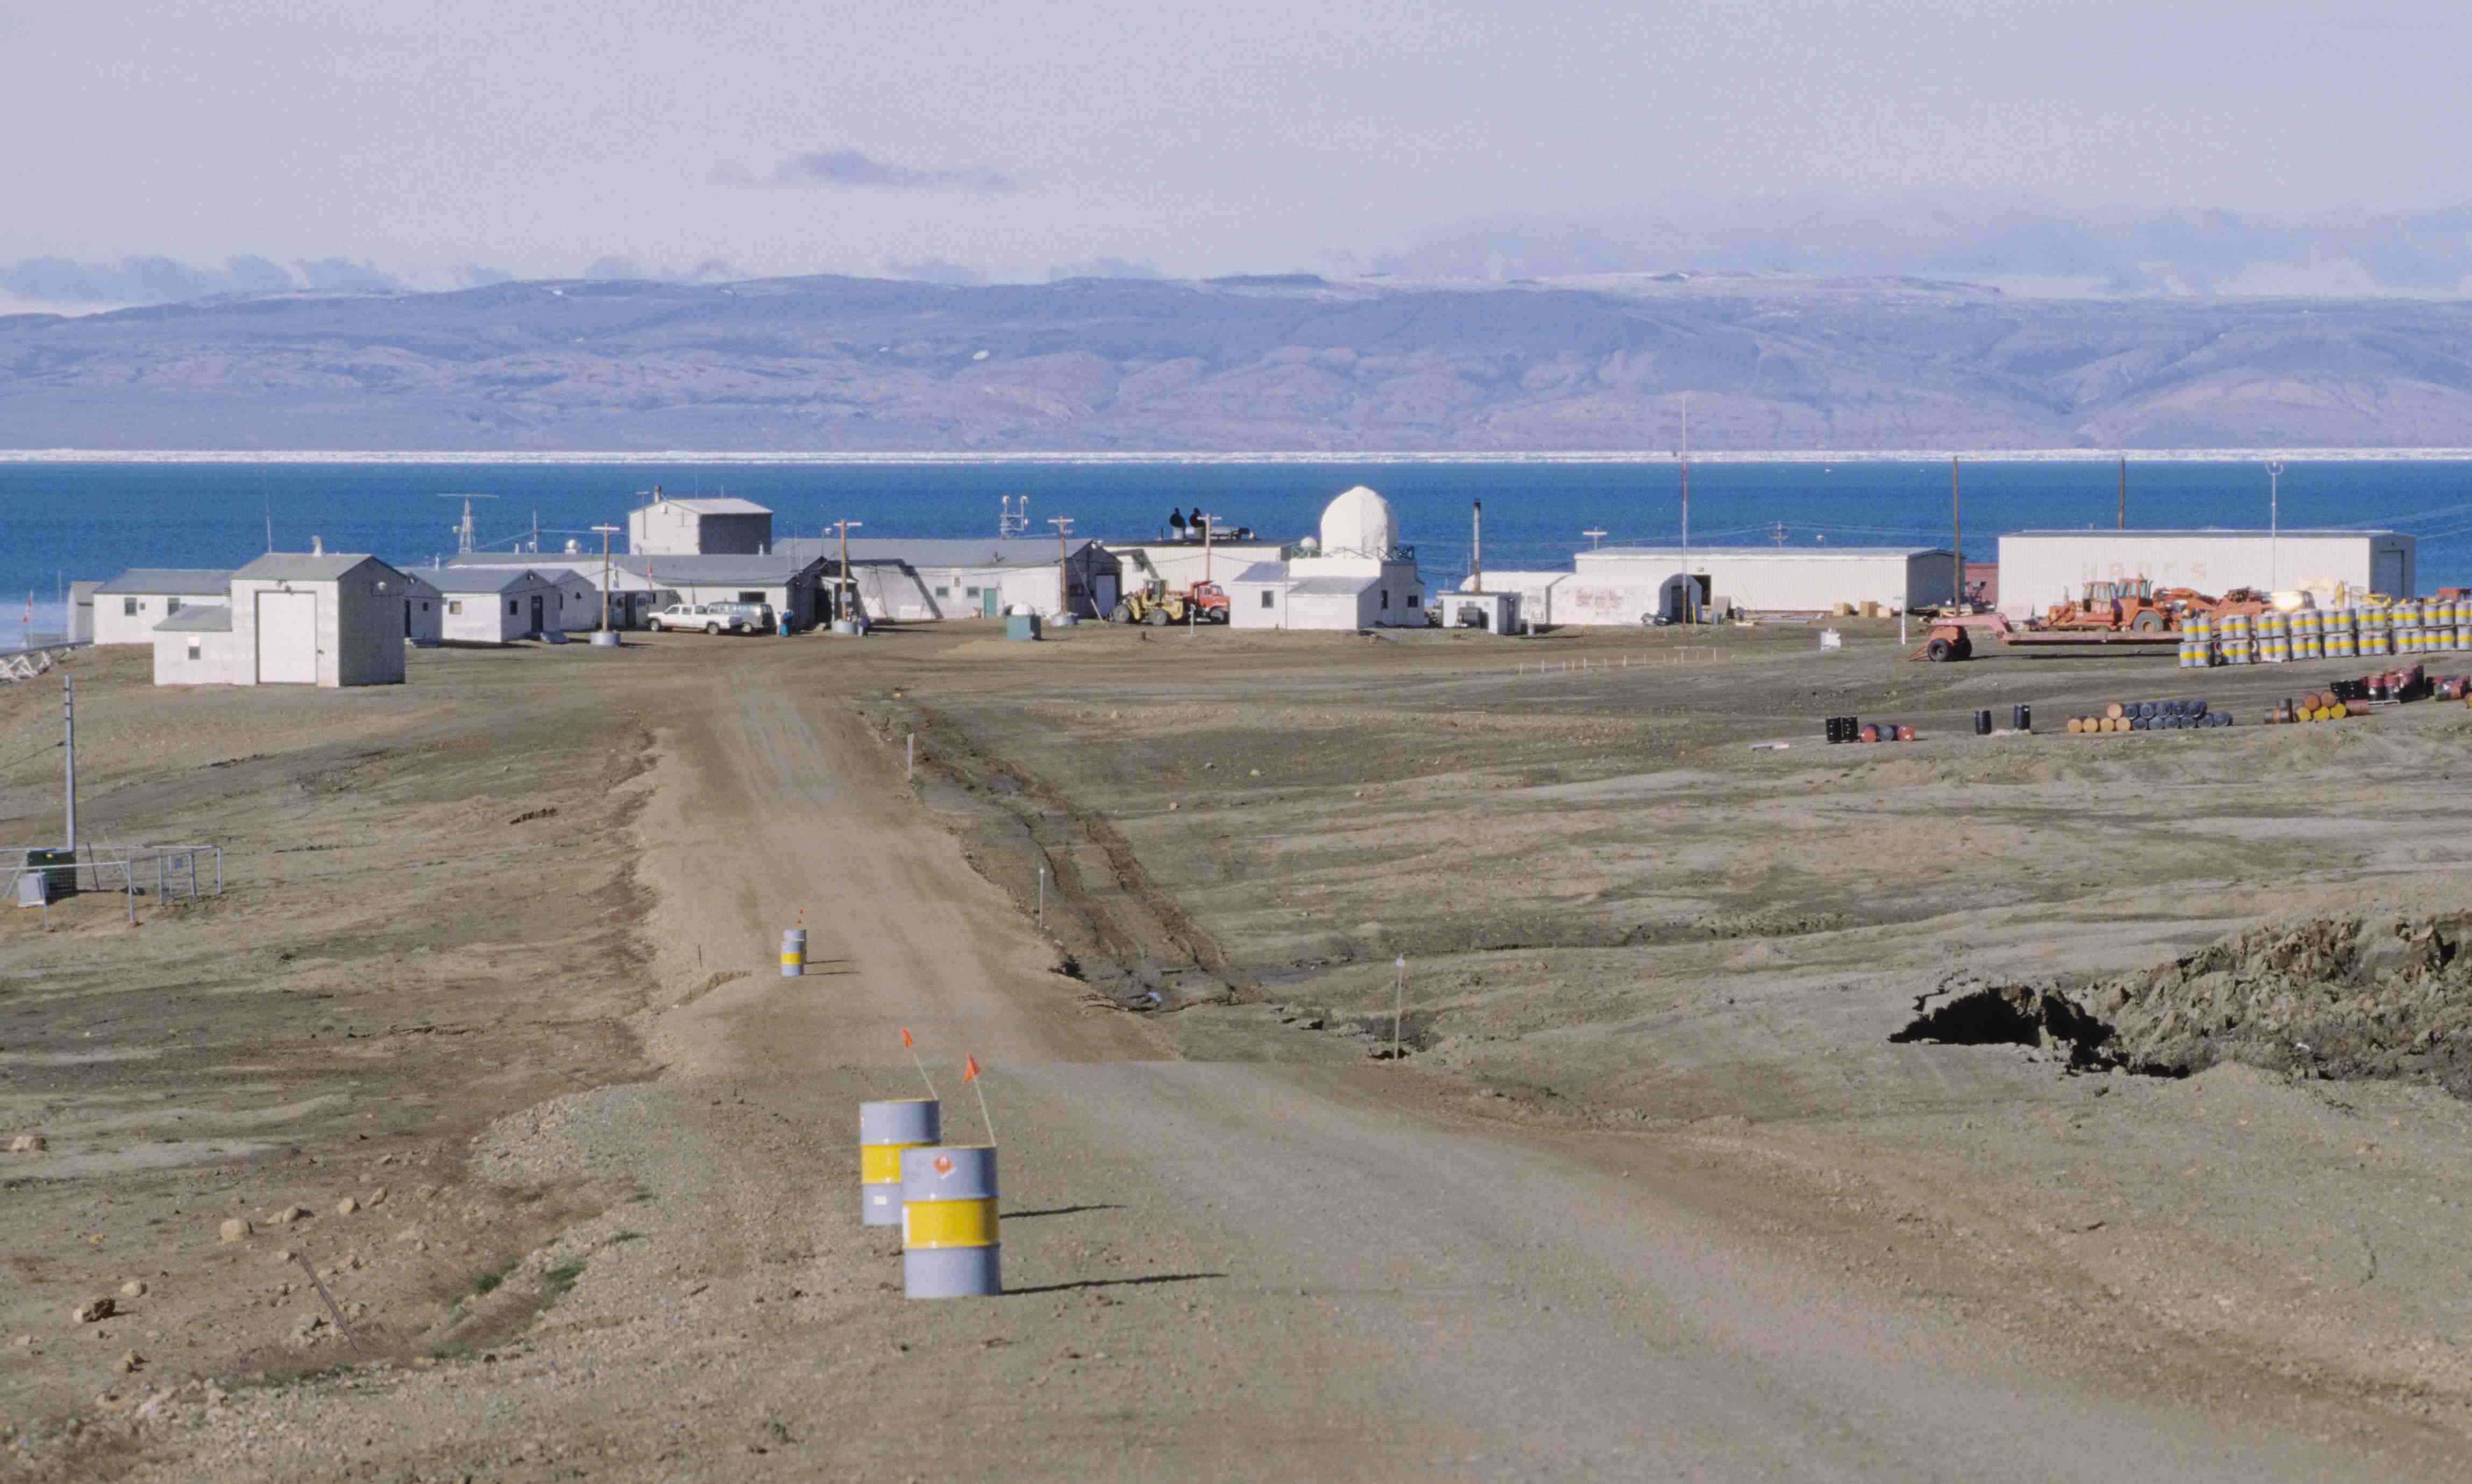
The first High Arctic Weather Station in history, Eureka was established in April 1947 at 80-degrees north latitude in the vicinity of two rivers, which provided fresh water to the six-man United States Army Air Force team that parachuted in. They erected Jamesway huts to shelter themselves and their equipment until August, when an icebreaker reached Eureka – as it has every year since – and brought permanent buildings and supplies. For decades after that, small, all-male crews would hunker down for entire winters, going a little stir-crazy from the isolation.

As I pointed out last Saturday there’s a common reporting flaw in world meteorological stations that use the METAR weather data format to report their hourly temperatures. Just one bad report in a cold location in the Arctic or Antarctic is enough to throw off the whole month’s worth of data when averaged. And it is monthly data that is used for climate. The all time high temperature error identified below has found it’s way into Wikipedia as “factual” when it is clearly wrong.
Some METAR and other kinds of unidentified errors also seem to be finding their way into official Environment Canada data. I’ve made screencaps. Given the importance of this weather station as the last surviving GHCN station that far north, also used in GISS, you’d think better quality control would be done, particularly when EC has a statement about data quality on each data page. What has been found seems to point to a corrupted dataset there.
– Anthony
=======================================
Eureka by Ecotretas


[Images above from GISS – click to enlarge]
Eureka, in Nunavut Canada, is a very special meteorological station. As can be seen in the first image above, it is responsible for the very big stripe on the very top of Canada. As can be seen on the second image, the data from only one station is responsible for a very big percentage of global temperatures… Both graphs can be obtained here.
So, one would imagine that data for this station is quality proof. We found two sources for temperature data: at Weather Underground and at the National Climate Data and Information Archive.
The first interesting data about this station is its record high temperature, which according to Wikipedia was reached on July 14, 2009, with 20ºC. [image below added by Anthony]

[UPDATE: Wikipedia editor removed the sentence above within 8 hours of this posting. See discussion here]
On Weather Underground, the monthly page for that day does say that 20ºC was the maximum temperature. But when you check the METAR data, the maximum temperature was 14ºC.
[Here is where it really gets strange, I’ve added two screencaps from Environment Canada, on for the monthly data, another for the daily data from July 14th, 2009. They don’t match! The 20.9C value never appears in the July 14th hourly data. Click images below to enlarge, EC’s July 2009 Monthly report on the left, July 14th, 2009 daily/hourly data on the right. Perhaps EC corrected the error in the daily/hourly data, but missed the monthly? – Anthony]


[click images above to enlarge]
[It also shows up as 20.9C on the EC yearly report for 2009, shown below]

Checking the Environment Canada page, the maximum for the date was 14.4ºC.
Things were different on the day before, July 13th. Maximum temperature for Weather Underground was also 20ºC, while at Environment Canada was 19.6ºC. But if you check the graphs below, some special heat occurred at 10PM, when temperatures soared some 15ºC!
(click images to enlarge)


[Image below added by Anthony. Here is the METAR report for Eureka, via Weather Underground, the error is highlighted in yellow, note the jump in temperature followed by a fall the next hour]

[In the image below added by Anthony, note the implausible temperature jump in the Environment Canada data for July 13th, 2009 at 22:00 where it was 5.9C at 21:00, jumping to 19.6C at 22:00, then back down to 4.1C at 23:00. Looking at the weather conditions of clear sky and moderate sustained winds from the North ~ 24 km/hr, there does not appear to be a meteorological explanation. Looking at the METAR data above, it appears the temperature was rounded up by the observer to 20C from 19.6. This makes me wonder if the event could be caused by something like a plane, truck, or snow-cat parked briefly near the sensor. In the Arctic, vehicles are left to idle, as turning them off allows them to freeze up, sometimes never to be restarted. ]

As Anthony Watts pointed out at Watts Up With That, the Eureka station registered the biggest rise in temperature probably seen on the Earth’s surface: 86ºC in one hour, on March 3, 2007! Now this data is available on Weather Underground, but seems not to exist in Environment Canada. The graph differences are clear below:


But that seems not to be the case in other examples. Take January 1st, 2007, for instance. Both Weather Underground and Environment Canada agree: there was a mighty spike at noon. Seems like the “M” problem affects both:


[Here’s the METAR data with the missing “M”, note at 11AM the M reappears]

There are times where differences are not so big, but the “M” problem is still there. Check the images from Weather Underground and Environment Canada for September 26, 2006:


Other times, changes are so significant, that something must be wrong. Check out the temperature rise on June 20, 2005. On the left, the weekly graph from Weather Underground shows a great surge in temperatures, confirmed by the Environment Canada graph for the day.


=====================================
Thanks to Ecotretas for his sleuthing, I’m sure there are many more like this yet to be discovered. It seems with Eureka, more is going on than METAR errors. The temperature rises reported seem impossible given the meteorological conditions, and because they seem to be automated, suggest sensor error or perhaps sensor environment contamination (like a vehicle or other heat source). If you look at this 1997 image from Wikipedia (and click it to get the super hi-res version and pan around) you’ll see a number of vehicles near buildings. Where is the temperature sensor? – I don’t know, but if someone can find out it might shed some light on this mystery.
The fact that the obvious error on July 14th is now cited in Wikipedia as an “all time record high”, when it doesn’t appear in the EC hourly data, is troubling. – Anthony
Discover more from Watts Up With That?
Subscribe to get the latest posts sent to your email.
data stops at 2008
http://arctic.atmos.uiuc.edu/cryosphere/IMAGES/seasonal.extent.1900-2007.jpg
ZT (16:03:30) :
Mysteries of modern climatological ‘science’.
1. Mistakes are always found by non-climatologists.
2. Mistakes are found to have been erroneously increasing the temperature.
3. People who find the mistakes are reviled by climatologists.
But don’t forget – the ‘science’ is settled
=============================================
Great !!!!!!!!!!!
@ur momisugly davidmhoffer, I disagree with the criticism of your 22:10 post. As a Canadian-American I immediately understood your point. My American half still thinks 19.6 degrees is bloody cold whilst the Canadian is still amused. Brilliant!
@ur momisugly Dr A Burns (18:00:06) : “A chinook perhaps ?”
Speaking only from personal experience, I have never experienced a Chinook that lasted 2 hours or less. I also have never experienced a Chinook in the summer. Having lived in southern and northern Alberta, my understanding of the Chinook wind is that is occurs because of air flow over the mountains from the Pacific. I am not sure Chinooks occur further north than Alberta/BC.
The best view of the Eureka station I’ve found (see Friday August 22). There are other nice shots of the far north, too:
http://www.zeco.com/upload/rep_ptb_2008-09-16_133549/GREL0801-log.pdf
Could this be the weather station? Look behind the red pickup on the right side of the picture. Hard to tell.
http://www.jproc.ca/rrp/alert_eureka_satdish.jpg
A case of nerd humor?
In one of the Intel commercials, a scientist changes a minus to a plus sign in a complicated formula written on the glass. Not exactly a knee-slapper, but, maybe that’s Canadian nerd humor, eh? (Snort)
Based on Anthony’s exposure of so many common errors in METAR (and no doubt other reporting codes) I think there are questions to be asked. Since I believe the best quality control starts early, I would ask (wherever the site):
1. What kind of training/experience are the “weather observers” and “weather equipment maintenance” folks required to have?
2. After being trained is there any apprenticeship that must be served under watchful eyes to be certified? Are there ‘national’ standards to meet?
3. Is management “technical” enough to understand and control this process?
4. Who does the certification?
5. How often is recertification required?
6. Is there any sort of ‘real time’ QC. If not, why not? If so, is it adequate?
7. What is the paper trail? Are “error logs” maintained? Are checklists used?
8. Are error summaries periodically posted at all sites under the blanket of higher management to foster competition, and are there awards for error free performance?
8. Does/can management deal with and correct error prone individuals?
9. Is training supplemented with periodic/updated refresher courses? Is this mandatory?
10. Where (at what level) IS the problem?
Basically, WHO is in charge and WHO is taking names and correcting the problems?
Ulric Lyons (06:03:42) :
http://www.tutiempo.net/en/Climate/Eureka/07-2009/719170.htm
Well spotted.
@ur momisugly Sean Peake (07:15:14) :
Let’s play “Eureka! Who can find the anomaly?”
I’ll start. July 2, 2005.
Here, how IPCC makes its report:
http://news.yahoo.com/s/ap/20100423/ap_on_he_me/us_med_psychedelic_therapy
REPLY: The only naturally occurring thing that would do that (that I can think of) would be a katabatic or downslope foehn/chinook type wind
http://en.wikipedia.org/wiki/Foehn_wind
http://en.wikipedia.org/wiki/Chinook_wind
But looking at the other meteorological data in the hours before and after there doesn’t appear to be evidence for it. – Anthony
IMHO I don’t think the terrain at Eureka can create katabatic or chinook winds ( experienced a mild former in Nachvak Fjord in Labrador, the latter outside of Banff, Alberta). Just a thought (no laughter, please): Could the spikes in temperature be the result of the low-lying Sun reflecting off the windows of the station and on to the Stevenson screens?
REPLY: I don’t think they use a Stevenson Screen there, but some sort of electronic sensor. That said, your theory is as plausible as any other. – A
Talk about screwed up data! What’s it gonna take!
I just translated a piece from German to English –
RUSSIAN SCIENTIST SAYS TO EXPECT COOLING!
…mentions US measuring stations…pols on wrong horse…
(You can click on my URL)
Is the thingy in the foreground of this photo an mmts?
http://acebox.uwaterloo.ca/eureka/Eureka2005/Mar_1/photos/photo15.htm
Or is it the lone Stevenson screen looking thing in the upper RH corner area, all by itself in this picture.
http://csailor.50webs.net/eureka/pic/eureka/pic112.html
At least this is the source of the anomalous heating!
http://csailor.50webs.net/eureka/pic/eureka/pic105.html
REPLY: Photo 15 is an interferometer. pic112 is at the military base nearby, not the weather station base. See http://csailor.50webs.net/eureka/pic/eureka/pic28.html -A
Kevin G (09:40:59) :
Let’s play “Eureka! Who can find the anomaly?”
I’ll start. July 2, 2005.
Oh, Oh, my turn, my turn… umm, let’s do one at random… July 15 2007: daily says Max 12.7, Min. 4.5, hourly says Max. 10.0 (16:00h), Min. 6.2 (18:00h)… brrrr, cooled off in a hurry, but just wait for an hour and it’ll go up 3+ degrees. (This is too easy… I must be doing something wrong!)
OK, your turn
We are a new Calgary climate skeptics group that keeps track of Canadian data fudging:
http://friendsofginandtonic.org/
REPLY: No, your are not skeptics. Why do you have to lie right off the bat? Another Hoggan DeSmogblog clone, and not even a good parody. -Anthony
HR (17:00:14) … What the heck is MS/MV Curtiss doing at 88,5 N in late April???
She was built in 1969…Another Manhattan Project??? (Icebreaking tanker Manhattan GWS…) But if that shiptracking site is good, we can track what all
the icebreakers are doing in the summer in the Arctic…Yamal BTW is just N of
Norway (?)
Having been the quality systems registrar for a half dozen federal agencies, I was not at all surprised by these findings.
Environment Canada has substantially dismantled their surface station system over the past decade which means fewer data points, more anomalous impact. Compound apparent data quality issues and further corrupt the record….
Unfortunately, root cause analysis and effective, verifiable corrective action will only commence once “top management” identifies a negative trend that affects the bottom line.
Although Canadian citizens are technically MSC’s paying customers, and this post triggered a “customer complaint”, I don’t expect to be in receipt of a non-conformance report any time soon.
Anthony, here’s what’s Wikipedia says now:
“I re-inserted the deleted statement. The claim is readily verifiable by Environment Canada and the actual METAR obs show a high of 20.9C. The website expressing concerns about its strongly opposed to climate science and thus cannot be used as a source of controversy without violating Wikipedia’s overarching goals at achieving a neutral point of view in its articles. The claim itself does not strike me as “obviously wrong”; the station in question is adjacent to the Arctic Ocean. Small changes in wind direction can lead to large temperature changes in the summer. A quick glance at some other days shows that the temperatures frequently oscillate with even minute changes in wind direction. There is no evidence of any temperature sensor malfunction. 72.240.53.216 (talk) 15:58, 23 April 2010 (UTC)”
This thread just keeps getting better!
You could always call the Environment Canada hotline @ur momisugly $2.99 per minute and ask what’s up!
A lesson on trying to extract very simple information from Canadian government agencies — here’s a representative example of how it can go:
Weeks ago, I wrote:
“ALPI (Aleutian Low Pressure Index) data/info was formerly located here:
http://www.pac.dfo-mpo.gc.ca/sci/sa-mfpd/downloads/indices/alpi.txt
Please indicate where it has moved.”
From the response:
“Thank you for your email […] requesting information […] Unfortunately, since our service only offers basic information […] we cannot provide the information you requested. We have, however, forwarded your request to a representative who will assist you further.”
So I waited patiently for weeks and wrote back:
“I’m still waiting for the link to the new webpage.”
From the response:
“Thank you for your email […] requesting information […] Unfortunately, since our service only offers basic information […] we cannot provide the information you requested. We have, however re-forwarded your request to a representative who will assist you further.”
Charming. Very helpful. Note that they took the trouble of adding “re-” (“re-forwarded”).
mpaul (09:12:23) :
Could this be the weather station? Look behind the red pickup on the right side of the picture. Hard to tell.
When i was up there in 79-80, DND was doing some experiements with Satelite communications(note the almost horizontal angle of the dishes). This location I believe is to the east of Eureka where they were doing the communications links to Alert. At that time no temp censors were there.
Tim Clark (09:47:16) :
Or is it the lone Stevenson screen looking thing in the upper RH corner area, all by itself in this picture.
Picture didn’t load for me sorry, but the alchol/mercury thermometers were next to the Radom building. it was away from most builds on a slight rise from the rest of the roads (3 white objects in some pictures i’ve see).
Perhaps someone who as been there more recently can update us.
I did talk to a former co-worker from Env Canada about a year ago and they (Env Canada) still do the hourlys (but perhaps they have shut down those early hour obs now).
Gentleman, I will send an e-mail to my former co-worker, who still works for Environment Canada, he may be able to shed some light on that temperture sensor is located.
Might be a few days before i get an answer, but i can post here or on tips sections.
lance
Just for fun, I had a look at the month of July and compared what appears to be the two stretches of “warm days” ( July 13-15 and July 20-22) to the daily records.
As you pointed out Anthony, there are questions with July 13th and 14th. Additionally the monthly record indicates the high on July 15th as 15.7. The daily record shows a high temperature on the 15th of 14.2 at 700hrs. 000hrs and 100hrs are missing.
I encountered discrepancy July 20-22 as well when the monthly record indicates high temperatures of 16.4, 15, and 17.1 respectively, the daily records are as follows: July 20th 16.1 at 1500hrs, 21st 13.5 at 2300hrs, and 22nd 16.6 at 1500hrs.
Data from 000hrs and 100hrs is missing from all of these dates.
Re: intrepid_wanders (20:00:09)
I am sorry, but “M-gate” does not appear to be popular enough. Perhaps because an M-gate could lead to an M-path. I feel your pain.