UPDATE 4/23 4PM: I’ve been in contact with the Eureka Weather Station manager, and despite the incredible nature of the temperature jumps that are outside of normal experiences, such as July 14 2009, they do appear to be real. The METAR coding errors are another issue. I have many pictures now, plus a plan map, and a better meteorological insight than what can be gained from the meager online metadata. I’ll have an updated post later tonight or tomorrow – Anthony
Ecotretas find more cases of missing “M”s and mangled data in METAR reports making it into climatic temperature data. I’ve reposted his findings below and added some of my own notes [in brackets] to strengthen his findings. This time it’s Eureka, Nunavut, Canada. From “Up Here” magazine:
The first High Arctic Weather Station in history, Eureka was established in April 1947 at 80-degrees north latitude in the vicinity of two rivers, which provided fresh water to the six-man United States Army Air Force team that parachuted in. They erected Jamesway huts to shelter themselves and their equipment until August, when an icebreaker reached Eureka – as it has every year since – and brought permanent buildings and supplies. For decades after that, small, all-male crews would hunker down for entire winters, going a little stir-crazy from the isolation.

As I pointed out last Saturday there’s a common reporting flaw in world meteorological stations that use the METAR weather data format to report their hourly temperatures. Just one bad report in a cold location in the Arctic or Antarctic is enough to throw off the whole month’s worth of data when averaged. And it is monthly data that is used for climate. The all time high temperature error identified below has found it’s way into Wikipedia as “factual” when it is clearly wrong.
Some METAR and other kinds of unidentified errors also seem to be finding their way into official Environment Canada data. I’ve made screencaps. Given the importance of this weather station as the last surviving GHCN station that far north, also used in GISS, you’d think better quality control would be done, particularly when EC has a statement about data quality on each data page. What has been found seems to point to a corrupted dataset there.
– Anthony
=======================================
Eureka by Ecotretas


[Images above from GISS – click to enlarge]
Eureka, in Nunavut Canada, is a very special meteorological station. As can be seen in the first image above, it is responsible for the very big stripe on the very top of Canada. As can be seen on the second image, the data from only one station is responsible for a very big percentage of global temperatures… Both graphs can be obtained here.
So, one would imagine that data for this station is quality proof. We found two sources for temperature data: at Weather Underground and at the National Climate Data and Information Archive.
The first interesting data about this station is its record high temperature, which according to Wikipedia was reached on July 14, 2009, with 20ºC. [image below added by Anthony]

[UPDATE: Wikipedia editor removed the sentence above within 8 hours of this posting. See discussion here]
On Weather Underground, the monthly page for that day does say that 20ºC was the maximum temperature. But when you check the METAR data, the maximum temperature was 14ºC.
[Here is where it really gets strange, I’ve added two screencaps from Environment Canada, on for the monthly data, another for the daily data from July 14th, 2009. They don’t match! The 20.9C value never appears in the July 14th hourly data. Click images below to enlarge, EC’s July 2009 Monthly report on the left, July 14th, 2009 daily/hourly data on the right. Perhaps EC corrected the error in the daily/hourly data, but missed the monthly? – Anthony]


[click images above to enlarge]
[It also shows up as 20.9C on the EC yearly report for 2009, shown below]

Checking the Environment Canada page, the maximum for the date was 14.4ºC.
Things were different on the day before, July 13th. Maximum temperature for Weather Underground was also 20ºC, while at Environment Canada was 19.6ºC. But if you check the graphs below, some special heat occurred at 10PM, when temperatures soared some 15ºC!
(click images to enlarge)


[Image below added by Anthony. Here is the METAR report for Eureka, via Weather Underground, the error is highlighted in yellow, note the jump in temperature followed by a fall the next hour]

[In the image below added by Anthony, note the implausible temperature jump in the Environment Canada data for July 13th, 2009 at 22:00 where it was 5.9C at 21:00, jumping to 19.6C at 22:00, then back down to 4.1C at 23:00. Looking at the weather conditions of clear sky and moderate sustained winds from the North ~ 24 km/hr, there does not appear to be a meteorological explanation. Looking at the METAR data above, it appears the temperature was rounded up by the observer to 20C from 19.6. This makes me wonder if the event could be caused by something like a plane, truck, or snow-cat parked briefly near the sensor. In the Arctic, vehicles are left to idle, as turning them off allows them to freeze up, sometimes never to be restarted. ]

As Anthony Watts pointed out at Watts Up With That, the Eureka station registered the biggest rise in temperature probably seen on the Earth’s surface: 86ºC in one hour, on March 3, 2007! Now this data is available on Weather Underground, but seems not to exist in Environment Canada. The graph differences are clear below:


But that seems not to be the case in other examples. Take January 1st, 2007, for instance. Both Weather Underground and Environment Canada agree: there was a mighty spike at noon. Seems like the “M” problem affects both:


[Here’s the METAR data with the missing “M”, note at 11AM the M reappears]

There are times where differences are not so big, but the “M” problem is still there. Check the images from Weather Underground and Environment Canada for September 26, 2006:


Other times, changes are so significant, that something must be wrong. Check out the temperature rise on June 20, 2005. On the left, the weekly graph from Weather Underground shows a great surge in temperatures, confirmed by the Environment Canada graph for the day.


=====================================
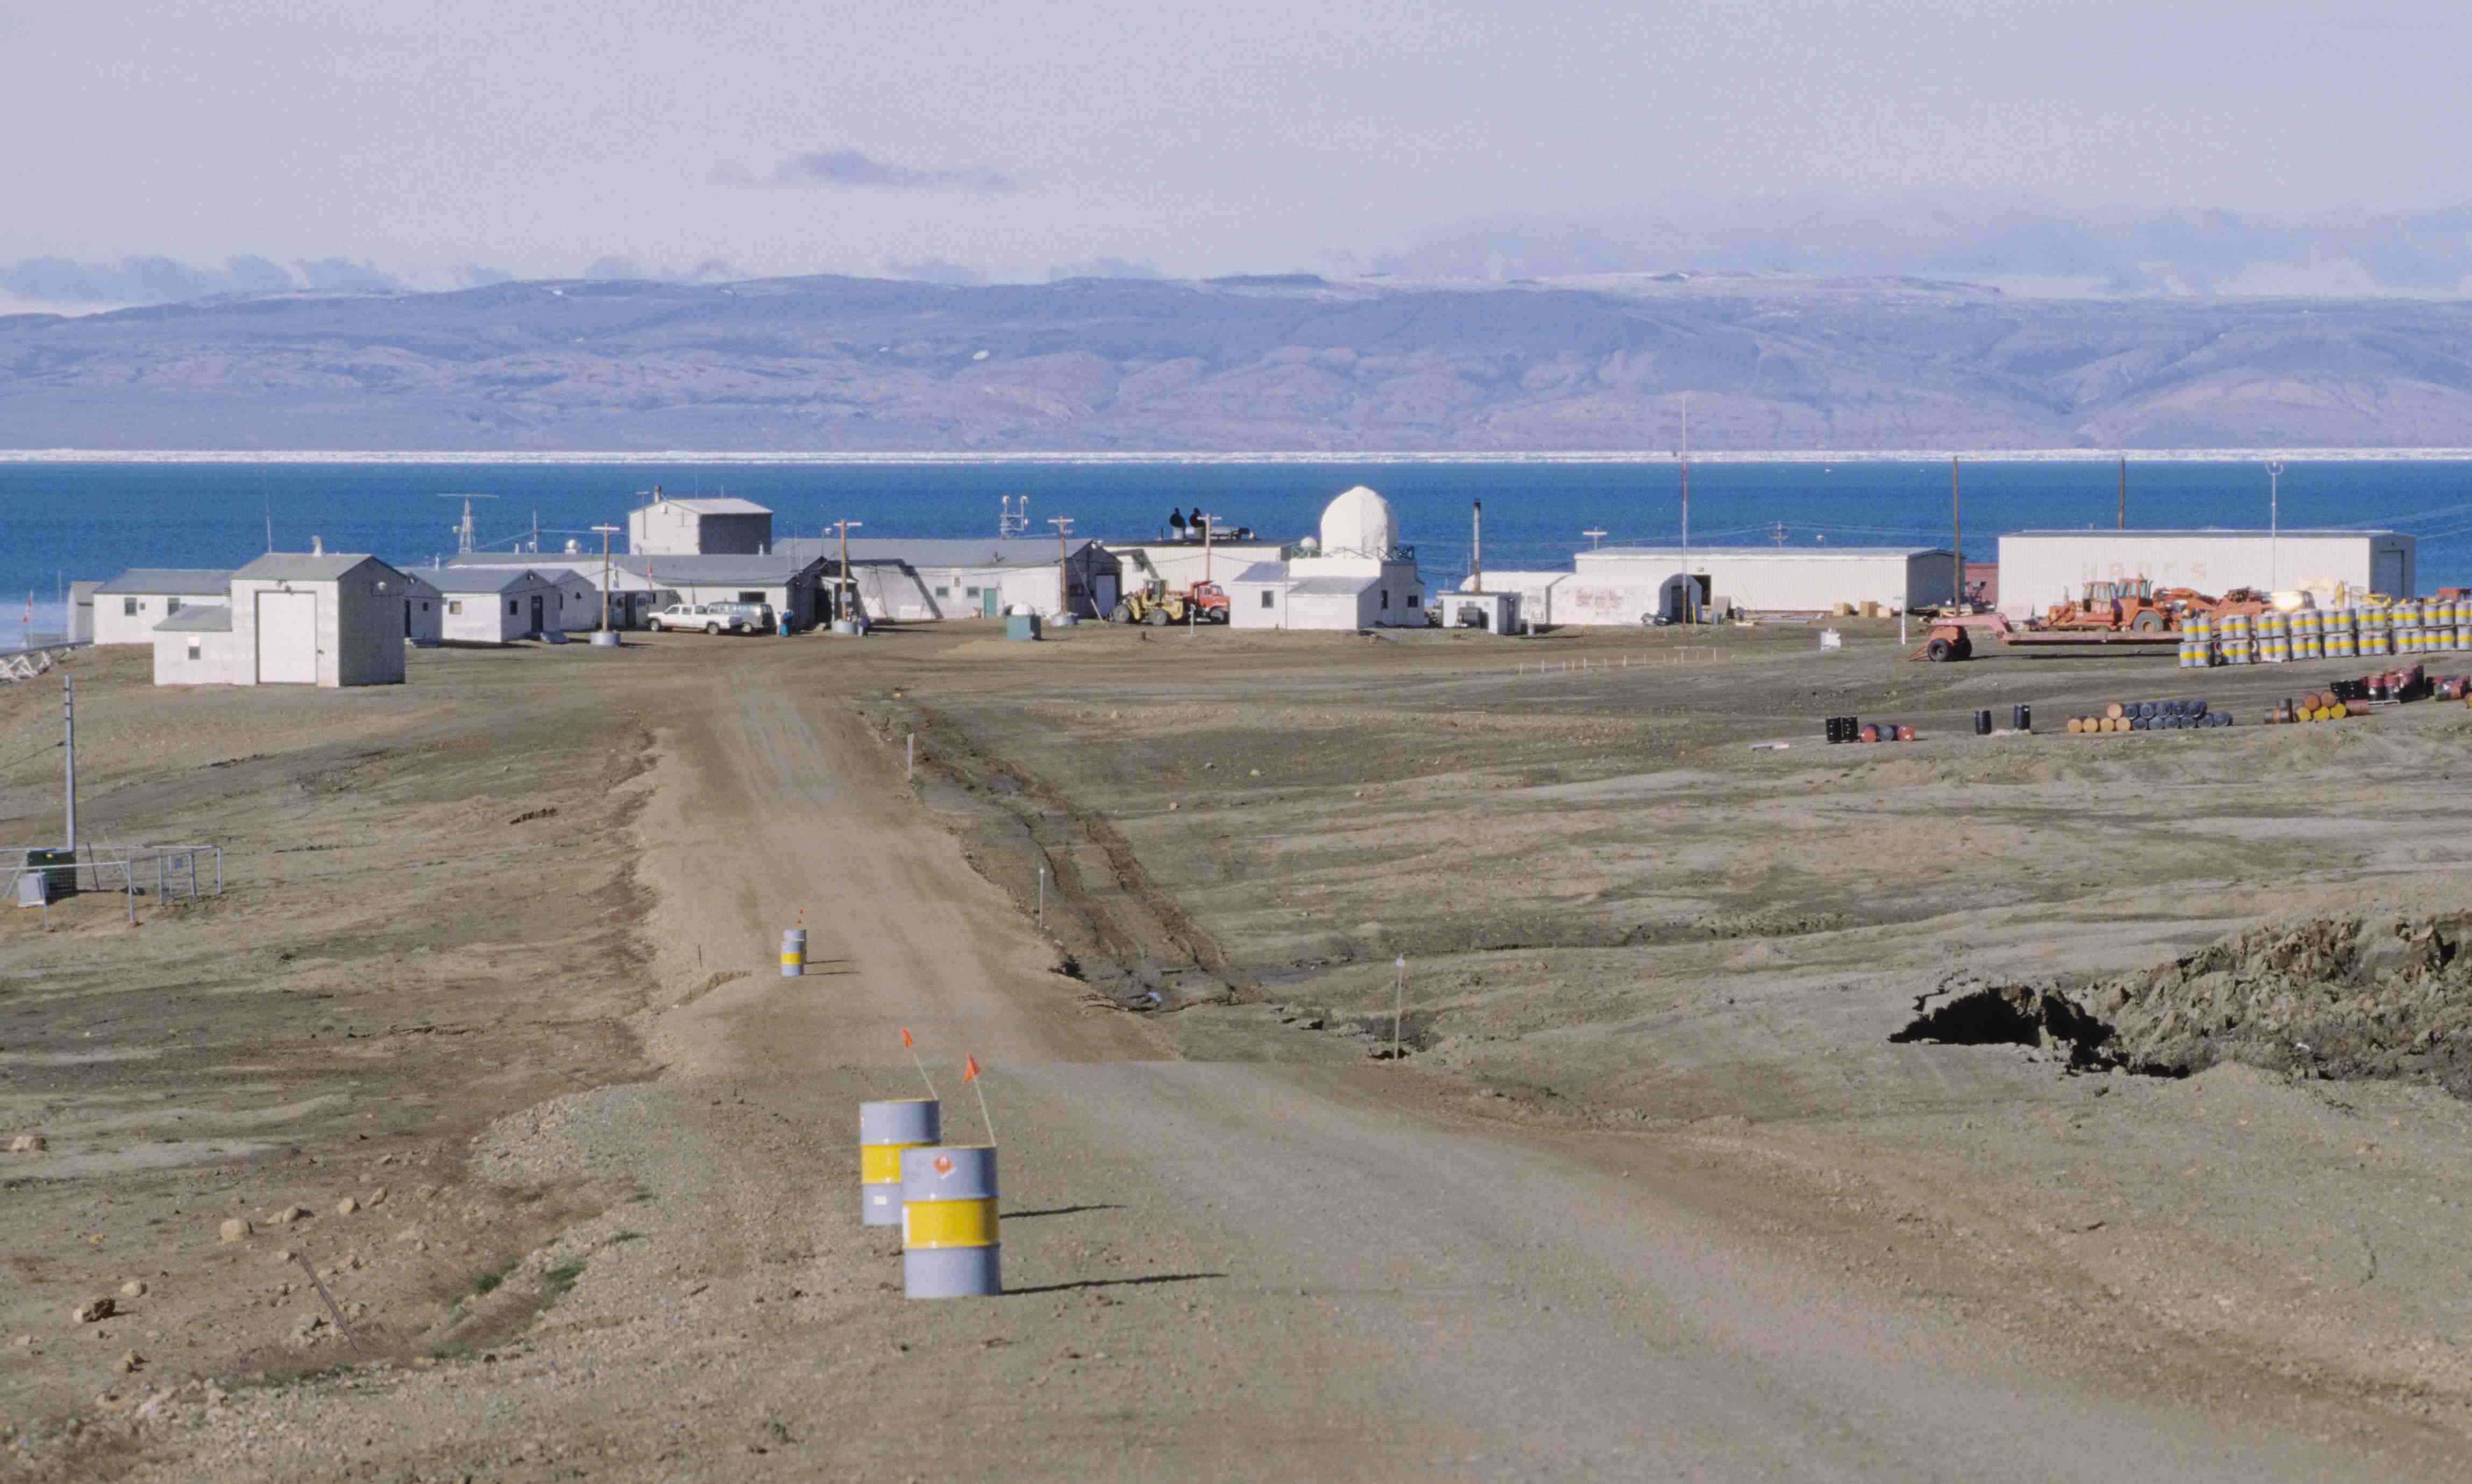
Thanks to Ecotretas for his sleuthing, I’m sure there are many more like this yet to be discovered. It seems with Eureka, more is going on than METAR errors. The temperature rises reported seem impossible given the meteorological conditions, and because they seem to be automated, suggest sensor error or perhaps sensor environment contamination (like a vehicle or other heat source). If you look at this 1997 image from Wikipedia (and click it to get the super hi-res version and pan around) you’ll see a number of vehicles near buildings. Where is the temperature sensor? – I don’t know, but if someone can find out it might shed some light on this mystery.
The fact that the obvious error on July 14th is now cited in Wikipedia as an “all time record high”, when it doesn’t appear in the EC hourly data, is troubling. – Anthony
Discover more from Watts Up With That?
Subscribe to get the latest posts sent to your email.
Some eureka images: http://www.flickr.com/photos/78042080@N00/332142726/
Weather station/post offfice in spring (not too revealing): http://www.flickr.com/photos/78042080@N00/332142726/
Weather station/post office in summer: http://xpda.com/arctic04/PICT7836.jpg
(taken from: http://xpda.com/arctic04/eureka.htm)
And another: http://xpda.com/arctic04/PICT7627.jpg
(taken from: http://xpda.com/arctic04/eureka.htm)
In Popular Mechanics (http://www.popularmechanics.com/technology/engineering/4213353) is:
“Eureka weather station, population 8. Musk oxen graze near the 60-year-old outpost, staffed year-round by a federal department called Environment Canada. Temperatures here can drop to minus 58 F, so it seems appropriate that building doors are insulated like walk-in freezers.”
“After unloading cargo, the crew unfurls 1200 ft. of floating hose so that fuel can be pumped to the weather station’s tanks. I hop in the brand-new Ford F350 pickup truck just delivered to University of Toronto physicist Pierre Fogal. He manages the neighboring Polar Environment Atmospheric Research Laboratory (PEARL), run by researchers in the Canadian Network for the Detection of Atmospheric Change. To reach the lab, we follow what is perhaps the world’s longest extension cord 9 miles up a dirt road. “To keep the air as clean as possible we get our power from Eureka so we don’t have to run a generator up here,” Fogal says.”
Then: “As part of the International Polar Year, a worldwide research blitz that began on March 1, PEARL will be a critical source of data for scientists trying to understand how the Arctic interacts with the global climate system. “We expect that the initial signs of climate change, which we are probably already seeing, will be visible in the Arctic and Antarctic because they are pristine en-vironments,” Fogal says. In 2005, Ellesmere Island experienced its warmest summer since 1960; numerous landslides rippled across the thawing permafrost. As we return to the ship, Fogal points out several places where the permafrost has melted beneath steep tundra slopes, causing it to slide down in muddy waves. ”
The records for 2005: http://climate.weatheroffice.gc.ca/climateData/monthlydata_e.html?Prov=XX&timeframe=3&StationID=1750&Month=1&Day=1&Year=2005&cmdB1=Go
Perhaps there is some explanation why temps seems to rise in the evening (while the sun is still up) during some months?
Something else odd in the Eureka records. The first two hours of each day is missing. The middle of the night. Looks like nobody’s assigned to do this at midnight and 1 AM.
Is this a climate station? It has some of the cold data missing.
I vote for EUREKAGATE! I would only add — “temperature data quality is not fit for ANY purpose” — except lying.
“Tenuc (00:53:31) :
Pamela Gray (19:26:34)
“I can’t think of a [ ]-gate term that is clever. We seem to be out of clever [ ]-gate terminology. And that speaks volumes.”
Easy – Eurekagate. The day the World realised that temperature data quality is not fit for purpose, as anomalies are within the error-bars of normal (whatever that may mean)!”
For anyone interested in seeing the GHCN data for Eureka; I’ve made a set of graphs. There are temperatures (by month), monthly anomalies, and the running total of the monthly anomalies (that ought to be the most accurate picture of change over time).
http://chiefio.wordpress.com/2010/04/23/eureka-canada-graphs/
You can easily pick out a ‘time of troubles’ or two in the data as things were very volatile or dropped. There is also a clear pattern of the “warming” being in Sept-Dec and the other months being more nearly flat (or in some cases falling…)
Lets see, what happens in Sept-Dec…. Oh yeah, winter comes and the “new guy” needs to learn to put an M in the report for “Minus”… and runs the heaters a lot since the fuel bunker is full and he feels cold…
Is there a reason why the July monthly min temps don’t match the dailies?
What makes reports like this one so tiresome is that no one is listening and the political/economic train wreck just keeps piling up.
If I can get some help from the cognoscente on this list, I’ll draft another petition to EPA to demand a review of the data. I would need help documenting how the known errors in the temperature records, which would allow the petition to argue that these errors have corrupted the temperature record to such a degree that it cannot withstand the required data quality review necessary upon which to ground a regulation under U.S. laws.
Contact me off-line at dwschnare@gmail.com
The fact that there are so many nefarious entries in the temperature record that is used to support AGW is, at best bad, science; the refusal by the relevant authorities to investigate, acknowledge and correct the faulty data is criminal
Climate scientist sues newspaper for ‘poisoning’ global warming debate
Climate modeller Andrew Weaver launches libel action in Canada for publishing ‘grossly irresponsible falsehoods’
http://www.guardian.co.uk/environment/2010/apr/22/climate-change-libel-action-canada-national-post
McConchie Law Corporation, acting for Weaver, said that the National Post articles had “gone viral on the internet” and were reproduced on dozens of other websites, including prominent climate-sceptic sites Climate Audit and Watts Up With That.
The modeling science the AGW criminal cabal likes to use are centered around “anomalies”. If these shysters are asking us to believe they are unable to catch these very obvious data entry anomalies in the front end of their data then they can kiss my foot!
Here’s the next thing the scaremongers will want us to panic about:
http://www.alertnet.org/thenews/newsdesk/N22129903.htm
KPO (03:21:11) : Does that mean I should advise my tour group to unpack the beach towels, sunblock and scuba gear?
No. Sunblock is useful for nose sunburns when skiing. Beach Towels are great to wrap up in after you get the snow rinsed off in the shower. And I once used a wet suit to survive being stuck in a blizzard all night. Handy, that. (Though when I DID get to the ‘town’ the folks in the coffee shop looked at me a bit oddly 😉 Not every day a guy walk in wearing a full wet suit and parka…
FWIW, this:
http://upload.wikimedia.org/wikipedia/commons/8/8f/Astro-Lab_%2804-08-97.jpg
is claimed to be the: Astro-Lab (Arctic Stratospheric Ozon Observatory) near Eureka Weather Station (Nunavut, Canada)
here:
http://en.wikipedia.org/wiki/File:Astro-Lab_(04-08-97.jpg
Yes, it says “near” the weather station… but… it has an anemometer on a mast on the roof… rather like the one seen on automated reporting stations in the Antarctic… Wonder what else is built on the roof so as not to be knocked down by a snow plough… This “new architecture” looks to be a box with stuff on the top. Not much on the ground… one hopes they didn’t put the thermometer on the roof.
I’m with Ed for the location:
Ed Caryl (16:18:20) :
Where is the thermometer? Look just to the left of the “low-boy” trailer. That white block looks like an intrument shelter. I think the building just to the left of the radome is the generator building.
Especially since the lo-boy has an attachment to be towed with a forklift. I’m willing to be with the placement of the lo-boy that the gauge is affected by the occasional placement of something with hot exhaust.
My best guess anyway.
Are the decades of METAR records available somewhere? The calculus of correcting this enormous data set would need another surfacestations volunteer army to do. Are the errors all on the warming side?
This sounds like an interesting community project — a bit like the surface station project. Volunteers could select specific stations and examine that station for METAR errors. Anthony, maybe you could setup a structure for this(?) The emphasis should be on the most northerly stations, I suspect.
It seems to me that the goal should be to characterize the frequency and magnitude of these errors in order to assess the impact on the temperature record.
Also, if you could show that the METAR error in Finland falsifies the NOAA claim that March was the warmest month ever, then I think that would be news worthy.
See what happens when just anybody can look at the data? Nothin’ but trubble… 🙂
“Faking versus adjusting” – why it is wise to sometimes hide “original” data by Reinhard Böhm (http://klimazwiebel.blogspot.com/2010/01/guest-contribution-from-reinhard-bohm.html)
These seem like obvious glitches and not representative of real temperatures.
I sure hope this is being brought to the attention of the people responsible for this data!
I offer one suggestion for determining the source of these errors; keep an hourly record of the fluid level in that bottle of Canadian Club they keep in the closet.
So what’s the truth then.
Even Anthony has stated he thinks the globe has warmed, yet stuff like this makes me question we can trust the data to come to that conclusion?
This Mgate-eurekagate problem could be very significant.
Has anyone challenged Gavin yet?
Sean Peake (07:15:14) :
Some eureka images: http://www.flickr.com/photos/78042080@N00/332142726/
Weather station/post offfice in spring (not too revealing): http://www.flickr.com/photos/78042080@N00/332142726/
______________________________________________________________________________
…not too revealing?? Actually the photo reveals an orange extension cord probably used to plug into the block heater of a vehicle. This means vehicles are parked in front of the P.O. I wish I could see exactly where they are taking the temp measurements.
Also thanks to the article you found the timing of personnel rotation can be left in as a possible reason for the weird temperature reading on July 13th. Supplies and personnel would probably be dropped off some time around the first couple of weeks in July.
“…Canadian coast guard’s six icebreakers, which spend the winter maintaining navigation channels in the St. Lawrence River and waters of the Atlantic provinces, head north in late June to activate navigation beacons for the Arctic shipping season. The ships remain there until freeze-up in late October, carrying out search-and-rescue operations, escorting icebound vessels, cleaning up oil and diesel spills and participating in scientific research….”
Thanks for the additional information.
____________________________________________________________________________
Barbee (07:14:13) :
What troubles me the most is peoples’ tendency to trust all things in technology, without the consideration that human error frequently renders the data erroneous…..
_____________________________________________________________________________
I certainly agree with you. A study on hospital testing revealed the old 80-20 rule applies. 20% of the tests was found to be incorrect. (sorry I do not have the links as the tests were done over 15 years ago) Nothing I have seen in my career as an industrial chemist has made me believe data is always correct. That is why good lab managers always check the data from their technicians.
E.M.Smith (03:24:52)
Perhaps they are burning ‘Jet A’ kerosene (a.k.a. JP8) which has a cloud point of circa -50F. ‘Jet A’ fuel is specifically designed for this type of environment and would minimize the chances of diesel fuel filter clogging etc.
They’re saying that the 14th of July was unusually warm? With 12kts of NORTHERLY wind blowing????
Give me a break!
I think R Spencer needs to clear this is up. Is the current UHA temp data based mainly on one extreme hot spot over Canada?
http://discover.itsc.uah.edu/amsutemps/execute.csh?amsutemps
because the rest of the world is not showing any warming at all!
See COLA. analysis of current conditions etc… climate
899 (04:42:16) : I agree with your findings and comments. I’ve just finished looking at numerous July records over the years from 1948 to 2009. Large rises and falls in temperature are recorded over a matter of a few hours. This is particulaly prevelant in the post-1970 years, although I also noted many occassions prior to 1970 when highs of 18degC and over are recorded.
Anthony: Is it possible for temperatures in the Arctic to rise and fall by +/- 5degC and more over a period of one or two hours in effectively static atmospheric conditions?
REPLY: The only naturally occurring thing that would do that (that I can think of) would be a katabatic or downslope foehn/chinook type wind
http://en.wikipedia.org/wiki/Foehn_wind
http://en.wikipedia.org/wiki/Chinook_wind
But looking at the other meteorological data in the hours before and after there doesn’t appear to be evidence for it. – Anthony
AnonyMoose (07:15:49) :
Something else odd in the Eureka records. The first two hours of each day is missing. The middle of the night. Looks like nobody’s assigned to do this at midnight and 1 AM.
Is this a climate station? It has some of the cold data missing.
________________________________________________________________________________
It would be interesting to find out if only 22 hrs worth of data was the norm through the entire data record or if it is a “new” habit.
E. M. Smith states at his blog
“The bulk of the ‘rise’ of the dT line comes after the 1990 changes of process, prior to that it’s a flat series with some volatility. All I see in this graph is some crappy data artifacts and some recent warming via process changes.”
Chiefio, do you have the hourly data? can you tell if they actually drop 2 hrs worth of data each day and when it began?
As you said: ” What has been found seems to point to a corrupted dataset there”….
The whole system is obviously corrupted and it would deserve not to pay it attention anymore, however your diligent and very patient work makes a great service to science and truth, though their lies, widely publicized by msm, and specially directed to simple working people, fulfill their political objectives.
Hans Erren (06:57:20) :
The relative humidity is a derived number
If on 13 july the temperature is set to 9.6 insted of 19.6 then the RH is 76 which is more inline. RH of 40 is bone dry.
Check this handy calculator (make sure to select Celsius!!):
http://einstein.atmos.colostate.edu/~mcnoldy/Humidity.html
Opps, didn’t notice the “Rel”