The Warning in the Stars
By David Archibald
If climate is not a random walk, then we can predict climate if we understand what drives it. The energy that stops the Earth from looking like Pluto comes from the Sun, and the level and type of that energy does change. So the Sun is a good place to start if we want to be able to predict climate. To put that into context, let’s look at what the Sun has done recently. This is a figure from “Century to millenial-scale temperature variations for the last two thousand years indicated from glacial geologic records of Southern Alaska” G.C.Wiles, D.J.Barclay, P.E.Calkin and T.V.Lowell 2007:
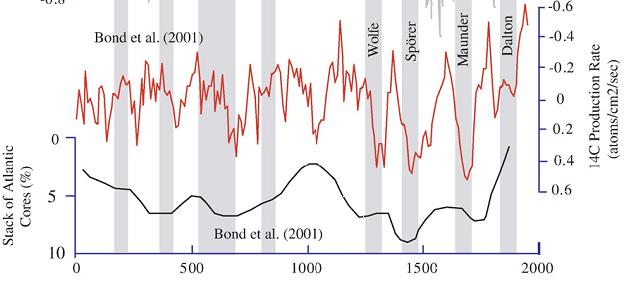
The red line is the C14 production rate, inverted. C14 production is inversely related to solar activity, so we see more C14 production during solar minima. The black line is the percentage of ice-rafted debris in seabed cores of the North Atlantic, also plotted inversely. The higher the black line, the warmer the North Atlantic was. The grey vertical stripes are solar minima.
As the authors say, “Previous analyses of the glacial record showed a 200- year rhythm to glacial activity in Alaska and its possible link to the de Vries 208-year solar (Wiles et al., 2004). Similarly, high-resolution analyses of lake sediments in southwestern Alaska suggests that century-scale shifts in Holocene climate were modulated by solar activity (Hu et al., 2003). It seems that the only period in the last two thousand years that missed a de Vries cycle cooling was the Medieval Warm Period.”
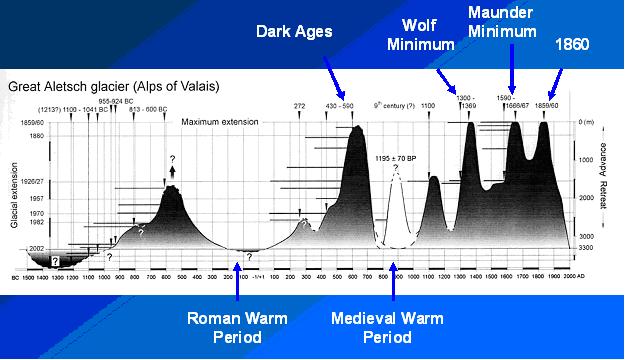
The same periodicity over the last 1,000 years is also evident in this graphic of the advance/retreat of the Great Aletsch Glacier in Switzerland:
The solar control over climate is also shown in this graphic of Be10 in the Dye 3 ice core from central Greenland:
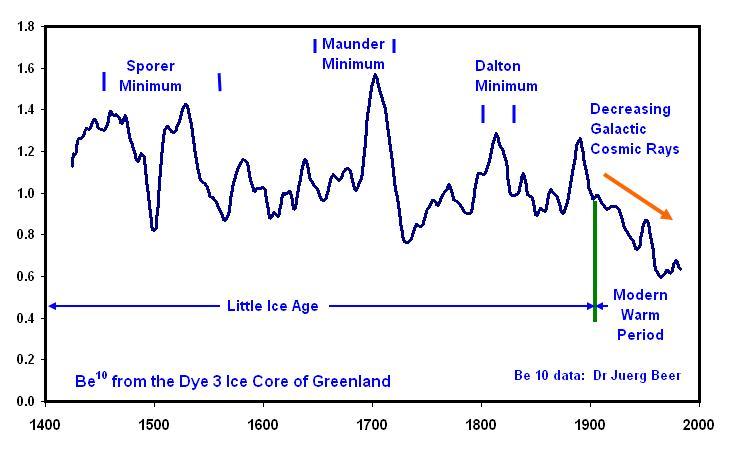
The modern retreat of the world’s glaciers, which started in 1860, correlates with a decrease in Be10, indicating a more active Sun that is pushing galactic cosmic rays out from the inner planets of the solar system.
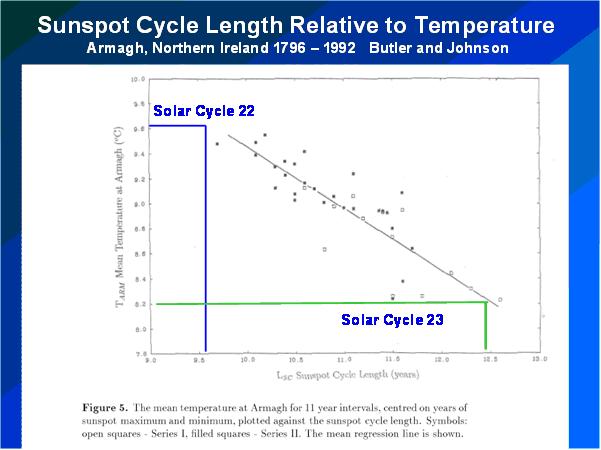
The above graphs show a correlation between solar activity and climate in the broad, but we can achieve much finer detail, as shown in this graphic from a 1996 paper by Butler and Johnson (below enlarged here)::

Butler and Johnson applied Friis-Christensen and Lassen theory to one temperature record – the three hundred years of data from Armagh in Northern Ireland. There isn’t much scatter around their line of best fit, so it can be used as a fairly accurate predictive tool. The Solar Cycle 22/23 transition happened in the year of that paper’s publication, so I have added the lengths of Solar Cycles 22 and 23 to the figure to update it. The result is a prediction that the average annual temperature at Armagh over Solar Cycle 24 will be 1.4C cooler than over Solar Cycle 23. This is twice the assumed temperature rise of the 20th Century of 0.7 C, but in the opposite direction.
To sum up, let’s paraphrase Dante: The darkest recesses of Hell are reserved for those who deny the solar control of climate.
This essay is also available in PDF form: TheWarningintheStars
Stephen Wilde (07:01:36) :
One has to get back to the last glaciation to find a period when solar and oceanic cycles were not coinciding on average.
I have not seen any data substantiation this. And as long as ‘on average’ is not defined, one cannot judge anyway.
Stephen Wilde (05:17:10) :
You haven’t actually commented on that issue of changing rates of energy loss to space
Since the upper atmosphere has a density a million times smaller than the lower, you have to demonstrate how that tiny tail can wag the Great Dane.
Leif, thankyou for the explanation to my first 2 questions, perhaps you would like to comment on the work being done by Professor Joanna Haigh at Imperial College London regarding the Sun’s influence on Climate.
See this –
http://www.bbc.co.uk/blogs/paulhudson/2010/03/blame-the-jet-stream-for-the-c.shtml
“Radiation from the Sun ultimately provides the only energy source for the Earth’s atmosphere and changes in solar activity clearly have the potential to affect climate. There is statistical evidence for solar influence on various meteorological parameters on all timescales, although extracting the signal from the noise in a naturally highly variable system remains a key problem. Changes in total solar irradiance undoubtedly impact the Earth’s energy balance but uncertainties in the historical record of TSI mean that the magnitude of even this direct influence is not well known. Variations in solar UV radiation impact the thermal structure and composition of the middle atmosphere but details of the responses in both temperature and ozone concentrations are not well established. Various theories are now being developed for coupling mechanisms whereby direct solar impacts on the middle atmosphere might influence the troposphere but the influences are complex and non-linear and many questions remain concerning the detailed mechanisms which determine to what extent, where and when the solar influence is felt. Variations in cosmic radiation, modulated by solar activity, are manifest in changes in atmospheric ionisation but it is not yet clear whether these have the potential to significantly affect the atmosphere in a way that will impact climate.”
A C Osborn (09:36:17) :
you would like to comment on the work being done by Professor Joanna Haigh
This is how she describes her own work:
“Radiation from the Sun ultimately provides the only energy source for the Earth’s atmosphere and changes in solar activity clearly have the potential to affect climate. There is statistical evidence for solar influence on various meteorological parameters on all timescales, although extracting the signal from the noise in a naturally highly variable system remains a key problem. Changes in total solar irradiance undoubtedly impact the Earth’s energy balance but uncertainties in the historical record of TSI mean that the magnitude of even this direct influence is not well known. Variations in solar UV radiation impact the thermal structure and composition of the middle atmosphere but details of the responses in both temperature and ozone concentrations are not well established. Various theories are now being developed for coupling mechanisms whereby direct solar impacts on the middle atmosphere might influence the troposphere but the influences are complex and non-linear and many questions remain concerning the detailed mechanisms which determine to what extent, where and when the solar influence is felt. Variations in cosmic radiation, modulated by solar activity, are manifest in changes in atmospheric ionisation but it is not yet clear whether these have the potential to significantly affect the atmosphere in a way that will impact climate.”
Leif Svalgaard (10:24:25) :
But unlike you she does not say that it is Not Possible does she?
Others appear to be looking for links, not denying it is possible.
Or are you also looking?
Leif,
I would direct your attention to the graph of sunspot activity and temperature which is the last graphic in this article:
http://en.wikipedia.org/wiki/Solar_variation
If one accepts that the primary controller of air temperatures is ocean surface temperatures as I do then the temperature line in red serves as an adequate proxy for the warmth of the ocean surfaces back to 10,000 years ago.
The yellow line is a sunspot reconstruction.
One can see that 10,000 years ago the red and yellow lines were going in opposite directions even crossing over one another.
From then until about 5000 years ago they were still going in opposite directions but no longer enough to actually cross each other.
From 5000 years ago to date the lines run almost in parallel.
This shows me that 10,000 years ago the oceanic and solar cycles were supplementing each other’s effects causing wild climate swings. From the start of the interglacial they were moving back into phase and thus supplementing one another less and less effectively with much reduced climate swings and since about 5000 years ago they have been offsetting each other’s effects for most of the time showing relative stability but a slow overall decline in temperatures.
Then look at the Ice core temperature record for the past 20000 years on page 3 here:
http://www.vancouver.wsu.edu/fac/harders/geo390/chapter15.pdf
which shows how global temperatures stabilised 10000 years ago with larger numbers of changes but greater stability overall which I would say is typical of two cycles, oceanic and solar, offsetting one another’s extremes.
When they go out of phase again and resume supplementing each other instead of offsetting each other then the interglacial will end.
Mods,
In my post of (10:53:14)
could you make the two links clickable please, thanks.
REPLY: Done. Don’t use tags, just paste URL’s directly into the comment form. WordPress will recognize it and automatically make a link from it. – Anthony
A C Osborn (10:42:41) :
But unlike you she does not say that it is Not Possible does she?
It is also Possible that tomorrow I win the lottery, but I don’t count on it.
Others appear to be looking for links, not denying it is possible.
Or are you also looking?
We are all looking for linkages [not links on the Internet].
Here are some [Internet] links showing me looking:
http://adsabs.harvard.edu/abs/1973Sci…180..185W
http://adsabs.harvard.edu/abs/1974ASSL…42..627S
http://adsabs.harvard.edu/abs/1974JAtS…31..581W
http://adsabs.harvard.edu/abs/1975scea.conf..294W
http://adsabs.harvard.edu/abs/1975Natur.255..539W
http://adsabs.harvard.edu/abs/1975STIN…7624117W
http://adsabs.harvard.edu/abs/1976JAtS…33.1113W
http://adsabs.harvard.edu/abs/1979Sci…204…60W
http://adsabs.harvard.edu/abs/1979JATP…41..657W
Stephen Wilde (10:53:14) :
One can see that 10,000 years ago the red and yellow lines were going in opposite directions even crossing over one another.
That they cross can be corrected by the draftsman …
From 5000 years ago to date the lines run almost in parallel.
Apart from questioning the data [especially the solar data], what the graph shows is that in the long run solar activity and climate are not correlated. Also, some of the temperature variation is due to orbital cycles, not the Sun.
Leif Svalgaard (11:12:10)
Of course the chart can be designed so that they don’t cross but that’s not the point. The point being that swings in opposite directions were much larger during the ice age than in the interglacial.
That is characteristic of separate and independent solar and ocean cycles that have a different climate consequence depending on the scale and timing of the interaction between sun and oceans.
I would say that the positions of the air circulation systems and the strength of the Arctic and Antarctic Oscillations are a climate consequence of the sun/ sea interaction at any particular moment.
So no, you won’t see a long term correlation between climate and either sun or oceans because there is a constant shifting in their respective degrees of dominance with the oceans being by far the more powerful.
Furthermore in ice ages they work together and in interglacials they work in opposition.
Vukcevic (05:14:52) :
Two papers of indian geologists, who successfully forecasted the December 2004 Sumatra earthquake and tsunami:
http://www.esc-web.org/papers/potsdam_2004/sce_venkatanathan.pdf
http://igu.in/9-4/5venkat.pdf
Stephen Wilde (12:23:03) :
That is characteristic of separate and independent solar and ocean cycles that have a different climate consequence depending on the scale and timing of the interaction between sun and oceans.
Unless you have a theory [or physical reason] for when they are in phase and when they are out of phase, this means nothing.
JonesII (12:35:30) :
Vukcevic (05:14:52) :
Two papers of indian geologists, who successfully forecasted the December 2004 Sumatra earthquake and tsunami
“Prediction” after the fact is no prediction.
JonesII (12:35:30) :
Interesting paper, it is considering gravitational tidal effect. I as a magnetosphere minded loony, tend to favour ideas by scientists from the NASA’s Goddard Space Flight Center and the NASA’s Ames Research Center.
http://www.cosis.net/abstracts/EGU06/01705/EGU06-J-01705.pdf
However, have no access to the full article.
Perhaps good old doc Svalgaard may help.
Vukcevic (12:58:37) :
However, have no access to the full article.
I don’t think there is a paper; this looks to about a talk they will give. They say they “will” do this or that, but not what they found.
This is something that rears its head from time to time. The U.S. Geological Survey has investigated such claims and finds no evidence. Here is a typical paper on this: http://www.leif.org/EOS/2009GL039020.pdf
I have discussed this on numerous occasions with Jeffrey Love [coauthor] and although it would be nice if there were such relationships [as well as thousands of other ones: nervous dogs, chicken not laying eggs, lunatics misbehaving, …] none have been found to be of any use.
Vukcevic (05:14:52) :
the Chile earthquake may have shorten Earth’s rotation by 1.26 microsec due to a shift of the Earth mass for about 8 cm
That would make the dip of the LOD curve deeper…and colder.
OT.-In the chilean capital, Santiago, several buildings which almost fell down, not everyone in the same part of the city, were built by the same company…
Vukcevic (12:58:37) :
However, have no access to the full article.
http://www.usgs.gov/faq/faq.asp?id=485&category_id=11
It may be instructive to read Shermer’s book:
http://www.amazon.com/People-Believe-Weird-Things-Pseudoscience/dp/0805070893
it is in stock [for $6.49].
Vukcevic (12:58:37) :Both are compatible, when considered forecast will increase from 75% to 100%.
Vukcevic (12:58:37) During Santiago earthquake light flashes were seen in the sky. (shown at the national TV station there). Btw, I have witnessed those earthquake lights in another earthquake.
Leif: The sun must control: All the planets circulate around it. The gravitational effect must be overwhelming? In fact the control would have to be very extremely precise otherwise all the planets would be going everywhere! This is very very simple. To say that the sun has no influence on most planetary activities especially spin, wobble and orbit, geomagnetic=tectonic plate movements, and indirectly climate does not make sense to me anyway. Question: if the sun was removed what would happen to our solar system? LOL Anyway I think so far from what we have been experiencing D Archibald and especially Svensmark (CR particle effects), seem to hit it almost everything on the nail. Have you recorded cloudiness and precipitation world wide lately???
Leif Svalgaard (13:24:46) :
Leif Svalgaard (13:30:21) :
Thanks Dr. Svalgaard, I will read the Guam paper. On matter of pseudoscience I have considerable collection of ideas of my own. Only exception here is that my musings are for my own entertainment, made available to a wider audience for their pleasure and amusement.
Now, to be serious, I know you have looked at this graph
http://www.vukcevic.talktalk.net/LFC9.htm
but studiously avoided any comment. You got all the data to check the accuracy if required.
Just coincidence? It must be, either of two is too weak at place of the other to cause a relationship.
Vukcevic (13:59:35) :
Now, to be serious, I know you have looked at this graph
http://www.vukcevic.talktalk.net/LFC9.htm
but studiously avoided any comment. You got all the data…Just coincidence?
This is not being serious. It is not even coincidence [and I do not studiously avoid anything – but somethings are just too silly to warrant comment], just selection. Here is some basic theory on spurious correlations: http://cowles.econ.yale.edu/P/cp/p09b/p0966.pdf
Vukcevic (13:59:35) :
made available to a wider audience for their pleasure and amusement.
I don’t think people come to this blog for amusement [although they will find lots of ridiculous posts – such is the nature of the Internet].
Stephan (13:52:13) :
To say that the sun has no influence on most planetary activities especially spin, wobble and orbit, geomagnetic=tectonic plate movements, and indirectly climate does not make sense to me anyway.
The Sun has an influence on everything. It is just very small.
Leif Svalgaard (14:22:23) :
Still no comment on
http://www.vukcevic.talktalk.net/LFC9.htm
?
Come on you can do better than that, or maybe a further consideration is required.
If not a coincidence I have no idea.