The Warning in the Stars
By David Archibald
If climate is not a random walk, then we can predict climate if we understand what drives it. The energy that stops the Earth from looking like Pluto comes from the Sun, and the level and type of that energy does change. So the Sun is a good place to start if we want to be able to predict climate. To put that into context, let’s look at what the Sun has done recently. This is a figure from “Century to millenial-scale temperature variations for the last two thousand years indicated from glacial geologic records of Southern Alaska” G.C.Wiles, D.J.Barclay, P.E.Calkin and T.V.Lowell 2007:
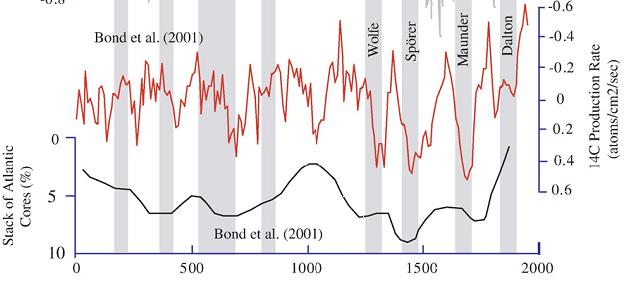
The red line is the C14 production rate, inverted. C14 production is inversely related to solar activity, so we see more C14 production during solar minima. The black line is the percentage of ice-rafted debris in seabed cores of the North Atlantic, also plotted inversely. The higher the black line, the warmer the North Atlantic was. The grey vertical stripes are solar minima.
As the authors say, “Previous analyses of the glacial record showed a 200- year rhythm to glacial activity in Alaska and its possible link to the de Vries 208-year solar (Wiles et al., 2004). Similarly, high-resolution analyses of lake sediments in southwestern Alaska suggests that century-scale shifts in Holocene climate were modulated by solar activity (Hu et al., 2003). It seems that the only period in the last two thousand years that missed a de Vries cycle cooling was the Medieval Warm Period.”
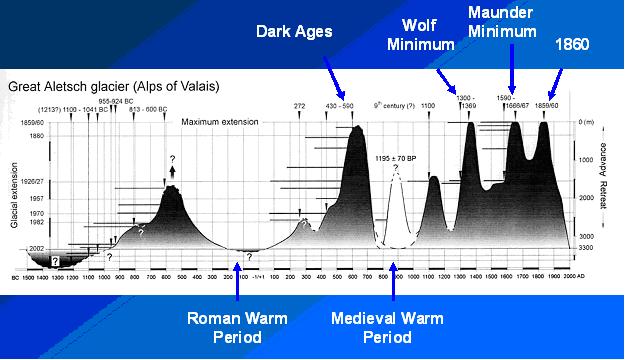
The same periodicity over the last 1,000 years is also evident in this graphic of the advance/retreat of the Great Aletsch Glacier in Switzerland:
The solar control over climate is also shown in this graphic of Be10 in the Dye 3 ice core from central Greenland:
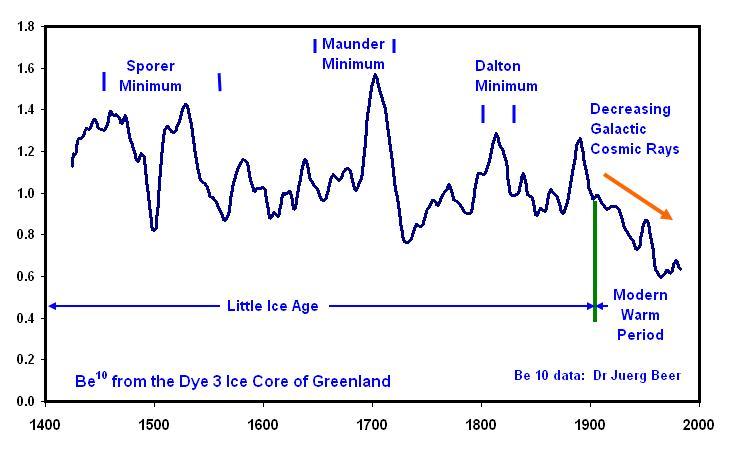
The modern retreat of the world’s glaciers, which started in 1860, correlates with a decrease in Be10, indicating a more active Sun that is pushing galactic cosmic rays out from the inner planets of the solar system.
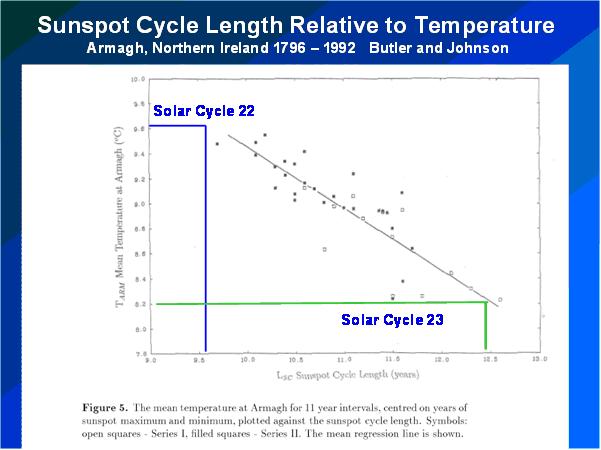
The above graphs show a correlation between solar activity and climate in the broad, but we can achieve much finer detail, as shown in this graphic from a 1996 paper by Butler and Johnson (below enlarged here)::

Butler and Johnson applied Friis-Christensen and Lassen theory to one temperature record – the three hundred years of data from Armagh in Northern Ireland. There isn’t much scatter around their line of best fit, so it can be used as a fairly accurate predictive tool. The Solar Cycle 22/23 transition happened in the year of that paper’s publication, so I have added the lengths of Solar Cycles 22 and 23 to the figure to update it. The result is a prediction that the average annual temperature at Armagh over Solar Cycle 24 will be 1.4C cooler than over Solar Cycle 23. This is twice the assumed temperature rise of the 20th Century of 0.7 C, but in the opposite direction.
To sum up, let’s paraphrase Dante: The darkest recesses of Hell are reserved for those who deny the solar control of climate.
This essay is also available in PDF form: TheWarningintheStars
Leif Svalgaard (06:56:46)
So you accept that the warming of the thermosphere is caused by energy coming up from below rather than the solar output varying minutely and warming it from above ?
Any warming of molecules in the thermosphere from solar variations would be proportionate to the change in solar power output so it couldn’t be the sun wot does it because the temperature swings up there are wholly disproportionate.
If the warming in the thermosphere is caused by changes in the rate of energy flow from below and the thermosphere gets warmer when the sun is more active then that supports my description.
Stephen Wilde (09:10:00) :
So you accept that the warming of the thermosphere is caused by energy coming up from below rather than the solar output varying minutely and warming it from above ?
No, that is not the way Nature works. The warming of the thermosphere is due to solar X-ray and EUV absorbed up there [with some heating due to electric currents in the polar regions]. The variation of the very short wave length radiation is very large in percentage terms, but very small in absolute terms [e.g. W/m2]. We only get significant heating because the thermosphere is so thin. And it is not hot in the usual sense. If you stuck your arm out the window of the space station it would freeze stiff instantly even though the temperature is 500 degrees.
Leif Svalgaard (16:09:32) :
Tony B (number 2) (13:35:28) :
“but rather sucks up the dark. Just look at the wick.”
That was a joke, right?
You be the judge. Read up on it: http://www.jtkdev.com/light.html
**********************************************************************
Yes – I note the date (or month) of publication – April. Quite early in the month, I would guess.
Amongst other things it says
“The dark theory, according to a Bell Labs spokesman, proves the existence of dark, that dark has mass heavier than that of light, and that dark is faster than light. ”
“Actually when you turn on your flashlight it sucks in darkness and stores in the batteries. When the batteries are full of darkness they no longer work.”
Very helpful – the effect of suckers is now so much clearer. And I feel foolish for having expended any time reading it.
*******************************************************************************
That explanation (perhaps better described as a statement of the bleeding obvious)
If it was so bleeding obvious, then perhaps the question was a joke…
*******************************************************************************
To explain the difference in temperature between northern and southern hemispheres by stating – in effect – “it is the difference between summer and winter, dummy” is not terribly helpful, is it?
********************************************************************************
I am just wondering if you sincerely believe that variation in the sun’s output has anything but the most significant impact on the planet’s temperature.
The statement makes little sense, either it is a joke or you meant ‘insignificant’
********************************************************************************
No, I did not mean insignificant, but perhaps I could have phrased more carefully. I will now.
Do you have firm evidence that variations in the Sun’s output, and the transfer mechanisms of that output to this planet, have no impact on the climate of this planet?
********************************************************************************
Why do I feel a huge difference in temperature as soon as cloud passes between me and the sun?
The amount of sunlight falling on you depends on the transmission of the atmosphere above you at the moment of ‘feeling’. This paper has more on that http://www.arm.gov/publications/proceedings/conf09/extended_abs/takara_ee.pdf
As I understand it the cloud absorbs about half of the light [Figure 2b]. So the temperature should drop by a factor of 2^0.25 = 1.19, but since you also receive radiation from other things, like the ground or structures near you, even the air, the temperature will be lees, perhaps only a third [although more research is needed on the exact number], or about 20C. Even this seems a bit high. Perhaps you should measure it and then we can go from there. Be sure to note what kind of cloud it is: some are thin, and some look almost black.
And a remarkably patronising answer will probably not help.
I hope my detailed answer was helpful.
*******************************************************************************
Well, it was a little more helpful than some others, certainly. Until the comment about black clouds….
anna v (00:35:56) :
Re: Tony B (number 2) (Mar 1 13:35),
We have to isolate the influence of the sun as a constant energy input to the planet, call it W, and the small changes in it dW/dt. Nobody refuses that W is responsible for everything on the planet, including climate. The question is whether the small dW/dt observed over historical times with the changing solar cycle has a direct effect on the climate.
Leif excludes direct effects because of the small magnitude of the change and is skeptical of other solutions offered before they prove themselves.
*********************************************************************************
Agreed – and who am I to criticise skepticism.
However, the small dW/dt observations need to be considered in the context of the entire system, not in isolation
*********************************************************************************
I tend to favor the chaotic models, i.e. many inputs contributing to the observed cycles in climate, not direct one to one correspondence.
*********************************************************************************
I agree again. But how many of the climate models even take into account the complexities of the transfer of solar output (whether constant or variable) to the Earth’s climate?
Given a recent statement (quoted on WUWT) that GCMs have not even attempted to model the impact of the glacier/ocean interface, I would guess that the answer is probably “nil”.
How many degrees of freedom are there, with respect to the Earth’s orbit, and its passage around the Sun? How variable is the Sun’s output, or the transfer of that output, spatially? Is the Earth’s capability to receive that output uniform at all points along its orbit, and for every completed orbit, around the Sun?
The system is complex, but given the potential impact of flawed decision making, I cannot understand why the models are (apparently) not attempting
to take into consideration all of the variables.
Oh berger. I have just got it. The model makers aren’t interested in getting to the truth.
What a sucker. Must wake up more often.
Leif Svalgaard (09:19:39)
Thanks, I can see that but I’m still trying to get at the issue as to whether or not the Earth’s rate of energy loss to space changes with the level of solar surface activity.
The SABER observations suggest that it does.
Furthermore even on your description there must be some portion of the heating of the molecules in the thermosphere that is attributable to energy flowing up from below, unless the radiated energy loss from below goes straight through the thermosphere without affecting any of it’s molecules and if that is so one just needs to remove the query to the next layer interface below and ask whether the upward radiation from that level (or even any level below that) is significantly affected by solar surface variability.
Another contributor here suggested this (slightly paraphrased):
“If the atmosphere warms then it expands.
If it expands, the average space between molecules gets greater.
If the average space between molecules gets greater, then the distance an IR photon travels upward before being absorbed increases.
If the distance a photon travels upward before being absorbed increases, then the effective transparency of the atmosphere to upward travelling IR also increases. In other words, at any altitude, if the atmosphere becomes less dense due to solar induced expansion the chances of a particular photon escaping to space without being absorbed increase.”
So we should see a warmer expanded atmosphere increasing the rate of energy loss to space and a cooler contracted atmosphere reducing it.
Stephen Wilde (09:10:00) :
I vaguely remember that at 80km height, air density is 10,000 times less than at the sea level. Consequently you need 10,000 more energy to increase temperature of a volume of air by 1 degree C at the sea level than it is necessary at 80km above.
Tony B (another one) (09:33:02) :
To explain the difference in temperature between northern and southern hemispheres by stating – in effect – “it is the difference between summer and winter, dummy” is not terribly helpful, is it?
Yes, because that was the original question: “why is the summer warmer than the winter” IIRC
Now, since the Earth is closer to the Sun in January than in July, there will be a difference in global temperature of 4.8C simply due to that.
Do you have firm evidence that variations in the Sun’s output, and the transfer mechanisms of that output to this planet, have no impact on the climate of this planet?
Is the wrong question. Since basic physics suggests that the influence is very small [of the order of 0.1C], the question should be: “what evidence do we have that the impact is substantially larger and why?” And to that i must answer that I don’t know of any such evidence.
Well, it was a little more helpful than some others, certainly. Until the comment about black clouds….
The cloud here http://www.spc.noaa.gov/faq/tornado/alfalfa.jpg qualifies as almost black and the amount of sunlight falling on under THAT cloud is very small as I explained.
Tony B (another one) (10:09:27) :
How many degrees of freedom are there, with respect to the Earth’s orbit, and its passage around the Sun? How variable is the Sun’s output, or the transfer of that output, spatially? Is the Earth’s capability to receive that output uniform at all points along its orbit, and for every completed orbit, around the Sun?
To all of these questions we know the precise answers. What we don’t know is how the climate system responds to these [if at all]. In spite of centuries of observations and speculations we have not been able to pick a compelling solar signal out of the noise.
Stephen Wilde (10:13:36) :
The SABER observations suggest that it does.
The SABER observations give us the heat budget of the thermosphere [and a bit of the mesosphere], not of the lower atmosphere.
Furthermore even on your description there must be some portion of the heating of the molecules in the thermosphere that is attributable to energy flowing up from below, unless the radiated energy loss from below goes straight through the thermosphere
The thermosphere is indeed basically transparent for infrared radiation, so it passes straight through. The effective height of where the infrared radiation escapes is about 5 km.
Leif Svalgaard (05:53:03) :
“…The magnetic field at the North Pole was 50% higher 2000 years ago than today. Applying your spurious ‘correlation’ gives an integrated sunspot number of some -50 back then, more nonsense.
The nonsense lies in conjuring ‘mysteries’….”
Your interpretation is far too simplistic. Integrating sunspot number is used only as a proxy for the intensity of the solar magnetic strength B. If L&P are correct
http://www.leif.org/research/Livingston%20and%20Penn.png
than sunspot number may drop to zero but not below zero (for a longer period of time), however B could fall well below 1500G.
If you have estimated numbers for B I shall look at it afresh.
http://www.vukcevic.talktalk.net/LFC9.htm
Stephen Wilde
“The climate system will always react to changes in the rate of energy transfer from oceans to air and changes in the rate of energy transfer from stratosphere to space so as to retain equilibrium for the system as a whole.
Climate is simply the geographical distribution of the equilibrium process.”
This is beginning to sound a little like Willis Eschenbach’s (Bejan’s) “Constructal Law” – although this “law” is in fact a reinvention and repackaging of already established nonlinear / nonequilibrium dynamical system theory (e.g. Mathias Bertram). Your last sentence is a nice one-liner!
Clarification
That should be: however sunspot B could go well below 1500G.
Vukcevic (11:40:17) :
Integrating sunspot number is used only as a proxy for the intensity of the solar magnetic strength B.
Two things wrong:
1) integrating sunspot numbers or magnetic field does not make any difference, the data points are not independent and hence R^2 is meaningless.
2) You have not defined the ‘solar magnetic field’. The 1500 G you quote leads me to believe that you think the field of a sunspot is the sun’s magnetic field. It isn’t.
I don’t know why I keep this up. Perhaps for the same reason I was constantly admonishing my children way back then [and to similar no avail].
And to compare that with the magnetic field at the North Pole that over time varies wildly [even changes sign] is the real folly.
Read Shermer’s book.
If L&P are correct
http://www.leif.org/research/Livingston%20and%20Penn.png
than sunspot number may drop to zero but not below zero (for a longer period of time), however B could fall well below 1500G.
If you have estimated numbers for B I shall look at it afresh.
http://www.vukcevic.talktalk.net/LFC9.htm
Vukcevic (11:49:42) :
Clarification That should be: however sunspot B could go well below 1500G.
Does not make any more sense than your original statement. And we think that the 1500G is a lower limit, so you must physically justify why not.
The lower limit comes from the magnetic field being strong enough to balance the pressure of the surrounding material [and that depends on the very little varying solar temperature].
Apart from all of this, your basic folly is calculating correlation coefficient of integrated, summed, or smoothed data. This folly is independent of any physics or proxies. Don’t you think the amusement has gone far enough, after a certain point ridicule begins.
Leif Svalgaard (11:57:18) :
Vukcevic (11:40:17) :
Integrating sunspot number is used only as a proxy for the intensity of the solar magnetic strength B.
Two things wrong:
1) integrating sunspot numbers or magnetic field does not make any difference, the data points are not independent and hence R^2 is meaningless.
2) You have not defined the ’solar magnetic field’. The 1500 G you quote leads me to believe that you think the field of a sunspot is the sun’s magnetic field. It isn’t.
I don’t know why I keep this up. Perhaps for the same reason I was constantly admonishing my children way back then [and to similar no avail].
And to compare that with the magnetic field at the North Pole that over time varies wildly [even changes sign] is the real folly.
Read Shermer’s book.
Leif Svalgaard (12:06:08) :
Thanks. Point taken. Ad acta.
Leif Svalgaard (12:07:08) :
Two things wrong:
1) integrating sunspot numbers or magnetic field does not make any difference, the data points are not independent and hence R^2 is meaningless.
2) You have not defined the ’solar magnetic field’. The 1500 G you quote leads me to believe that you think the field of a sunspot is the sun’s magnetic field. It isn’t.
~
Oh dear Vuks, been had.
Back to the light box for cloud photos.
Razorbacks documentary (work in progress) first movie.
Picked out my bro at 7:26. Any Razorbacks should make contact.
Those who danced were thought to be quite insane by those who could not hear the music. ~John Milton
Paul Vaughan (06:52:31) : Solar-Lunar association with volcanic activity:
http://www.sfu.ca/~plv/SAOT-SLAMaaChandler.png
That is something, like Anthony said. But the 1930’s are such a mystery… there were a lot of volcanoes then. Doesn’t really show much on the graph, puzzling.
Seems there would be a pretty good rise, hmmm, well re-eruptions make a big difference as a for instance Mt. Redoubt in Alaska. The biggest exceeded 65,000 feet in height, March, 2009. More than a dozen eruptions as high as 60,000 followed.
Put this stuff with Willis Eschenbach’s Thermostat Hypothesis and it bloody well seems to me that without dirty volcanoes making extra clouds the Earth would eventually really roast. The dust off the deserts maybe just not quite enough aid to cloud formation to keep the thermostat down.
I didn’t really agree with Leif Svalgaard at first about his take on the solar – climate relationship, but I am now converted into a big fan of his.
http://www.volcano.si.edu/world/largeeruptions.cfm
KLIUCHEVSKOI Kamchatka Peninsula (Russia) 1931 Mar 25 4
ANIAKCHAK Alaska Peninsula 1931 May 1 4
ANIAKCHAK Alaska Peninsula 1931 May 11 4?
FUEGO Guatemala 1932 Jan 21 4
AZUL, CERRO Central Chile 1932 Apr 10 5+
KHARIMKOTAN Kuril Islands 1933 Jan 8 5
SUOH Sumatra (Indonesia) 1933 Jul 10 4
KUCHINOERABU-JIMA Ryukyu Islands (Japan) 1933 Dec 24 4?
RABAUL New Britain 1937 May 29 4?
MICHOACAN-GUANAJUATO México 1943 Feb 20 4
Carla (13:05:32) :
“Oh dear Vuk, been had.”
Just failed to find right path out; real failure would be failure to try.
Vukcevic (14:20:15) :
Just failed to find right path out; real failure would be failure to try.
To try is noble, even if wrong.
Ed Murphy (13:27:06) ”
Paul Vaughan (06:52:31) : Solar-Lunar association with volcanic activity:
http://www.sfu.ca/~plv/SAOT-SLAMaaChandler.png
That is something, like Anthony said. But the 1930’s are such a mystery… there were a lot of volcanoes then. Doesn’t really show much on the graph, puzzling.”
I provide a link to the article that explains SAOT here:
Vaughan, P.L. (2010). Volcanic Activity, the Sun, the Moon, & the Stratosphere.
http://www.sfu.ca/~plv/VolcanoStratosphereSLAM.htm
I’m now taking a look at other indices of volcanic activity. We need to keep in mind that SAOT is about THE STRATOSPHERE as well as about volcanoes. (Not all volcanic eruptions impact the stratosphere.)
Anthony, feel welcome to mirror the post as long as there are no copyright/editorial/whatever reasons that doing so might be somehow problematic – (not interested in administrative headaches/nonsense).
Best Regards,
Paul.
Oops, just having at this moment a moderate size earthquake in Taipei.
Doesn’t appear to be damaging.
John
Stephen Wilde (10:13:36) :
the thermosphere
Here is an interesting comparison: there is more gas between you and the thermosphere than between the thermosphere and the edge of the observable universe 46.5 billion light-years away [imagine a column one centimeter square cross-section extending upwards from you]
”””’John Whitman (16:21:59) : Oops, just having at this moment a moderate size earthquake in Taipei. Doesn’t appear to be damaging.”””’
Update
The earthquake was a moderate “roller” as oppose to the hopping-jolters I have experienced here in the past. Seemed like it lasted ~1 min.
I think no damage. Don’t know where the epicenter was.
We’ve been having about one a week for the 5 weeks i’ve been here. I recall that as about normal.
4 to 5 blocks from my apartment is Taipei 101 [until recently it was the tallest building in the world]. I have a clear view of it from the room my office is in.
During this earthquake it was like a ballerina.
John
Hi John
Hope everything Ok.
More details here
http://earthquake.usgs.gov/earthquakes/recenteqsww/Quakes/us2010tkab.php
http://earthquake.usgs.gov/earthquakes/recenteqsww/Quakes/us2010tka6.php
http://earthquake.usgs.gov/earthquakes/recenteqsww/Quakes/quakes_all.php
Tony B (another one) (10:09:27) :
anna v (00:35:56) :
Re: Tony B (number 2) (Mar 1 13:35),
How many degrees of freedom are there, with respect to the Earth’s orbit, and its passage around the Sun? How variable is the Sun’s output, or the transfer of that output, spatially? Is the Earth’s capability to receive that output uniform at all points along its orbit, and for every completed orbit, around the Sun?
The system is complex, but given the potential impact of flawed decision making, I cannot understand why the models are (apparently) not attempting
to take into consideration all of the variables.
The degrees of freedom from the orbit are known because the paths are known. What is not known is how this planet responds to these changes in energy input from the changing orbits. Grossly we know: we get summer and winter, etc. Summer and winter will happen and are a much larger effect than the puny change in energy output from the sun. And the beats of the large changes in energy between seasons and day/night and geography give rise to all the alphabets of PDO, ENSO etc that correlate well with temperature variations.
It is not from a lack of will, that the models are not more complex, but from a lack of computer power. That is why modelers ask for larger and larger computer power. The sad thing is though that even if they do manage in the new supercomputer to program in all the extra complexities, they will still get wrong results for their “projections”. The basic premise that one can use linear approximations for a collective set of what are nonlinear functions is in error.
Even two years ago I was proposing that analogue computers should be designed to solve these coupled differential equations. They are much faster, but it seems that the technique was lost or not developed when digitals took over. When I was a graduate student back in the early sixties analogue computers were competing with digital ones. I vaguely remember seeing an analogue HP in the lab at the time.
The Tsonis et al paper is really a digital analogue of analogue computing.