The Warning in the Stars
By David Archibald
If climate is not a random walk, then we can predict climate if we understand what drives it. The energy that stops the Earth from looking like Pluto comes from the Sun, and the level and type of that energy does change. So the Sun is a good place to start if we want to be able to predict climate. To put that into context, let’s look at what the Sun has done recently. This is a figure from “Century to millenial-scale temperature variations for the last two thousand years indicated from glacial geologic records of Southern Alaska” G.C.Wiles, D.J.Barclay, P.E.Calkin and T.V.Lowell 2007:
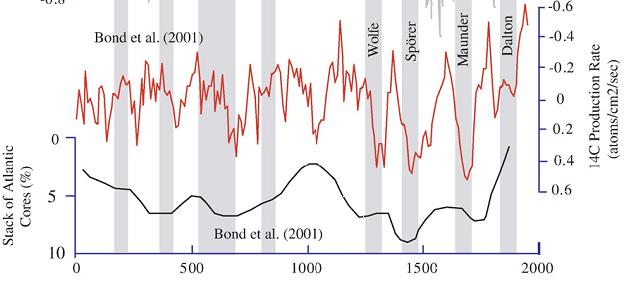
The red line is the C14 production rate, inverted. C14 production is inversely related to solar activity, so we see more C14 production during solar minima. The black line is the percentage of ice-rafted debris in seabed cores of the North Atlantic, also plotted inversely. The higher the black line, the warmer the North Atlantic was. The grey vertical stripes are solar minima.
As the authors say, “Previous analyses of the glacial record showed a 200- year rhythm to glacial activity in Alaska and its possible link to the de Vries 208-year solar (Wiles et al., 2004). Similarly, high-resolution analyses of lake sediments in southwestern Alaska suggests that century-scale shifts in Holocene climate were modulated by solar activity (Hu et al., 2003). It seems that the only period in the last two thousand years that missed a de Vries cycle cooling was the Medieval Warm Period.”
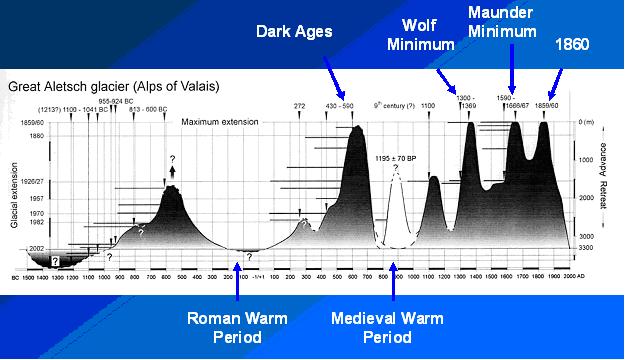
The same periodicity over the last 1,000 years is also evident in this graphic of the advance/retreat of the Great Aletsch Glacier in Switzerland:
The solar control over climate is also shown in this graphic of Be10 in the Dye 3 ice core from central Greenland:
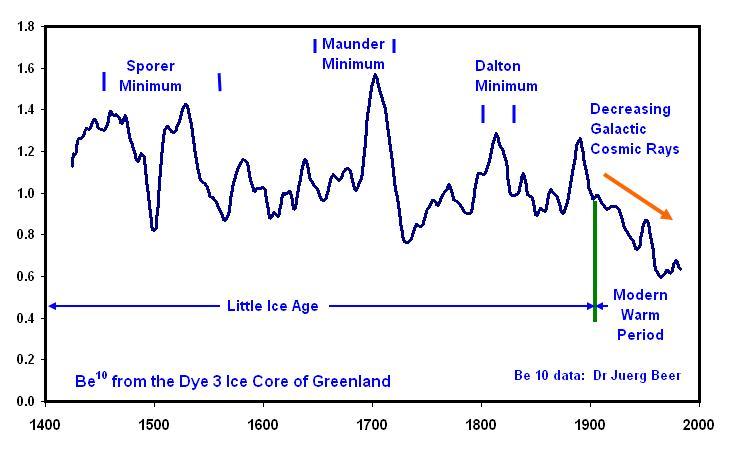
The modern retreat of the world’s glaciers, which started in 1860, correlates with a decrease in Be10, indicating a more active Sun that is pushing galactic cosmic rays out from the inner planets of the solar system.
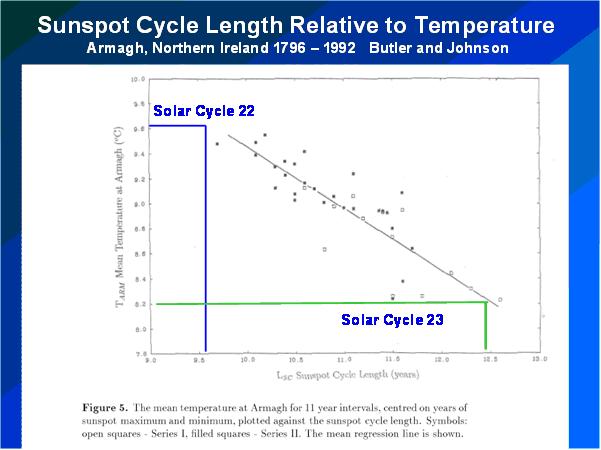
The above graphs show a correlation between solar activity and climate in the broad, but we can achieve much finer detail, as shown in this graphic from a 1996 paper by Butler and Johnson (below enlarged here)::

Butler and Johnson applied Friis-Christensen and Lassen theory to one temperature record – the three hundred years of data from Armagh in Northern Ireland. There isn’t much scatter around their line of best fit, so it can be used as a fairly accurate predictive tool. The Solar Cycle 22/23 transition happened in the year of that paper’s publication, so I have added the lengths of Solar Cycles 22 and 23 to the figure to update it. The result is a prediction that the average annual temperature at Armagh over Solar Cycle 24 will be 1.4C cooler than over Solar Cycle 23. This is twice the assumed temperature rise of the 20th Century of 0.7 C, but in the opposite direction.
To sum up, let’s paraphrase Dante: The darkest recesses of Hell are reserved for those who deny the solar control of climate.
This essay is also available in PDF form: TheWarningintheStars
Archibald: “let’s paraphrase Dante: The darkest recesses of Hell are reserved for those who deny the solar control of climate.”
We have two extreme positions staked out, Dr Svalgaard instinctively rubbishing any claim of an effect of the sun on climate, while Dr Archibald consigns to the depths of Hades any who doubt “control” of climate by the sun.
Dr Svalgaard’s knowledge of things solar is of course profound and his logical exactness impressive. However his apparent demand for rigid correlation of two factors in order to argue some sort of causal linkage, would seem inappropriately stringent for a system such as climate of high complexity and chaotic-nonlinear behaviour (as pointed out by posters conversant in chaotic dynamics e.g. Anna v, Tenuc). In Dr Svalgaard’s statistical scheme, an R^2 of less than 1.000 seems to be evidence of total independence of two variables. In regard to climate, I’m not sure we can afford the luxury of demanding such exactness.
Chaotic and harmonic systems can have intermittent corellation and shift in and out of phase as nicely shown by Anna v. in the pendulum videos.
It seems there is too much circumstantial evidence of correlations between solar cyclical behaviour and various historic climate proxies, for solar variability to be ruled out as a climate driver.
However I would have to number myself among the denizens of the depths of Hell and question Archibald’s use of the word “control”. The incompleteness of the solar-climate correlations would suggest a word like “influence” to be more apt. Archibald himself points out that the MWP was “supposed” to have been cold according to the de Vries 208-year solar cycle. (Ironic that AGW skeptics use the MWP as a major argument – correctly – but also sometimes argue for a dominant solar role.)
BTW is there any statistical significance to a C14 production / ice-rafted debris correlation from the first figure – the variability of the former and smoothness of the latter would make this seem doubtful. The solar minima effect on the Great Aletsch Glacier in Switzerland in the following figure, seems more convincing.
Incredibly important question:
A C Osborn (10:34:12) “what drives El Nino and La Nina?”
Have to ask:
If the Sun is pumping out the same level of energy at a near constant rate, what’s the significance of Sun Spots?
If the Sun is pumping out the same level of energy at a near constant rate, what’s the significance of CMEs?
If the Sun is pumping out the same level of energy at a near constant rate, what’s the significance of Chronal Holes?
If the Sun is pumping out the same level of energy at a near constant rate, what’s the significance of Solar Winds?
If the Sun is pumping out the same level of energy at a near constant rate, what’s the significance of Solar Magnetic Pulse?
There has to be something “significant” about something relative to climate, and not just electronics and radio waves and radiation vis a vis humans in orbit or jumping around on the Moon or Mars.
Leif? Anybody?
PS: Where do 110K-120K glacial cycles come from? Where do glacial and non-glacial periods in our orbit of the galaxy come from?
PPS: Is there really a Santa Claus? How about the Easter Bunny?
Stephen Wilde
Two aspects of your “system” have always seemed to me convincing – a major role for the ocean in “processing” variation in inputs such as solar, and mixing them up with various time delays to confuse the statisticians. Also the effect on atmospheric radiative heat balance of laminar versus turbulent boundary layers seems a persuasive insight. However I confess I have not read your proposed theory in detail (is there an available reference?) You have been arguing these points for some time – what do you see as the way forward? If (hypothetically) you were making a grant application, what new data would you propose to collect – either analysis of past proxies or new measurements going forward – in order to validate or falsify your ideas?
It is indeed to be hoped that climate science will come to it senses, stop funding only the climate research starting from the (unquestioned but spurious) assumption of CO2 being the only significant climate driver – and take a step back and make a wide ranging search for what really are the climate drivers. Perhaps the null hypothesis should be that climate is chaotic-nonlinear and that all climate variation (showing as it does log-log power law nonlinear-like fluctuation) is random walk?
anna v (13:04:15) :
here is one with more metronomes
I want to see this triple double pendulum on a metronome-like tripod set on the board over the coke cans, WITH the metronomes.
Better yet let’s balance the board on some large raw goose eggs instead of empty cylinders. Or half fill the cylinders with wet corn starch. 🙂
Paul Vaughan (15:32:35) :
Incredibly important question:
A C Osborn (10:34:12) “what drives El Nino and La Nina?”
Since we’re in a sort of astronomy thread – try this:
http://www.wxresearch.org/papers/paper18.pdf
anna v.
“Particularly the fingers are amazing.” [comment on cornstarch video]
The “fingers” remind me of souls writhing in the lake of fire – i.e. (according to Archibald) the fate of those of us infidels who dont believe the sun “controls” climate.
Notes on Piers Corbyn’s work:
Overview:
I recommend studying the following combo:
Audio: http://www.heartland.org/bin/media/newyork09/Audio/Tuesday/Piers_Corbyn.mp3
Slides: http://www.heartland.org/bin/media/newyork09/PowerPoint/Piers_Corbyn.ppt
More:
Solar Weather Technique (SWT):
Intro: http://www.youtube.com/watch?v=jYnLbz8ZoTE
Part 1: http://www.youtube.com/watch?v=vMQNrP1NhVM
Part 2: http://www.youtube.com/watch?v=-OKiVTSR0Z8&NR=1
Part 3: http://www.youtube.com/watch?v=ZGosqhZ6gUM
Solar Lunar Amplification Magnetic (SLAM):
Leif, I have something I want you to try. Howz about it? It goes like this.
From the second graphic above:
The same periodicity over the last 1,000 years is also evident in this graphic of the advance/retreat of the Great Aletsch Glacier in Switzerland:
http://icecap.us/images/uploads/Archibald2sun.JPG
Open the image and zoom. Close your eyes and think the heliosphere in time. Heliosphere embedded in Local Cavity (chiminey) with tunnels, filaments, clouds, cellualar structures like a sponge surround you. Now open your eyes and look at the image. Given that the terrestrial timez will lag behind the heliospheric timez, are we seeing a re-construct of the inside of the interstellar local cavity in timez? eh just an exercise or thought. Sunday good day to relax and let your imagination go.
Oh yeah, the new 3D Mapping project of the Local Interstellar Cavity affirms Linsky and Redfield on the heliosphere being in the transition zone between the warm local interstellar cloud LIC and the cooler denser G cloud. lol They did have to toss a Linsky, Redfield eh but not the GGGGGGG cloud. lol
Global Water Vapor Denisty has been a pet observational project of mine. The density levels of the past few years has been chaotic and increasing.
Current
http://www.weatheroffice.gc.ca/data/satellite/goes_nam_1070_100.jpg Look at the 123 punch on that thang.
From the North Pole view:
http://www.weather.com/maps/geography/polar/index_large.html
From the South Pole view:
http://www.weather.com/maps/geography/polar/southpolesatellite_large.html?clip=undefined®ion=undefined&collection=localwxforecast&presname=undefined
A polar vortex tech doc comes to mind here. hmm ah..
Maybe it is just me but the calibrated eyeball MK III mod A4 does not detect a correlation.
I hope that is not a Mannian inversion. Perhaps it was done for compactness?
I generally have a profound distaste for inversions and an earnest desire to keep the polarity correct. But maybe that is just me.
Vukcevic (00:52:15) :
Hey Vuks have you read this? “Interplanetary magnetic field during the past 9300 years inferred from cosmogenic radionuclides” (accepted 4 September 2009) Recomended by Dr. S. It is second up on my to do list. Still working on “New 3D gas density maps of NaI and CaII interstellar absorption within 300 pc *,**” Need to enlarge the maps and put them under a blacklight box, kinda like and X Ray image lol. And do some re reads with all images locked and loaded. Catch up wit cha later.
Oh my. Some of those questions. Back in the day when I was sure the Sun could drive Earth’s temperature trends, I made the same assumptions. “Gee I feel hot when the Sun is beating straight down on my skin but get immediately cool when the Sun is about to set. It must be the Sun.” Then Leif suggested a few books and journal articles. Needless to say I sheepishly read all that was suggested and thought, “call me a dumbass”. It really does help to read a few books on this Sun.
By the way, 5 years ago I had some of my lip removed. Why? The Sun caused my lip cancer, but the recent re-appearance of another suspicious spot on my lip in the same area, that was biopsied last week (ouch), turned out to be nothing but strange scaring from the initial removal of squamous cell carcinoma. I get to keep my lip.
Moral: Though the Sun, IMO, does not cause the long-term trends we see in GISS or short term fluctuations we see in raw data, it can indeed cause skin cancer. But not this time.
Landscheidt was also a great fan of the wide arrows “pointing” to coincidences ploy, which Lief comments on here. If you eliminate the gray bands which are directing your eye, there is not there there in Fig. 1. Svensmark is another one who shoots with wide arrows
Lief – “just as easy as to understand that a candle does not give light, but rather sucks up the dark. Just look at the wick.”
Funny Lief, that was a koan that my guru gave to me some 20 years ago. Thanks for solving it for me! 🙂
I think that anything the Sun produces, in terms of its affect on Earth, needs to be measured here, from the top of the atmosphere to below the ocean skin. SSN is a Sun-surface measure. Who cares in terms of the AGW debate. So for me, what I care about, in terms of relevance to climate, is what we can measure, coming from the Sun, that reaches us here. Then we can correlate that with temp and see if there is a connection. Given the extent of the noise in the temperature data, good luck finding a solar signal in the tiny span of years that make up our chaotic sensor data set.
On the other hand, I love learning about the Sun, but not in correlation to the Earth’s temperature concerns. I care about learning just about the Sun. It fascinates me beyond measure.
””’Pamela Gray (17:04:30) : . . . removal of squamous cell carcinoma. I get to keep my lip.”””
Congratulations on your successful medical procedure.
Maybe I need to reconsider my retirement idea of becoming a pagan sun worshiper? But I suspect it is too late for me to avoid consequences of sun damage to my skin given both my farming youth and also given decades of standing in the High Sierra sun flailing the rivers with my fly line. No regrets, whatever my skin does in the future.
John
HarryDinPT (14:15:11) :
Not sure if you have seen this, but here’s a link to a video on the status of the CLOUD experiment at CERN:
http://cdsweb.cern.ch/record/1181073/
It does not report on the status, except saying that the experiment has not started yet.
Alexander Feht (14:41:44) :
“The variation of solar energy DOES have an effect on our climate, namely 0.05K, or about 1/10 degree F.”
This would be correct if our Earth were a lifeless black body.
Fortunately, it is a biosphere that reacts to changes in solar activity in many ways, amplifying the primary effect.
This is not substantiated. In fact, it may be just the opposite: the Gaia hypothesis posits that the biosphere tires to keep the climate constant by damping changes. but I willing to wait for your proof of amplification, rather than just assertion.
Pascvaks (15:42:57) :
Have to ask:
If the Sun is pumping out
If the Sun is pumping out
If the Sun is pumping out […]
what’s the significance of …?
There has to be something “significant” about something relative to climate,
I suggest no significance [in the meaning of being significant] and also that your last statement is just wishful thinking.
Carla (16:32:36) :
The heliosphere is dominated by the supersonic solar wind that just blows all interstellar stuff away, unless it is neutral [dust] or highly energetic [cosmic rays], so there is very little [if any] influence inwards. It is like you exhale into a hurricane: that does not do much to the hurricane.
Pamela Gray (17:04:30) :
Oh my. Some of those questions….
indeed.
””””Leif Svalgaard (18:24:19) : [responding to Carla (16:32:36)]
The heliosphere is dominated by the supersonic solar wind that just blows all interstellar stuff away, unless it is neutral [dust] or highly energetic [cosmic rays], so there is very little [if any] influence inwards. It is like you exhale into a hurricane: that does not do much to the hurricane.””””
Leif,
Enjoy threads with you posting. Thanks for participating in what is sometimes a wild rodeo.
Question:
What do you think would be the general effect on the earth’s atmosphere if the earth was removed from the heliosphere.? In other words, as a thought experiment, what would be the basic atmospheric changes expected from removal of the earth from the existing heliosphere? Keeping everything else constant at what it is now.
John
Leif Svalgaard (18:24:19) :
Carla (16:32:36) :
Oh yeah, the new 3D Mapping project of the Local Interstellar Cavity affirms Linsky and Redfield on the heliosphere being in the transition zone between the warm local interstellar cloud LIC and the cooler denser G cloud. lol They did have to toss a Linsky, Redfield eh but not the GGGGGGG cloud. lol
The heliosphere is dominated by the supersonic solar wind that just blows all interstellar stuff away, unless it is neutral [dust] or highly energetic [cosmic rays], so there is very little [if any] influence inwards. It is like you exhale into a hurricane: that does not do much to the hurricane.
~
Not so fast with you. swt
It will be interesting to see the solar cycle 24 maximum exhale and blow out the system newly revised density level. (some exhaust recycling though huh).
Then to watch the downward trek into the next cycle inhale again. And the intake process ;begin again at the ahhh redesigned new starting point.
Whoa, just 0.05K??? Then how come the temperature variation between summer and winter where I live is around 20C?? When the key difference between the two seasons is the amount of solar energy recieved per square foot per day? If the changes in recieved solar energy between the seasons can alter land/atmospheric temperature that much in the space of 6 months then surely it follows that any other factors causing a change in recieved solar energy, whether it is the Sun’s own internal mechanisms/cycles, orbital changes in Earths distance from the sun and/or variations in the earths tilt must have a much more significant impact on global temperature than a fraction of 1 farenheit?
John Whitman (18:58:43) :
What do you think would be the general effect on the earth’s atmosphere if the earth was removed from the heliosphere.
You have to be specific about what you mean by ‘Earth’s atmosphere’. 100 km up where the density is 1/1000,000 that at the surface, there will be a less heating, but the change in heat content would be negligible because the air is so thin.
Carla (19:15:47) :
Then to watch the downward trek into the next cycle inhale again. And the intake process ;begin again at the ahhh redesigned new starting point.
These changes take place very far from the Earth so will not make any difference.
Colin M (19:41:38) :
Whoa, just 0.05K??? Then how come the temperature variation between summer and winter where I live is around 20C??
The difference between summer and winter is, say, 30% [depending on where you live]. Temperature goes with the fourth power of radiation, so a 30% change in radiation is approximately 30/4 = 7.5% change in temperature or 0.075*288K = 21.6K or 21.6C, close enough. That is why.
Carla (19:15:47) :
Leif Svalgaard (18:24:19) :
Carla (16:32:36) :
Oh yeah, the new 3D Mapping project of the Local Interstellar Cavity affirms Linsky and Redfield on the heliosphere being in the transition zone between the warm local interstellar cloud LIC and the cooler denser G cloud. lol They did have to toss a Linsky, Redfield eh but not the GGGGGGG cloud. lol
OOOOH I love it! Don’t stop now!
A rapidly spinning, weirdly tilted, ballish semi crusty thing with a seriously magnetic liquid center, screaming at unthinkable speeds around a massive largely unknown liquid/gaseous ball that explodes magnetic gases and flips magnetic poles in somewhat predictable cycles.
Orbiting elliptically, with a fantastic but slowly (?) retreating, solid moon sloshing all the water, making new life in the mangroves, with random comet tails dumping unknown amounts of water into the atmosphere , massive chunks of limestone crust being subsumed into the dynamic liquid core quite randomly, oceans sloshing madly trying to catch up.
Other massive gravitational bodies aligning themselves with the hot ball of gas yanking it into an unpredictable, chaotic orbit around the constant axis it would love to have but can’t quite. The Man Who Would be king.:)
But the sun is screaming through an orbit of it’s own, a small player, locked in place within a tiny galaxy where the only thing a human can possibly ever hope to see outside of with naked eye is the faint Andromeda galaxy? Deep in the desert on a very dark night.
Aw, c’mon. Have a bunch of little ones while you play with the math and physics. It’s all so chaotic and just so incredibly beautiful to behold in its complexity. The mystery is SO GREAT and life is so short. Never before have humans been able to expect their progeny would live to see even five years of age.
If all the two year old humans on earth vanished, the world would just stop turning and life would come to a sudden and dismal end.
Make hay while the sun still shines.
Eli Rabett (17:11:44) :
1. Svensmark is another one who shoots with wide arrows
Broad brushes tend to smudge the detail of the portrait,lets examine what you said at Willys place,
Oh yeah, if you look a little closer you see exactly how the pea is pulled out from under the shell. It’s the old Landscheidt wide arrow ploy. Look at the phases of increase, decrease and where the max/mins are. First of all, having to use a fourth order fit tells you that you need a lot of free parameters to fit a smoothed curve. Second, the big incease in cosmic ray flux is after 1970 when the temperature is flat.The increase in the temperature occurs when the cosmic ray flux is flat. Third, the curvature at ~1900 is an artifact of the fitting form which fools your eyes.
So you are arguing that
a) Temperatures in the sub polar and Antarctic regions are sparse and inhomogeneous ,I would suggest that arguments against that would be sparse.South of 55s prior to IGY,(1958) are essentially worthless.
b) That GCR has a trend since 1970 ? as your statement is neither clear or succinct, one cannot assertain what you mean ,do you?
Ignoring amplitude & other-timescale trends/oscillations, my interpretation of Piers Corbyn’s “60 year cycle”:
http://www.sfu.ca/~plv/100228.png