By Joseph D’Aleo, AMS Fellow, CCM
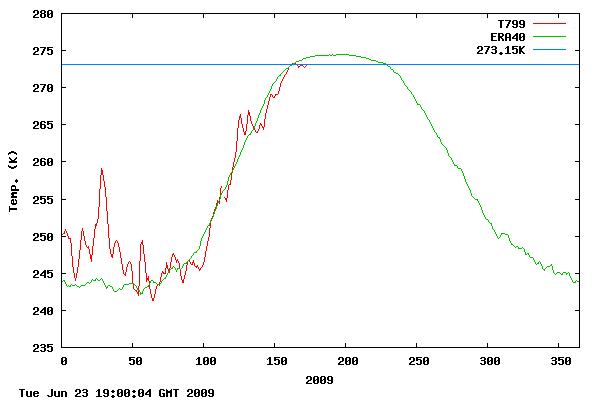
The average arctic temperature is still not above (take your pick) 32°F 0°C 273.15°K–this the latest date in fifty years of record keeping that this has happened. Usually it is beginning to level off now and if it does so, it will stay near freezing on average in the arctic leading to still less melting than last summer which saw a 9% increase in arctic ice than in 2007. H/T to FredM and MarcM

Data from DMI (Danish Meteorological Institute)
See larger image here. Compare with DMI charts in other years here.
[NOTE: as a second source to Joe’s article I’ve added this weather station data from the “North Pole Cam” operated by NOAA. Link is here: http://www.arctic.noaa.gov/gallery_np.html
There is a webcam at the “North Pole” (at least it starts out very near there) that reports via satellite data uplink at regular intervals. They also have a weather station with a once weekly data plot. Note it is still below zero centigrade there.

Latest data (updated approximately weekly) Readers should note that the station really isn’t at the north pole anymore due to significant ice drift. – Anthony ]
The AMSR-E shows the ice situation on June 23rd:

See where we stand relative to recent years in terms of total extent here. We are using JAXA-IJIS AMSR-E data to track ice as NSIDC is using older satellites and the new director Mark Serreze has proven untrustworthy. The next two months will be interesting. Temperatures usually begin flatlining in late June which would suggest less ice loss, although the water temperature beneath plays a key role and all of the warm water that entered the Arctic when the Atlantic was very warm in the middle 2000s (now is nearer normal) may not have circulated out yet.
The other question is what effect the early spring Mt. Redoubt eruptions may be having. Are the sulfate aerosols trapped in the arctic stratosphere reflecting back some of what sunlight reaches the high latitudes?

Along the edge of the arctic, Ross Hays who worked for CNN and then NASA who last year posted from Antartica sent this note to me “They have me working in arctic Sweden until mid July. One of the Esrange staff members told me that so far Kiruna had had the coldest June in 150 years!”
See PDF here.
Flanagan (13:49:10)
Hey, it was your data set, want to provide with a larger one (or show me where I can go get one) and I’ll give you a more detailed analysis. I’d certainly love to analyze a dataset that included the early 1900s so that we could begin to be looking at a dataset that was large enough to provide a bit of perspective. As it is, we don’t even know what we don’t know.
Anyway, bottom line is that the data you provided did not back up what you were saying.
Bill Illis:
Congrats. Going through this thread I was beginning to wonder if nobody was aware that dear Flanagans “warm water” is actually below 0 centigrade.
As a matter of fact the ice sometimes grows thicker in early summer when fresh water from snowmelt seeps down and re-freezes on contact with the subzero salt water.
Bill Illis (15:11:51) :
The ocean has some very interesting characteristics around the -2.0C to 1.5 temp range. Water is a very strange chemical. Most chemicals just become more and more dense as they get colder. Not water.
Seawater does however, the maximum density is at the freezing point, typically -1.9ºC.
juan (15:27:11) :
Kevin, Merrick, et al,
“Actually, we don’t say, “degrees Kelvin.” The Kelvin is a unit, not a degree, so it’s 273.15 K.”
Got no problem understanding that “kelvin” is a unit, not a scale. Not so sure about “Kelvin” (with upper case ‘K’). How do you read it? “273 Kelvin”? “273 kelvins”?
“273 kelvins Kelvin”? (by analogy with 32 degrees Fahrenheit)
John the Linguist not the Physicist
It’s 273 K which is the abbreviation for 273 Kelvin, the proper abbreviation being K to avoid confusion with the lower case k which is the prefix for ‘kilo’. So the statement: “The temperature was 273 Kelvin.” is linguistically correct just like saying “The length of the bar was 1.2 meters.
only_truth (14:40:00) :
Don’t curse the triple digits, bless them. The thermals generated play a key role in monsoon rains. A good temperature range for Phoenix in regards to producing the monsoon storms seems to be about 100° to 108°F. Here in Tucson the range seems to be a bit lower.
The rising hot air from the desert floor will create a thermal low (pressure) area. Hence, when the clouds are moving in, its hot, and the humidity is uncomfortable; watch the barometer. If the pressure is falling…. good chance of a storm, falling rapidly… possible strong storm, not falling… most likely a dry run. Naturally watch the dew point as well.
Some stats for you:
The wetest Monsoon on record: 9.38 in 1984
The driest Monsoon on record: 0.35 in 1924
The earliest Monsoon Start: Jun 16th, 1925
The lastest Monsoon Start: Jul 25th, 1987
Greatest number of Monsoon Days: 99 in 1984
Least number of Monsoon Days: 27 in 1962
Those are actually some interesting numbers and dates.
Keep in mind that with a negative – PDO, +AMO , and state of the ENSO we should be expecting a drier than average season.
Flanagan (13:37:58) : Mr Smith: well tried, but you won’t catch me misunderstanding thermodynamics. When ice melts, a lot of heat from oceans is used, which tends to cool sea surface temperatures. This, in turn, will in any case modify the flow of heat between water and air in the favor of liquid water. All in all, the surrounding atmopshere will tend to cool.
Well Flanagan you’ve taught me something. I notice you prelude your science with “you won’t catch me misunderstanding thermodynamics”. In future when I see other AGW’s using a similar prelude, like “we are committed to transparency” I shall now hear it as a wool-over-eyes-pulling announcement, nicely dividing the appeal-to-authority sheep from the think-for-yourself goats.
Scott, Flanagan and Shawn
Below is an extract from my recent article -carried here- on arctic ice variation for the last several hundred years. The last three links towards the end show records of arctic ice levels dating to 1760
Extract;
“A new book contains the following extract;
http://www.arctic-heats-up.com/chapter_7.html
Comment by author; Although Polyakov et al. meanwhile published their recent findings (as follows):
“We document through the analysis of 2002-2005 observational data the recent Atlantic Water (AW) warming along the Siberian continental margin due to several AW warm impulses that penetrated into the Arctic Ocean through Fram Strait in 1999-2000. The AW temperature record from our long-term monitoring site in the northern Laptev Sea shows several events of rapid AW temperature increase totalling 0.8oC in February-August 2004. We hypothesize the along-margin spreading of this warmer anomaly has disrupted the downstream thermal equilibrium of the late 1990s to earlier 2000s. (Polyakov, 2008);”
Comment by author:
‘It is astonishing a bit that the early Arctic warming has never seriously been evaluated in conjunction with the warm Atlantic Water branch before or at the time it enters the Polar Sea.’
IPCC do not mention the variability and movement of the Gulf stream as being a major factor, and the studies referenced above were too late to get into the latest assessment (even though the information has been around for nearly 200 years).
The full IPCC section on arctic ice in Assessment 4 is under.
http://www.ipcc.ch/pdf/assessment-report/ar4/wg1/ar4-wg1-chapter4.pdf
Page 352 graphic picture 4.10 shows a steady decline of ice from a high point in 1860, the exact time when contemporary observations were being made that the ice was increasing again following a long period of low levels. So if you were to incorporate that sharp dip in levels from 1815 to 1860 into the graph it would put the 60 year oscillations into a better context and the entire series would not be seen as a steady decline at all, but a series of peaks and troughs. The reconstructions given earlier in this article -and repeated under- provides a better understanding of clear evidence of an arctic oscillation.
The following is a modern day reconstruction of sea ice around Newfoundland from 1810 to 2000 demonstrating the huge variability (which compares with modern times) and perhaps illustrates the 60/70 year arctic oscillation amongst other cycles. (under the heading “195 years of sea ice ice off Newfoundland”)
http://www.socc.ca/cms/en/socc/seaIce/pastSeaIce.aspx
Even more remarkable in this relatively recent document (drawing on historic sources) are the annual indices of summer sea ice from 1750 to 1870 on page 122 fig2
http://pubs.aina.ucalgary.ca/arctic/Arctic38-2-121.pdf
This is an additional study;
http://acsys.npolar.no/meetings/final/abstracts/posters/Session_1/poster_s1_027.pdf
where researchers have looked at 44 ships log from around 1818 to 1910 and concludes;
‘the distribution and thickness of annual sea ice, monthly air surface temperatures, and the onset of melt and freeze were within the present range of variabilty. “ and that;
“paleoclimate reconstructions based on ice core stratigraphy suggest that exceptionally cool conditions prevailed in the 19th century. Analys of first hand observations such as monthly mean temperatures, the onset of the melt season and the onset of freezing are not consistent with the hypotheses. “
All the above certainly illustrate the post made by Shawn;
“Such major oscillations are part of a bumpy ride toward global warming,” said Thomas Karl of the National Climate Center. “For awhile at least this will be the shape of things to come.”
Tonyb
Neven (11:55:37) :
Jack, if you’d investigate that you would soon find that it was actually the Republicans who forced this change in description.
Ah yes, the old “they made me do it” routine that has surprising play as a “talking point” among warmers. Sounds a bit like a conspiracy theory to me, but I guess warmers don’t do those, do they?
Anyway, been there done that.
http://dotearth.blogs.nytimes.com/2008/09/19/windy-citys-climate-plan/?apage=2#comments
Relevant discussion starts at comment 42.
I left Dano with this bone to chew on, which I guess left him speechless:
I trust we won’t find you ever using that brainwash-induced-term, now will we?
John M (16:27:49)
First sentence should be a blockquote from Neven.
pyromancer76 (07:23:56) : Anthony, when the names of these Un-scientists are outed on your blog, would you be interested (in your spare time) in some kind of an Unscientist Dumb-A$$ Award?… The world should know who, EXACTLY WHO, is altering data, making up analyses, and, in effect, lying to us.
Phil. (12:16:46) : I hereby nominate Lord Monkton as the inaugural winner.
Cripes Phil, here I was thinking Monckton’s latest piece “Global Warming is no Global Crisis: major talking points” could be the starting-point of a well-referenced set of FAQ’s for AGW’s – a skeptic version of “how to answer a Climate Septic”. Please give me all the refs you can, showing how badly Monckton references his statements. I need to know.
Phil. might also be interested in the well deserved public spanking that Monckton gives to Gavin Schmidt: click
[OTOH, Gavin probably secretly enjoys it. Win-win.]
Am I having a complete “brainlock,” here, or shouldn’t 06-23-08 be compared to 06-22-09?
If I’m “Crazy” be gentle (yesterday, I was trying to claim it was Thursday.)
“a skeptic version of “how to answer a Climate Septic””
Why would we want a version of a set of rhetorical arguments designed to disguise the true issues, and containing false facts. Last time I checked, they were claiming that the climate never changed in Greenland during the MWP, despite the extensive contemporaneous writings on the subject from across Europe, not to mention ice core data.
I think their basic advice was to shout louder if you weren’t getting through to a skeptic. Maybe the site has improved, but I ain’t going back to find out.
@Kum Dollison
There taking into account leap year.
Kum Dollison (17:26:55) :
Am I having a complete “brainlock,” here, or shouldn’t 06-23-08 be compared to 06-22-09?
If I’m “Crazy” be gentle (yesterday, I was trying to claim it was Thursday.)
No, 06-23-08 was the 175th day of the year whereas 06-22-09 was the 173rd day of the year.
Yeah, so am I. You added a day at the end of 2008. Wouldn’t you subtract one from the beginning of 09?
Lucy Skywalker (16:39:36) :
Phil. (12:16:46) : I hereby nominate Lord Monkton as the inaugural winner.
Cripes Phil, here I was thinking Monckton’s latest piece “Global Warming is no Global Crisis: major talking points” could be the starting-point of a well-referenced set of FAQ’s for AGW’s – a skeptic version of “how to answer a Climate Septic”. Please give me all the refs you can, showing how badly Monckton references his statements. I need to know.
That’s easy, he doesn’t reference them at all!
Nah, I just realized, the best is to go out 365 days from the 23rd of June, 08; and that would be 23 June 09. Just can’t do anything with that 1/4 day.
Change is opportunity in disguise. Let’s forge forward and truly leave the 20th century in our dust! In the meantime let’s not wreck every ecosystem in our wake — especially the few remaining old growth forests in the Pacific Northwest.
http://DrReese.wordpress.com
Bob Kutz (14:32:47) :
But go on, tell me more about how coconuts migrate then.
African swallows (laden, of course). They grasp them by the husk when they migrate.
And you have just beautifully demonstrated the typical AGW proponent argumentative style. Namely cherry-picking and taking a statement totally out of context to buttress the rest of your weak argument.
My statement was in specific response to:
My comments were specifically about Flanagan, his stated beliefs (made clear here and on other blogs), and the typical result based upon experience of what happens when reasonable people attempt to discuss climate with him.
BTW — When did Flanagan become a reliable paper, let alone a voice of scientific authority?
You, like Flanagan often does, are using argument from authority, yet another AGW proponent argumentative technique and logical fallacy.
I give Flanagan credit for being generally polite and avoiding ad hominems even when others occasionally throw them at him (I’m certain that’s why Anthony allows him to post here). He’s also usually wrong and often demonstrates weak understanding of the studies he’s putting forth to support his position, but that’s ok even if annoying and requiring endless tail chasing.
You mean I should be reading reliable papers like the recently falsified Steig Antarctica study that was published in the vaunted peer-reviewed “Nature” in January? The study where the vaunted and incestuous referees failed to recognize that the base data was flat wrong, but a blogger caught it within days of publication? (The British Antarctic Survey corrected the data about three weeks after publication.) The same Steig study that has so many statistical problems and methodological errors that an “amateur” was able to falsify it? The same study that the great and all-knowing Gavin Schmidt could no longer reasonably defend over on “Real Climate” that he simply killed the thread? Puleeeze!
Blogs like this one are far more scientific, polite and welcome well-reasoned and even poorly reasoned counter-argument than your side provides. So-called “reliable scientific” blogs like Gavin Schmidt’s “Real Climate”, Tamino’s “Open Mind”, Joe Romm’s “Climate Progress” are flat anti-intellectual. Blogs like this one provide links to our opponent’s blogs, your side does not. Many of us here have been banned from the aforementioned “reliable scientific” blogs, not for breaches of etiquette, but for disagreeing with the “high priests” and daring to present reasonable counter-arguments. (We mustn’t confuse the masses, you know.)
Whereas Gavin, Tamino and Romm allow any amount of scurrilous comment, invective and ad hominem directed against a skeptic; Anthony, Steve McIntyre and the higher-profile blogs on our side usually snip, and in extreme cases, ban commenters who do the same towards AGW proponents.
Finally, you know nothing about me. You have no idea what I’ve read. I suspect, based on your inane comment, that I have more AGW proponent studies by people like Mann, Hansen, Schmidt, Santer, Kiehl, Trenberth and others on my hard drive than you’ve ever read.
Don’t lecture me about what I should be reading when you don’t know me.
This concludes my rant.
Joe Miner (13:59:48) :
We are talking about the JAXA graphs here, which is extent not volume. Nobody knows accurately the volume of ice melt in 2007 compared to 2008 so it is rather pointless bringing it up.
Regards
Andy
Lucia: err, could you point me where I was wrong exactly? In any case, this experiment is quite easy to do. Just put some ice cube in a glass half-filled with (salty if you like) water and measure the temperature of the air above it while it’s melting. Remember also people where “teaching” me and other how we were wrong to say CO2 couldn’t solidify in the Antarctic. Ice pumps heat from water when it melts, water slightly cools and atmosphere is kept at a very low T.
Don’t forget that thermal equilibrium would mean here that nCpDt should be equal – and the heat capacity of aire is very low, implying large vairations in T. Of course, this is an open system so differences in pressure will remove the cold air if warmer air s not far.
REPLY: Flanagan, wrong blog/thread, go to bed and quit bothering us here with insomniac thinking – Anthony
Flanagan’s original hypothesis that the lower Arctic temperatures are due to more melting ice is complete bunk and absolutely unprovable.
All one has to do is look at the Arctic temperature record. According to Flanagan, during times of rapid ice loss, Arctic temperatures should have cooled. This is NOT apparent in the record at all. Start with 2007.
NSIDC have commented before on the effect that Flanagan was talking about, or at least one part of it.
http://nsidc.org/arcticseaicenews/2008/111008.html
So I wouldn’t write him off too fast.
Regards
Andy