That is a total of 365,000 high temperature records and 365,000 low temperature records. During the second year of operation, each day and each station has a 50/50 chance of breaking a high and/or low record on that date – so we would expect about 182,500 high temperature records and about 182,500 low temperature records during the year.
In the third year of the record, the odds drop to 1/3 and the number of expected records would be about 121,667 high and low temperature records.
In a normal Gaussian distribution of 100 numbers (representing years in this case,) the odds of any given number being the highest are 1 out of 100, and the odds of that number being the lowest are also 1 out of 100. So by the 100th year of operation, the odds of breaking a record at any given station on any given day drop to 1/100. This mean we would expect approximately 1000 stations X 365 days / 100 years = 3,650 high and 3,650 low temperature records to be set during the year – or about ten record highs per day and ten record lows per day.
This provides the news media lots opportunity to get hysterical about global warming every single day – even in a completely stable temperature regime. The distribution of temperatures is Gaussian, so it won’t be exactly ten per day, but will average out to ten per day over the course of the year. In a warming climate, we would expect to see more than 10 record highs per day, and fewer than 10 record lows per day.
In a cooling climate, we would expect to see more than 10 record lows per day, and fewer than 10 record highs per day. The USHCN record consists of more than 1000 stations, so we should expect to see more than 10 record highs per day. Throw in the UHI effects that Anthony and team have documented, and we would expect to see many more than that. So no, record high temperatures are not unusual and should be expected to occur somewhere nearly every day of the year. They don’t prove global warming – rather they prove that the temperature record is inadequate.
No continents have set a record high temperature since 1974. This is not even remotely consistent with claims that current temperatures are unusually high. Quite the contrary.
| Continent | Temperature | Year |
| Africa | 136F | 1922 |
| North America | 134F | 1913 |
| Asia | 129F | 1942 |
| Australia | 128F | 1889 |
| Europe | 122F | 1881 |
| South America | 120F | 1905 |
| Antarctica | 59F | 1974 |
http://www.infoplease.com/ipa/A0001375.html
Here is the code discussed in comments:
// C++ Program for calculating high temperature record probabilities in a 100 year temperature record

// Compilation :  g++ -o gaussian gaussian.cc

// Usage : ./gaussian 100

#include <iostream>

main(int argc, char** argv)

{

int iterations = 10000;

int winners = 0;

int years = atoi(argv[1]);

for (int j = 0; j < iterations; j++)

{

int maximum = 0;

for (int i = 0; i < years; i++)

{

maximum = std::max( rand(), maximum );

}

int value = rand();

if (value > maximum)

{

winners++;

}

}

float probability = float(winners) / float(iterations);

std::cout << "Average probability = " << probability << std::endl;

}
Discover more from Watts Up With That?
Subscribe to get the latest posts sent to your email.
Leif, how does that affect the analysis? Would one then expect to find records in spatial and temporal clusters? Extended periods in given locations with few or no records at all? A “lumpier” distribution of records?
Ed says: “Nature is the norm…”
Now I don’t think anyone doubts that at all. The point is whether precautionary action should be taken to avoid terrible effects. Picture this: a 10km wide asteroid headed straight for Ed’s house (be that where it may). Though on geological times scales, this is absolutely normal, would Ed be standing in his garden beneath the growing shadow, uttering “Nature is the norm…” I think not. At the first hint of a possible collision, hopefully months to years prior, earth’s residents will be working on a solution to prevent the impact. This ain’t the Cretaceous any more and, maybe, we finally have a choice of whether or not to enter forseeable extinction events.
[snip]
Reply: Seriously, thou shalt not insult other posters or our host, (although clever and extremely subtle innuendo may be acceptable) or entire posts will be deleted from now on.
I have spoken. ~ charles the moderator.
Robert (16:30:16) : Not much inbound IR from the sun.
“Everyone is entitled to his own opinion, but not to his own fact”—
Daniel Patrick “Pat” Moynihan
DR (17:49:55) :
Q: Heat Waves in Southern California.
Are They Becoming More Frequent and Longer Lasting?
A: Sure. And we know why.
http://wattsupwiththat.com/2008/08/23/how-not-to-measure-temperature-part-69/
[Let us know when you have something you would like to contribute or we’ll just delete, your choice and ours ~ charles the moderator]
[sorry db, I’m being more agressive than you ~ ctm]
The number of record highs is not really changing the average temperature but the changes in the number of record lows and as been said above the number of record high lows. I plotted out the 10 and 30 year monthly highs and lows for the central england temperature (CET) record. See link below. The level of the monthly lows really raised in recent years but the highs were pretty typical of the whole record. The plot shows the highest or lowest monthly anomaly for a running 10 or 30 year span. Note this has also been adjusted to remove the long term temperature rise of 0.26°C per century.
http://gallery.me.com/wally#100002/CET%20max%20min%20residuals&bgcolor=black
Gary Hladik (18:45:11) :
Leif, how does that affect the analysis? Would one then expect to find records in spatial and temporal clusters? Extended periods in given locations with few or no records at all? A “lumpier” distribution of records?
To find out, one should find [by cross correlation] at what distance between them stations are ‘independent’ in space and similar in time. Then base the analysis on those numbers. I don’t know precisely what they are except that [certainly for time] they are such as to invalidate the analysis. People in the business of analyzing weather station [Anthony?] siting know what those numbers are. A similar analysis was done a long, long time ago for sunspot numbers taken every day. Over a cycle there are ~4000 such numbers, but the number of independent values is only ~20. So to base the ‘error bar’ or occurrence probability on 4000 values rather than 20 leads to very wrong conclusions.
In dealing with records (snowfalls at a particular location, floods on a given river, etc) under the assumption that they are randomly distributed, you can take, say 200 years of data and labelling the first as a record, there should be Ln200 records broken during the 200 year period – about 5. I explained this calculation on another post (concerning flooding on the Red River of the North) and did a calculation on the data over 150 years or and came out with 5 which was the actual answer and demonstated the probability of the number of records for the period to be statistically normal. One reader criticized my calculation saying that …sure 5 may be what you would expect but you wouldn’t expect 2 records to fall within 10 years of each other… naturally the nature of randomness doesn’t bar two records being close together. Now I know there are factors out there that one can point to to show that such data won’t be random ( various cyclic oscillations etc.) but on the right scale, these are muted. In any case, if there is a looming inexorable change occurring, then the records should greatly exceed Ln N, if not, maybe we don’t have that much to worry about.
The discussion of record highs got me wondering if more GHGs lead to lower high temperature records.
Near sea level in my zip code in perpetually-humid Fort Lauderdale, the record high temps for July and August only have 1 day over 100 degrees. Most record high temps are in the 97-98 area. This from Weather Underground calendar view for July and August.
A few hundred miles north (and much farther west) where I grew up in much drier Dallas Texas, July and August have record highs above 100 for almost every single day.
So, do greenhouse gasses prevent warming? Places with less water vapor in the air (Dallas) get much hotter in summer time.
Its telling to look at the temperature ranges. Calendar view shows similar average low temperatures in both places, but lower average highs in Fort Lauderdale than in Dallas.
Wasn’t C02 supposed to have a positive feedback relationship with water vapor? Isn’t that the single most important mechanism in the AGW hypothesis? More C02 means more water vapor means more heat?
And yet, it looks to me like more water vapor, the most important GHG, leads to lower high temperatures. What gives?
Matt Bennett (18:31:03) :
“and the perfect unchanging climate (which our AGW friends imagine used to exist before they were born.)”
..and immediately, you’ve lost me already. Erecting utterly disingenuous and ridiculous strawmen like that is par for the course here. Name one climatologist who (even in the last century) EVER thought that there was some kind of “perfect temperature” for earth (geared to which species??) and that the climate hadn’t been changing in perpetuity. Name one.
———————————
Matt,
On the assumption that you would like to take CO2 out of the atmosphere, I would further assume that the perfect climate for the AGWers is that which occurs at 285 ppm CO2 or thereabouts.
Maybe that sets the perfect temperature range. Why don’t you you tell us what we’re trying to achieve ?? I really wouldn’t mind knowing from someone who clearly has an opinion on this.
Serious question, by the way.
The high temperature at whatever time it was taken is not the high temperature for that day. Temperature records made and broken are an artifact of the study design (said with a large grain of salt). I wouldn’t be able to get through the door with a dissertation study design similar to what is currently in place to report record temps.
Leif, Roger,
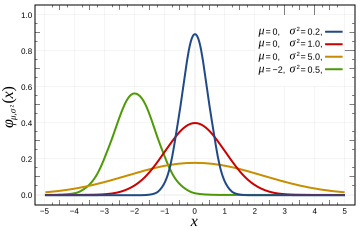
Temperatures at a location are typically thought of being represented as a Gaussian distribution. Here is an empirical example:
http://folk.uib.no/ngbnk/kurs/notes/node28.html
The odds of a record high at any given station on any given day in a hundred year record are 100/1. It doesn’t make any difference how many stations you have. Does the total number of craps tables in Vegas affect your odds at any particular one of them? Of course not.
Matt,
Mann’s hockey stick is based on a 1,000 year stable climate – until you purchased an SUV.
Matt Bennett (18:31:03) : “Name one climatologist who (even in the last century) EVER thought that there was some kind of “perfect temperature” for earth (geared to which species??) and that the climate hadn’t been changing in perpetuity. Name one.”
Oh, I dunno – Mann, maybe? He still insists that Earth’s climate was near as dead flat as any experimentally measured process can possibly be – flat through the historically confirmed worldwide Roman and medieval warm periods, flat through the dark age that killed a sizable proportion of humanity through cold and crop failures and flat through the little ice age when they held winter events on the frozen Thames, until it suddenly started increasing recently. And taken in conjunction with the hysterical pronouncements from his camp about tree deaths and so on due to factions of a degree temperature change, I’ll agree the point was put snidely, but basically fair I think. To be a straw man, the argument of one’s opponent has to be put in a deliberately weak manner. The characterisation given in the article was derisory, but given that it is only the tenth part of the hysterics from the AGW crowd, it certainly is not deliberately weak. Furthermore, the argument that followed did not hinge upon any feature of the alleged straw man. The argument works perfectly well even if the climate does vary, and by quite a lot. So the straw man allegation fails.
A more serious problem seems to be the working out of probabilities. After two random measurements, is it indeed p=1/3 that a record high will next be recorded? I’d want a statistician to comment on that. Statistical distributions are funny things and a lot of ‘obvious’ properties aren’t properties at all.
Matt Bennett (18:31:03) : “Erecting utterly disingenuous and ridiculous strawmen like that is par for the course here. Name one climatologist who (even in the last century) EVER thought that there was some kind of “perfect temperature.”
Matt, therein lies part of the issue — they won’t tell us what the goal is. There is no target or even a desired stasis. We are, right now, in roughly similar condition as existed in the early 1980s as measured by global average temps, ice extents, cyclonic energy, and all the other metrics.
One thing is for sure, they keep telling us that it is warmer now than ever in history or that the Arctic ice cap is melting faster than ever in history. The presumption is, therefore, the perfect temperature is something cooler than now, yet here we are cooler than more than a decade ago.
In January of 2000, the US Weather Service released a report that said 1999 was the warmest year since the organization had been keeping data. The media picked up the story and announced that 1999 was the warmest on record. Then candidate, Al Gore took it a bit further by saying 1999 was the warmest year in HISTORY! Mr. Gore’s statement is true only if his notion of history goes back only to the beginning of the data set he accepts — ironically one that began roughly 33 years after the establishment of the office he sought. As one who uses historical climate in my academic work, I know for an empirical fact that it was distinctly warmer than now during at least four extended periods since the development of an agrarian culture six thousand years ago (a better notion of history than Mr. Gore’s 1817 beginning of history).
The AGWers are not happy with the present condition or the cooling trend nor do they identify what their goal is. Why? Because it has NOTHING to do with the climate. The goal is, and always has been, the carbon tax. President Obama has $800 billion of carbon tax as a key element in his budgets going forward. Without that source of revenue, his most expensive agenda items would not have a chance.
Matt Bennett (18:31:03) :
“and the perfect unchanging climate (which our AGW friends imagine used to exist before they were born.)”
..and immediately, you’ve lost me already. Erecting utterly disingenuous and ridiculous strawmen like that is par for the course here.
Well, the implicit assumption behind a complaint that we have an anomaly in our present temperature is that there is a non-anomalous benchmark (often held out as some global average of a prior period of time). That sure sounds to me like an expectation of a perfected standard of climate that does not change …
If there is no benchmark standard, then there can be no anomaly, and we can all go home since there is no anomalously high temperature and no climate change…
Name one climatologist who (even in the last century) EVER thought that there was some kind of “perfect temperature” for earth
Hansen. He makes the anomaly maps, which by definition mean he has some non-anomaly state in mind as his benchmark. He regularly rants that we are too anomalous to the high side, which means he thinks we have a perfected temperature at zero anomaly. QED.
The IPPC. They state that we need to do lots of things to get the anomaly back down to zero; ergo they think it is the perfected temperature.
Repeat for any / all AGW advocates who think that the anomaly measurement in appropriate and that we need to do something to reduce it toward zero.
You are erecting on knocking down views that have never existed.
Nope. Presenting them with a bit of emotion and maybe a smidgeon of hyperbole, but relatively accurately presenting the notion behind the AGW anomaly rants. (That the anomaly means something relative to some non anomalous ideal). If the non anomalous ideal is variable, then please inform us what the formula / function looks like so we can incorporate this rubber ruler into our expectations…
How intelligent.
I thought so too.
“A wx stn can be made hotter than the “true” temp, but it is all but impossible to make it colder. Yes? ”
I don’t know, Clive. Plant a shade tree behind it and see what happens….
Steven Goddard (19:17:02) :
Temperatures at a location are typically thought of being represented as a Gaussian distribution.
Here is an empirical example:
http://folk.uib.no/ngbnk/kurs/notes/node28.html
If you divide the data into two half [1st and 2nd] they do not have the same mean [some refer to that as Global Warming] so are not drawn from the same distribution
The odds of a record high at any given station on any given day in a hundred year record are 100/1.
Not at all. The odds are not constant with time. If there is a general trend up [or down], then the odds for a record high at a later time is higher than at an earlier time.
It doesn’t make any difference how many stations you have.
But this statement of yours does:
“This mean we would expect approximately 1000 stations X 365 days / 100 years = 3,650 high and 3,650 low temperature records to be set during the year – or about ten record highs per day and ten record lows per day.”
Steve,
I did the same thing several months ago with US temperatures only. What I found was that 2/3rds of record high temperatures were recorded before 1950. If I remember correctly, record lows were about 50/50 distributed over the 1st and second half of the 20th century. I used 1950 as a good round number as it (roughly) divided the temperature record equally and, I figured, CO2 levels would be higher in the latter half of the century. All things being equal, I’m certain that there were fewer recording stations in the first half of the century, (especially in western states).
My thought was that “global warming” would create higher highs and that a greater number of high temperature records would be broken post 1950 than before……that isn’t the case.
Many variables/factors left out, but still a neat exercise.
“And yet, it looks to me like more water vapor, the most important GHG, leads to lower high temperatures. What gives?”
I have often wondered myself if water vapor reflects energy from the sun even when clouds aren’t formed. I would love to have the time to find out, but that is just not possible for me right now. Anyone else know?
Bill Illis (17:17:20) :
“Robert (16:30:16) :re: crosspatch (16:12:01) :“No, it would not cause higher high temps because CO2 would also block inbound IR from the Sun during daytime.”
Not much inbound IR from the sun.”
But the extra CO2 would block the extra IR trapped/coming downward from other extra CO2 molecules from above.
Something the AGW community never talks about. How does the extra IR trapped by CO2 make it back to the surface with all those IR intercepting CO2 molecules in the way.
Most of the IR is coming upward from the earth, not downward from the sun, and it’s radiating day and night. As I understand it from other threads, most of the CO2 trapping occurs very near the surface, holding the heat down where the thermometers are.
Anthony,
Speaking of record temps :
Is there an update on the record cold in Edmonton, Canada from some weeks ago that you were going to get confirmation on? Was the record cold temperature really broken by -12 C degrees? I had read it was broken by -14 C degrees.
The story about Edmonton from here at WUWT :
http://wattsupwiththat.com/?s=edmonton
Ohioholic (19:49:07) :
“And yet, it looks to me like more water vapor, the most important GHG, leads to lower high temperatures. What gives?”
I have often wondered myself if water vapor reflects energy from the sun even when clouds aren’t formed. I would love to have the time to find out, but that is just not possible for me right now. Anyone else know?
Water vapor, before acquiring enough density as to form visible clouds, absorbs and scatters photons from any photon stream which is hitting on it. Mie’s theory permits the estimation of photon dispersion by almost all kinds and sizes of particles.
Ohioholic (19:49:07):
To say the truth, scattering and reflectivity of photons by clouds are not well understood processes.
Comparing infoplease’s highest and lowest record tables, we have:
Continent Warmest Record Coldest Record
Africa 1922 1935
N America 1913 1945
Asia 1942 1933
Australia 1881 1994
Europe 1881 unknown
S America 1905 1907
Antartica 1974 1983
Asia seems to be the only continent known to have a coldest record earlier than a warmest record, but realize that the coldest Asian record was in Oimekon, Russia, whereas the warmest Asian record was in Israel!