That is a total of 365,000 high temperature records and 365,000 low temperature records. During the second year of operation, each day and each station has a 50/50 chance of breaking a high and/or low record on that date – so we would expect about 182,500 high temperature records and about 182,500 low temperature records during the year.
In the third year of the record, the odds drop to 1/3 and the number of expected records would be about 121,667 high and low temperature records.
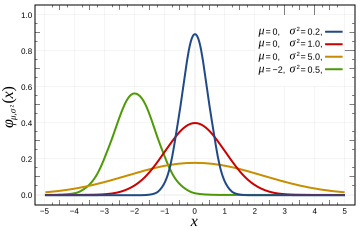
In a normal Gaussian distribution of 100 numbers (representing years in this case,) the odds of any given number being the highest are 1 out of 100, and the odds of that number being the lowest are also 1 out of 100. So by the 100th year of operation, the odds of breaking a record at any given station on any given day drop to 1/100. This mean we would expect approximately 1000 stations X 365 days / 100 years = 3,650 high and 3,650 low temperature records to be set during the year – or about ten record highs per day and ten record lows per day.
This provides the news media lots opportunity to get hysterical about global warming every single day – even in a completely stable temperature regime. The distribution of temperatures is Gaussian, so it won’t be exactly ten per day, but will average out to ten per day over the course of the year. In a warming climate, we would expect to see more than 10 record highs per day, and fewer than 10 record lows per day.
In a cooling climate, we would expect to see more than 10 record lows per day, and fewer than 10 record highs per day. The USHCN record consists of more than 1000 stations, so we should expect to see more than 10 record highs per day. Throw in the UHI effects that Anthony and team have documented, and we would expect to see many more than that. So no, record high temperatures are not unusual and should be expected to occur somewhere nearly every day of the year. They don’t prove global warming – rather they prove that the temperature record is inadequate.
No continents have set a record high temperature since 1974. This is not even remotely consistent with claims that current temperatures are unusually high. Quite the contrary.
| Continent | Temperature | Year |
| Africa | 136F | 1922 |
| North America | 134F | 1913 |
| Asia | 129F | 1942 |
| Australia | 128F | 1889 |
| Europe | 122F | 1881 |
| South America | 120F | 1905 |
| Antarctica | 59F | 1974 |
http://www.infoplease.com/ipa/A0001375.html
Here is the code discussed in comments:
// C++ Program for calculating high temperature record probabilities in a 100 year temperature record

// Compilation :  g++ -o gaussian gaussian.cc

// Usage : ./gaussian 100

#include <iostream>

main(int argc, char** argv)

{

int iterations = 10000;

int winners = 0;

int years = atoi(argv[1]);

for (int j = 0; j < iterations; j++)

{

int maximum = 0;

for (int i = 0; i < years; i++)

{

maximum = std::max( rand(), maximum );

}

int value = rand();

if (value > maximum)

{

winners++;

}

}

float probability = float(winners) / float(iterations);

std::cout << "Average probability = " << probability << std::endl;

}
Okay, I’m game. Let’s put this thing though the ringer.
I have records for my rural area back to 1894 (skipping 1895-1912)
That make 94 years of record.
Going back 1/3 from 2006 to 1975 (31 yrs) I have 102 Maximum Lows.
That’s 102/365 = .279, far short of an AGW trend.
Same year stretch I have 123 Maximum Highs.
That’s 123/365 = .336, just right for Gaussian but no AGW Cigar.
Hey, this is fun.
Working the other way, from 1894 to 1943
I have 200 Maxium Highs.
That’s 200/365 = .548 . Whew, was it hot back then or is it just me?
I have 183 Maximum Lows.
That’s .501 . Oh man, the nights for 1912 to 1943 were balmy, blimey.
Sorry folks, no AGW here.
Sorry, Gore, that’s the way the CO2 bubbles.
Hansens is a soda, did you know that?
Oh, before I forget, 1895 to 1912 is missing from our records. Seems thieves hit main st. and stole all the thermometers in 1895.
I really do have 94 years of record.
Thanks for that post, Steve! You are rapidly becoming my second favorite climate guide (after Anthony, of course). Sorry about that, Al and Hansen.
The North American record high temperature record will eventually be broken….
….just as soon as another rusty trash-burning barrel or BBQ is placed close enough to a Stevenson screen.
Leif,
Please read the article more carefully before commenting. The article says:
The total number of craps tables affects the total number of winners, but it does not change the odds at any particular craps table. Likewise, the more stations you have, the more records will be set.
Work through this simple exercise.
The first year of the record, there is of course a 100% probability of setting the record high. The second year, there is a 50/50 probability. the third year, there is one chance out of three. etc. This is a defining characteristic of a Gaussian, as in the temperature distribution in Bergen.
http://folk.uib.no/ngbnk/kurs/notes/node28.html
Steven Goddard wrote: ” No continents have set a record high temperature since 1974. This is not even remotely consistent with claims that current temperatures are unusually high. Quite the contrary.”
And almost all of these all-time continental temperature maxima occurred WELL before urban heat islands could be blamed. In fact, these observations were taken way back in a time when observations had a great degree of sanity and were not located next to airport runways [as Anthony argues many times on here].
Great work, Steven.
Chris
Norfolk, VA, USA
Speaking about temperatures:
US aplogizes for Global Warming!
http://www.climatedepot.com/a/486/US-apologizes-for-global-warming-Obama-administration-issues-mea-culpa-on-Americas-role-in-causing-climate-change
Idiots.
Pieter F (19:26:21) : “President Obama has $800 billion of carbon tax as a key element in his budgets going forward. “
A tax pure and simple, the budget tables list the anticipated “climate revenues” at $646 billion. Senior White House staff later revised that estimate upward, to a range of $1.3 trillion to $1.7 trillion in the first eight years.
Has anyone factored in all the badly sited weather stations and tried to make an adjustment for the UHI effect on those sites?
Such a map would probably be far different than those preferred by the warming alarmists.
In all fairness, I have to (very reluctantly, kicking and screaming) concede that if my statistics are right, UHI is accounted for reasonably in USHCN1.
Perhaps not in USHCN2, which method is shrouded in mystery and doubletalk.
I have the USHCN raw trend data for USHCN. I averaged all the sites they rate as “urban”. The 100-year trend for those sites averages around 0.5C higher than non-urban. 9% of total sites are urban. They apply an adjustment of around -0.05C/century. This seems about correct.
I grant NOAA the assumption that their adjustment applies to the final total of all stations and not merely urban stations. Granting this, I must concede USHCN1 is probably more-or-less correct.
Now, there may be a problem concerning what they consider to be urban. And there is the “exurbanization” factor to contend with. That maight throw a wrench in. But presuming that their parameters are sound (and they may be), their adjustment is about right.
HOWEVER, as for “badly sited” stations . . . bad in a microsite sense, that is . . . well, that is a story for another day!
(He said with an air of great mystery and portent.)
My rural site is one of the better one’s on Anthony’s scale, and the first 31 yrs of my 94 of record beat the crud out of the last 31 yrs.
Totally wipes the floor.
The only thing abnormal I see is the decision to close down most of the rural stations in favor of heat island ovens.
it ain’t C02, baby, it’s your concrete & asphalt jungle fever.
Developer diptheria.
David LM (17:53:50) David, here in western Colorado, the higher the elevation, the colder it gets. The valley floors are always the warmest temps around. I assume this is due to the thinner atmosphere allowing more heat to escape. More IR in and more IR out on a daily basis, the thinner the air is.
Dan Lee (19:10:46) A similar effect to altitude, ie. the mass of the air. Less H2O, less mass and greater range of temperature day to night. One could also argue the proximity of a large body of water stabilizes temperature. An examination of the desert temperatures surrounding Lake Powell may be able to seperate the two. Lake Powell has about the same amount of coastline as California.
Steven Goddard Interesting perspective, thank you.
Steven Goddard (20:22:24) :
Work through this simple exercise.
The first year of the record, there is of course a 100% probability of setting the record high. The second year, there is a 50/50 probability. the third year, there is one chance out of three. etc. This is a defining characteristic of a Gaussian
Work through this simple exercise:
Assume that halfway through the 100 years there is a dramatic climate change [e.g. like the Younger Dryas] where the temperature jumps 15 degrees, then that year has almost a 100% chance of setting a record high, the second year after that has a 50/50 chance, etc. Now, if there were jumps halfway to the 50 years and to the 75 years, the same will be true for them, so the odds of records depends very much on the trend. So, at the end, we are not down to 1/100 chance.
Rubbing the point in as hard as I possibly can:
Double-digit record setting high years: Sleepy No. CA town pop 3000
1918 – 10
1919 – 17
1920 – 12
1926 – 10
1929 – 23
1932 – 19
1936 – 16
1939 – 11
1986 – 10
1987 – 12
1988 – 14
1991 – 15
Score is Wildcats – 8, Gores – 4
EvanmJones,
sorry, their non-urban sites include quite a few that should be rated urban. Kinda screws up exercises like yours!!
Robert and Mike McMillan,
“Not much inbound IR from the sun.”
Absolutely incorrect. Please do a simple Google search and educate yourself.
Direct sunlight has a luminous efficacy of about 93 lumens per watt of radiant flux, which includes infrared (47% share of the spectrum), visible (46%), and ultra-violet (only 6%) light.
From: http://en.wikipedia.org/wiki/Infrared
The earth radiates as a blackbody at about 280 K. The sun at about 5800 K. The power in the Earths spectrum is shifted into the infrared due to its low output. The Suns into the visible due to its much higher output. Now look at the bottom chart on this page:
http://marine.rutgers.edu/mrs/education/class/josh/black_body.html
Notice the NOTE below it. Yes, you read it right. The earths spectrum, to be seen on the chart in comparison to the sun, is magnified 500,000 times!!!!! You may have seen similar comparison charts with the earth spectrum as high as the suns and a passing mention that it has been adjusted for comparison. Did you wonder by HOW MUCH??? Now you know!!
I am not sure where this myth came from, BUT, the sun outputs PLENTY of IR!!!! The fact that most of it is absorbed in the upper atmosphere probably helps continue the myth.
This site has an interesting graphic showing what wavelengths of the sun reaches the ground. Ever see this represented in the Energy Budget Cartoons?
http://www.windows.ucar.edu/tour/link=/earth/Atmosphere/earth_atmosph_radiation_budget.html
Didn’t think so. They are all WRONG!!!!!! Maybe not by a large amount, but, enough. Note: you’ll be doing yourself a favor if you ignore the Greenhouse propaganda printed on this page. They still believed a real Greenhouse works because it “traps” IR!!!!
The real question I have, that hasn’t been answered, is how is this downwelling IR handled by the so-called reradiation physics of so-called GreenHouse gasses. Accepting that little IR from the sun directly reaches the surface, it would STILL get down by re-radiation just like the AGW crowd claims the Upwelling IR eventually makes it out to space after a delay in re-radiation!!!!! So, exactly how accurate are those cartoons that don’t even mention Sun downwelling IR and makes a big deal about all the Upwelling Earth IR that takes a LOOOOOONG time to get out????
As I said, they are CARTOONS!!!! I wonder if the Models have it???
Hey, any of you smart guys have a REAL answer??
Wow. This trivial math isn’t in the sourcebook already for local meteorologists?
Mike McMillan and Bill Illis
See my comment at 19:01:39
The solar radiation spectrum is shown here: http://physweb.bgu.ac.il/COURSES/Astronomy1/Graphics/solar_spectrum.png
Not everyone sees the same way so there might be a slight variation on the divisions, but about 45 -51% of the area under the curve is to the right of the visible bound, that is, in the IR range. The following site claims 51%.
http://home.wanadoo.nl/paulschils/03.04.html
WIKIPEDIA has a page – scroll to Composition
http://en.wikipedia.org/wiki/Sunlight
Steve,
I must be missing something – are you implying a connection between the all-time continent highs and the chances of a record at an individual station? Or were the continental records intended as an interesting coda?
Ron de Haan (20:30:44) :
Speaking about temperatures:
US aplogizes for Global Warming!
http://www.climatedepot.com/a/486/US-apologizes-for-global-warming-Obama-administration-issues-mea-culpa-on-Americas-role-in-causing-climate-change
Idiots.
If you take responsibility for causing a non-problem, then do you get to pay non-penalties?
Who is Obama’s audience for this? Who is he trying to impress or win over? or is this just a general view he has that the US is a source of bad things in the world. He just doesn’t seem to be very proud of his nation.
Leif,
I made it quite clear in the article how a trend affects the probability. You aren’t saying anything which contradicts that.
I wrote a simple C++ program for calculating Gaussian probabilities.
———————-
#include
main(int argc, char** argv)
{
int iterations = 10000;
int winners = 0;
for (int j = 0; j < iterations; j++)
{
int maximum = 0;
int years = atoi(argv[1]);
for (int i = 0; i maximum)
{
winners++;
}
}
float probability = float(winners) / float(iterations);
std::cout << “Average probability = ” << probability << std::endl;
}
—————————
After 100 years, the probability is 0.01
./gaussian.exe 100
Average probability = 0.0106
“In a cooling climate, we would expect to see more than 10 record lows per day, and fewer than 10 record highs per day.”
Steve, I am afraid this is quite oversimplifying: we could be in a cooling situation and yet, because of strong high pressure centers reach very high temperatures in summer (think Australia’s latest summer…) or very cold lows in winter, absence of clouds…
Sorry, the WordPress html processor mangled the C++ program. It won’t take greater than or less than symbols.
One more try-
#include
main(int argc, char** argv)
{
int iterations = 10000;
int winners = 0;
for (int j = 0; j < iterations; j++)
{
int maximum = 0;
int years = atoi(argv[1]);
for (int i = 0; i maximum)
{
winners++;
}
}
float probability = float(winners) / float(iterations);
std::cout << “Average probability = ” << probability << std::endl;
}
kuhnkat (21:09:10) “The fact that most of it is absorbed in the upper atmosphere probably helps continue the myth.”
I don’t think that is true either! The main thing seems to be that Earth’s IR peak is beyond the bound that most folks use to cut off their solar spectrum diagrams. So, out of sight, out of mind.
This one shows more information, especially the notion that Earth’s IR peaks between 8 – 10 µm while the Solar IR is at a peak near the Visible, say 0.7 and diminishes much by 2.5 to 3.0 µm.
This one has “top of Atmosphere” and “radiation at sea level” so shows at what wavelengths solar IR is taken out and where it reaches to sea level.
http://physweb.bgu.ac.il/COURSES/Astronomy1/Graphics/solar_spectrum.png
Phil,
You state: ” I would further assume that the perfect climate for the AGWers is that which occurs at 285 ppm CO2 or thereabouts.”
Since you’ve asked honestly, I’ll answer in good faith as best I can. At the same time I will attempt to address the misunderstanding that others below your post seem to have reached (Ron, Pieter, E M Smith et al)
Your statement is not true at all. There is no such thing as ‘perfect climate’ – just think how absurd it would be to assume anyone thinks there is such a thing. Besides the fact that you have hugely varying climates existing simultaneously on the planet at any one time (at various latitudes, altitudes, depths and even those between day and night), which species are we defining it be the “perfect climate” for?? That’s why people who THINK that that is what climatologists think find it so easy to “knock down” the argument – the truth is, it’s never existed in the first place. Do you see the stupidity of it? The climate changes, is changing and always has changed.
HOWEVER, the climate’s various changes happen at different times, on different scales and in response to different (sometimes multiple) forcings. Climatologists have long known this. The ‘anomaly’ your friends here are so intent on homing in on (whether it’s Mann’s graph or any other expression of change in a variable) is simply the difference between the ‘now’ and a chosen baseline or average over a given time (generally represented by where/when we have sufficient data to know that our trendline amounts to more than random noise in the system) It is utter rubbish to assert that Mann maintains there has never been change above or below averge, or that the MWP didn’t exist in Europe, or that the LIA is false. He has never asserted that the climate was utterly stable, unchanging or ideal. What IS apparent after a careful look at his excellent and exhaustive reconstruction, using the best proxies available, is that right now we are way above the range within which these perturbations have been fluctuating, at least over the period he’s reconstructed. This is simply fact. It is accepted by all thinking climate researchers. Despite what you might have heard or read, the Mann graph stands firmly accepted as one of the most carefully compiled and studied products of science to date.
It does not mean that the climate has not changed much more dramatically in the past, however, and all climatologists accept this without question. Research the Vostock Ice Core data and look at the pattern driven largely by our orbital cycles with a CO2 feedback and you’ll see what I mean. It’s a case of which particular forcing(s) is dominating at any given time. The 285ppm figure that you cite is simply a rough guide to where we are ‘supposed to be’ at about now in the cycle of ice ages/interglacials. That’s all. If you look carefully at the Vostock graphs, CO2 varies cyclically between about 180ppm during the depths of an ice age up to 290ppm during the height of an interglacial. We are clearly way out of ‘normal territory’ at 390ppm today (this has not been seen for millions of years) and we have gotten to this point over decades, rather than the normal ‘thousands of years’ it would take – which is still considered rapid, geologically, by the way.
So there’s no perfect temperature, scientists are just comparing incoming data to the average of the various data sets we have and expressing how much change (pos or neg) has occurred – NOT stating that any given temp is ‘ideal’. Do you see what I mean?
Cheers,
Matt