That is a total of 365,000 high temperature records and 365,000 low temperature records. During the second year of operation, each day and each station has a 50/50 chance of breaking a high and/or low record on that date – so we would expect about 182,500 high temperature records and about 182,500 low temperature records during the year.
In the third year of the record, the odds drop to 1/3 and the number of expected records would be about 121,667 high and low temperature records.
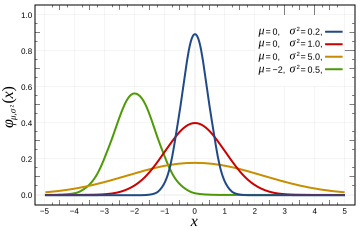
In a normal Gaussian distribution of 100 numbers (representing years in this case,) the odds of any given number being the highest are 1 out of 100, and the odds of that number being the lowest are also 1 out of 100. So by the 100th year of operation, the odds of breaking a record at any given station on any given day drop to 1/100. This mean we would expect approximately 1000 stations X 365 days / 100 years = 3,650 high and 3,650 low temperature records to be set during the year – or about ten record highs per day and ten record lows per day.
This provides the news media lots opportunity to get hysterical about global warming every single day – even in a completely stable temperature regime. The distribution of temperatures is Gaussian, so it won’t be exactly ten per day, but will average out to ten per day over the course of the year. In a warming climate, we would expect to see more than 10 record highs per day, and fewer than 10 record lows per day.
In a cooling climate, we would expect to see more than 10 record lows per day, and fewer than 10 record highs per day. The USHCN record consists of more than 1000 stations, so we should expect to see more than 10 record highs per day. Throw in the UHI effects that Anthony and team have documented, and we would expect to see many more than that. So no, record high temperatures are not unusual and should be expected to occur somewhere nearly every day of the year. They don’t prove global warming – rather they prove that the temperature record is inadequate.
No continents have set a record high temperature since 1974. This is not even remotely consistent with claims that current temperatures are unusually high. Quite the contrary.
| Continent | Temperature | Year |
| Africa | 136F | 1922 |
| North America | 134F | 1913 |
| Asia | 129F | 1942 |
| Australia | 128F | 1889 |
| Europe | 122F | 1881 |
| South America | 120F | 1905 |
| Antarctica | 59F | 1974 |
http://www.infoplease.com/ipa/A0001375.html
Here is the code discussed in comments:
// C++ Program for calculating high temperature record probabilities in a 100 year temperature record

// Compilation :  g++ -o gaussian gaussian.cc

// Usage : ./gaussian 100

#include <iostream>

main(int argc, char** argv)

{

int iterations = 10000;

int winners = 0;

int years = atoi(argv[1]);

for (int j = 0; j < iterations; j++)

{

int maximum = 0;

for (int i = 0; i < years; i++)

{

maximum = std::max( rand(), maximum );

}

int value = rand();

if (value > maximum)

{

winners++;

}

}

float probability = float(winners) / float(iterations);

std::cout << "Average probability = " << probability << std::endl;

}
“From error to error one discovers the entire truth.” – Sigmund Freud.
This concept does not apply to Algore and his greedy band of liars.
“It is not a pollutant and not causing global warming or climate change.”
The SSOTUS (Supreme Scientists Of The United States) have designated CO2 to be a pollutant, Nature be d……
“A major tenet of the environmental paradigm is that almost all change is due to human activity. Once a change is determined it triggers a search for the human cause without consideration of natural change.”
Humans have the deep pockets. Polar Bears and Penguins do not pay taxes or fees.
Given our current events, I amend Michael Crichton’s “State of Fear” to read states of fear. The latest fear is engendered by the swine flu. My first thought that this was a viral attack on the economy and financial community resulting from contaminated pork in recent Congressional legislation.
————————————————————-
Human CO2 Hysteria:
Spending billions on a non-existent problem
By Dr. Tim Ball
http://canadafreepress.com/index.php/article/10605
The term “greenhouse gas emissions” is either deliberately misleading or indicates complete ignorance of the science, or both. What they really mean is CO2, yet it is less than 4% of greenhouse gases and the human portion a fraction of that. Why do they want it reduced? It is not a pollutant and not causing global warming or climate change. Reducing it is completely unnecessary and harmful for the plants and will cost trillions. They propose energy alternatives that are potentially more dangerous because they don’t work and can replace only a fraction of existing energy sources. This pattern of identifying the wrong agent of change, blaming humans, and proposing inadequate replacements at great cost is not new. We saw very similar events and sequences with claims that Chlorofluorocarbon (CFC) was destroying the ozone layer.
This seems like something Matt Briggs should have posted (or at least commented about)
My father was in the gold mining business. In more than any other type of mining successfully mining gold depends on accurate sampling to define as best as possible the ore grade AND minerology so there will not be any unpleasant surprises after the mine is put into production. This is because in mining all of the money is spent up front (developing the mine, putting in the mill and transportation infrastructure) before production. Frequently it takes several years of operation before one knows just how well (or poorly) one will do with a given gold property
Son Thomas went into the oil biz as a geopysicist. During my career three dimensional seismic data cubes were invented and perfected so there was a very rich and fairly accurate data cube to use for predicting drilling results. Data collection could be be expensive, but after spending a few million $ on the 3D survey and drilling a few expendable wildcats one knew if this prospect would be a good investment or not. It is just the opposite of mining, when one considers the cost of a large deep water production facility and pipeline needed to connect to the economic world could get into the hundreds of millions of dollars pretty quickly.
Dad and I would savor a beer or two after dinner and have great and very antimated discussions about practical sampling and sampling theory because that is what it is all about. If you can successfully predict what will be found in between two boreholes, you have sampled enough. if you are badly surprised, not so.
I look at the sorts of ‘information’ being offered to support the AGW thesis, and I sure find it lacking. Specifically I find it lacking in methodology, in repeatability, in documentation and in density of data volumes. Oh, and I forgot to mention the lack of predictability that the GCM models offer.
Whatever it is, it is not the successful application of technology for economic means, unless one considers ones continued employment as the only economic success necessary.
“Robert (16:30:16) :
re: crosspatch (16:12:01) :
“No, it would not cause higher high temps because CO2 would also block inbound IR from the Sun during daytime.”
Not much inbound IR from the sun.”
But the extra CO2 would block the extra IR trapped/coming downward from other extra CO2 molecules from above.
Something the AGW community never talks about. How does the extra IR trapped by CO2 make it back to the surface with all those IR intercepting CO2 molecules in the way.
Basically it is just a random walk around the atmosphere with only a few IR photons making it back down. They still make it out into space within a few minutes of what they would have before the extra CO2 was there.
OT, but I’ve been thinking about this for awhile.
————————
3 record low temperatures set in my area over the past year and no record highs.
Anthony; If you want to drill down a little further there is potential for new record highs and lows for both maximum and minimum temperatures. A total of 4 ways to create a new record each day.
At my nearest major city – Melbourne – they’ve been keeping records since 1st May 1855. Each day there are 4 possible records to break; multiplied by 365 = 1460 records. Divide that by 104 years means we should set 14 new records every year!
Unfortunately for Melbourne, the UHI effect is meaning we’re creating a lot of high minimum records and no low minimum records since 1978.
A few years ago, Phil Jones of the CRU was speaking on Robyn Williams’ Science Show (ABC Radio National). He stated (this is from memory) the record number of record high temperatures was entirely due to global warming. When I analysed Australian data most of the records dated back to the 1920s and 30s. Very few were recent.
The excellent site that jeez linked to is as good in its own way as the late John Daly’s site:
http://www.numberwatch.co.uk/record.htm
Here’s the home page for anyone who can’t figure out how to contact WordPress:
http://www.numberwatch.co.uk/number%20watch.htm
Worth bookmarking, IMHO.
A related question: What type of distribution do, for example, monthly temperatures follow. Surely not Gaussian. Is there skewness and kurtosis?
I am sure this question has been tackled but I have not found references. Maybe no parametric distribution fits.
Article is a nice way of presenting the issue. Should be clear to anyone — even me.
These kind of records are also a good way of assessing whether the “adjustments” made to the historic temperatures levels are accurate.
Very few of these records would be from the adjusted datasets but would just be from local record-keeping.
Reported record temperatures are abnormal if they aren’t real. Whenever there are record temperatures reported, I take it with a grain of salt.
Heat Waves in Southern California.
Are They Becoming More Frequent and Longer Lasting?
http://climate.jpl.nasa.gov/files/LAHeatWaves-JournalArticle.pdf
Almost every day I observe a politician, journalist or practicing “scientist” exhibit either ignorance of the difference between climate and weather (a distinction I learned in the 4th grade), or a deliberate disregard for the the difference.
Shameful, at best, and possibly despicable.
The record low temp in Australia (-23C ) was set in June 1994 at Charlotte Pass (1800m asl) but only after the weather station was relocated to a new position at the bottom of the valley. It stands to reason that the night time temperatures will be colder in this location. To my knowledge the station has been moved again – higher up the slope due to problems with excessive drifting snow so it is unlikely that a record low will be set any time soon. FTR there are only 3 weather stations in Australia that have ever recorded temperatures of -20 or less and all of these are within the Alpine area of NSW above 1400m.
I did a simple minded test of your observation by taking the record high and low temperatures in the US by date and state from Wikipedia, putting the events in Excel and plotting the cumulative highs minus cumulative lows. The lows lead the highs until the 1930s, when the highs gained until the 1960s, after which the lows exceeded highs bringing 2008 back to even. A polynomial best fit, assuming each state is a weather station, says we are in a cooling trend now in the USA.
Hopeless blend of hot air and hubris
Greg Melleuish | April 28, 2009
http://www.theaustralian.news.com.au/story/0,25197,25395364-7583,00.html
There is a very important law in politics and economics known as the law of unintended consequences. When governments intervene in matters about which they have limited knowledge, and this is basically everything, they can take steps that make things worse rather than better.
The same law applies to the natural world. Plimer describes a universe so complex that it is simply not feasible that any computer model devised by a human being could capture its complexity.
State action based on such limited knowledge invariably will have unforeseen consequences that may well prove quite harmful.
Humility can be seen as the antidote to hubris. Human beings should be humble in the face of the immense forces of nature and recognise that their power to manipulate and change the world is very limited. They can do this only if they recognise that adherence to climate change is the ultimate expression of hubris. There are times when the best thing for the state to do is nothing.
The analysis assumes that the temperature measurements are spatially and temporally independent which they are not. Increase the number of stations to 1000,000 to see the error in the reasoning, or/and have them measure every five minutes to boot.
While I don’t think that 1917 was a record, Northern hemisphere temperature data indicate the following (from CO2 Science data sheets GHCN).
Temperature anomaly
1916 -0.282542
1917 -0.643615
1918 -0.299733
1919 -0.271429
I’m not one to make correlations but wasnt the last flu outbreak about then? Hmm?
A slight correction. One expects more high and low temperature to be recorded as the reliability of thermometer improves. If you 1930’s thermometer was rated +/-0.1 degrees, then the actual maximum temperature was recorded as 91.6 degrees. in 2009 the thermometer is rated +/- 0.005 and the recording is 91.64 degrees. the record WILL always be broken.
Steve,
Looking at NOAA’s anomaly map for the month of April, I noticed something odd. The map says it represents anomaly for a period of 25 days.
http://www.hprcc.unl.edu/products/maps/acis/MonthTDeptUS.png
I’m just south of the Seattle area, and the map shows my area about 2 degrees below to 2 degrees above normal for this period. Or to sum that up, normal. We’re about 2 degrees below normal today, but thru this month, we’ve run 5 to even 10 degrees below normal on most days. We’ve only had reasonable weather in the last week or so.
This suggests the anomaly doesn’t really cover the period noted, but perhaps is a snapshot.
I’ll see if I can get some more information. But I’ve checked the almanac at our local weather station, and on those days I’ve checked, we’ve been significantly under normal. (5-10 degrees) I don’t suppose someone’s got their finger on the scale here…?
http://www.king5.com/weather/
So bets are HE will be right !!!!
Next possible statistical analysis :Hysterical mass/political movements vs. Temperatures.
I bet we´ll find a time lag:
1) Maximum Temperatures PRECEDING Hysterical mass/political movements
2) Hysterical mass/political movements PRECEDING Minimum Temperatures
3) Dictatorships following 02
4) Wars following 03
Jeff of Gembrook (AU) (17:17:27) :
Have you seen this study?
http://mclean.ch/climate/Melbourne_UHI.htm
Leif, you beat me to it!
This post’s analysis is based upon independent random events, which earth atmospheric temperature certainly is not. To say that the odds of a record temperature is 1 out of 100 requires a randomness that does not exist.
Solar output (here we go again!) is anything but random, instead, it is quite constant within a narrow range. Earth’s orbital distance varies a bit, but on any given day of the year, it is approximately the same. So much for randomness.
Interesting post, but it does not fly for me.
If anyone is ever in Los Angeles with an afternoon to spare, one could go to the Museum of Science and Industry to watch the bell curve machine in operation. Hundreds of black balls are introduced, one at a time, at the top center, then the balls bounce off of small pegs as they fall into one of about a dozen adjacent slots. The slots in the center fill up the most, and the slots on the far ends receive only a few balls. That is randomness in action.
Not read all of the posts here….maybe said already…
The whole “record high” thing is exacerbated because it is easier to get a false record high than a false record low. A wx stn can be made hotter than the “true” temp, but it is all but impossible to make it colder. Yes?
It is easier to measure a record high and a record high-low than to measure a record low or a record low-high. Got that?
Clive
Southern Alberta … where is is snowing again .. this is getting real old…a winter from hell !
“and the perfect unchanging climate (which our AGW friends imagine used to exist before they were born.)”
..and immediately, you’ve lost me already. ~snip~ Name one climatologist who (even in the last century) EVER thought that there was some kind of “perfect temperature” for earth (geared to which species??) and that the climate hadn’t been changing in perpetuity. Name one.
You are erecting on knocking down views that have never existed. How intelligent.
I’ve often wondered about the math and probability for these situations, thanks for the post.