That is a total of 365,000 high temperature records and 365,000 low temperature records. During the second year of operation, each day and each station has a 50/50 chance of breaking a high and/or low record on that date – so we would expect about 182,500 high temperature records and about 182,500 low temperature records during the year.
In the third year of the record, the odds drop to 1/3 and the number of expected records would be about 121,667 high and low temperature records.
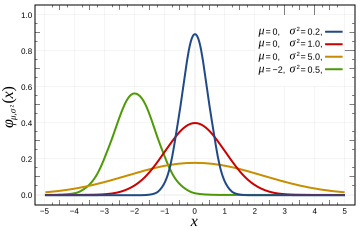
In a normal Gaussian distribution of 100 numbers (representing years in this case,) the odds of any given number being the highest are 1 out of 100, and the odds of that number being the lowest are also 1 out of 100. So by the 100th year of operation, the odds of breaking a record at any given station on any given day drop to 1/100. This mean we would expect approximately 1000 stations X 365 days / 100 years = 3,650 high and 3,650 low temperature records to be set during the year – or about ten record highs per day and ten record lows per day.
This provides the news media lots opportunity to get hysterical about global warming every single day – even in a completely stable temperature regime. The distribution of temperatures is Gaussian, so it won’t be exactly ten per day, but will average out to ten per day over the course of the year. In a warming climate, we would expect to see more than 10 record highs per day, and fewer than 10 record lows per day.
In a cooling climate, we would expect to see more than 10 record lows per day, and fewer than 10 record highs per day. The USHCN record consists of more than 1000 stations, so we should expect to see more than 10 record highs per day. Throw in the UHI effects that Anthony and team have documented, and we would expect to see many more than that. So no, record high temperatures are not unusual and should be expected to occur somewhere nearly every day of the year. They don’t prove global warming – rather they prove that the temperature record is inadequate.
No continents have set a record high temperature since 1974. This is not even remotely consistent with claims that current temperatures are unusually high. Quite the contrary.
| Continent | Temperature | Year |
| Africa | 136F | 1922 |
| North America | 134F | 1913 |
| Asia | 129F | 1942 |
| Australia | 128F | 1889 |
| Europe | 122F | 1881 |
| South America | 120F | 1905 |
| Antarctica | 59F | 1974 |
http://www.infoplease.com/ipa/A0001375.html
Here is the code discussed in comments:
// C++ Program for calculating high temperature record probabilities in a 100 year temperature record

// Compilation :  g++ -o gaussian gaussian.cc

// Usage : ./gaussian 100

#include <iostream>

main(int argc, char** argv)

{

int iterations = 10000;

int winners = 0;

int years = atoi(argv[1]);

for (int j = 0; j < iterations; j++)

{

int maximum = 0;

for (int i = 0; i < years; i++)

{

maximum = std::max( rand(), maximum );

}

int value = rand();

if (value > maximum)

{

winners++;

}

}

float probability = float(winners) / float(iterations);

std::cout << "Average probability = " << probability << std::endl;

}
Ohioholic (19:49:07) : “I have often wondered myself if water vapor reflects energy from the sun even when clouds aren’t formed. I would love to have the time to find out, but that is just not possible for me right now. Anyone else know?”
Between 0.75 and 3.5 microns, there are 6 absorption lines in the water vapor spectrum. They are fairly thin, but perhaps through the magic of “broadening” as happens with CO² (according to some), they will become almost contiguous, thus blocking a significant amount of the incoming energy, maybe 30%. There’s still a lot left between 0.14 and 0.8 microns.
Steven Goddard (21:53:38) :
I made it quite clear in the article how a trend affects the probability. You aren’t saying anything which contradicts that.
I’m saying that with a trend the chance is not 1/100 after the 100th year. Did you do work through the simple exercise?
And what about the cold ones?
When were they set??
Actually, what is observed is that the all distribution up there is shifted to higher temperatures, i.e. the maximum of the probability density function corresponds to higher and higher temperatures but fluctuations around it still exist
http://www.cdc.noaa.gov/csi/images/GRL2009_ClimateWarming.pdf
.
evanmjones (20:31:31) :
Mr. evanmjones,
I’m still anxious to see that co2 1940’s thread you talked about making a couple weeks ago.
[REPLY- Haven’t forgotten. Looking for data. The graph I found shows fossil fuel consumption up c. 50% from 1940 – 1944 in spite of all the war damage. But I need solid numbers. (I also need to find out how much CO2 incinerating a city releases.) ~ Evan]
Ron House: “To be a straw man, the argument of one’s opponent has to be put in a deliberately weak manner.”
Well, the imputed argument was: “…the perfect unchanging climate (which our AGW friends imagine used to exist before they were born.)”
I don’t know of any climate scientist who claims a “perfect unchanging climate”. Some climate scientists may claim that climate has been relatively stable in the recent past, but that’s not the same as a “perfect unchanging climate”. So, yes, a straw man is being beaten around.
There is no such thing as a “perfect” or “ideal” climate. The earth’s climate may be more or less hostile to human survival and comfort, but that has little to do with perfection. We may also prefer some climates over others, but preference doesn’t imply perfection.
What does matter for humans is that the climate remains not too far from the range of the past 10,000 years, the period during which human civilisation developed, since our way of life is dependent on that range.
sorry, their non-urban sites include quite a few that should be rated urban. Kinda screws up exercises like yours!!
In case you didn’t notice, I pointed out that possibility. Besides, if that were true, the trend increase would average lower and UHI would be that much lower as well. In fact, as the urban % increased and the trend dropped, the adjustment would remain correct (stipulating that it is correct in the first place, which it may be).
The fact is that sites rated as urban warmed 0.5C/century faster than those rated non-urban. 9% of sites are rated as urban. The Adjustment is 0.05C. If this is wrong someone has to tell me why. I know the difference in offset is outrageous. But we are not talking offset, we are talking trend.
Besides, raw data from suburban sites shows even less warming than rural sites. Strange but true. Sites rated as urban show a lot more warming.
FYI, the overall raw trend for the US, weighting all stations equally, is +0.14C per century.
I will discuss microsite issues at a later time, but for now I must defer.
The Australian record of 128 F (53.1 C) at Cloncurry, Queensland in 1889 is not officially recognised anymore. I believe that it was found to be inconsistent with other temperatures recorded in the region on that day, and the quality of recording equipment was dubious (improvised screen made from a beer crate; Anthony would not be impressed). The official record is now 123 F (50.7 C) at Oodnadatta in South Australia in 1960.
It’s worth noting that, over many stations over many years, the chances of an all-time record being due to faulty equipment or a misread are pretty high.
SL,
Yes, but no. If the temperature is reprted to 0.1C, then 22.44C is reported as 22.4C and 22.45C is reperted as 22.5C. So a new high temperature of at 0.1C higher than the previous record high is not required to get a new instrument high (replace argument with one using 5 significant figure and you can show the same with ever increasingly small differentials, no matter what the actual ability of a measurement to be made is – the digital discretization of the data is pretty much irrelevant to this argument). And since instruments drift randomly and instruments are replaced somewhat randomly with arbitraily small offsets (assuming they are calibrated correctly) in random direction from the calibration from the instrument they are replacing, new record highs or lows should still be occurring statistically as frequently as modelled by the article (but we’d have to take account of the UHI, actual number of stations, reading frequencies, etc.).
David LM (17:53:50) David, here in western Colorado, the higher the elevation, the colder it gets. The valley floors are always the warmest temps around. I assume this is due to the thinner atmosphere allowing more heat to escape. More IR in and more IR out on a daily basis, the thinner the air is.
Now, would that same formula work for an outer atmosphere found by probes to have shrunken 30% ?? i.e. – is the heat escaping?
[REPLY- Haven’t forgotten. Looking for data. The graph I found shows fossil fuel consumption up c. 50% from 1940 – 1944 in spite of all the war damage. But I need solid numbers. (I also need to find out how much CO2 incinerating a city releases.)
Scorched Earth, burned war materials, exploded ordinance in addition to the consumed contruction materials of which much of it accumulated over centuries. Wow, that is a tough assignment.
Matt Bennett (18:52:20) :
Ed says: “Nature is the norm…”
Now I don’t think anyone doubts that at all. The point is whether precautionary action should be taken to avoid terrible effects.
OK, if you’re so in favour of precautionary action how about this. I think most scientists would agree that there is a high probability that we are not the only intelligent civilisation in the universe, in fact there are probably many. Dr Drake of the Drake equation estimates about 10,000 for example. Assuming there are 10,000 then there is a good chance that some of these are hostile, more advanced, and could at this very moment be monitoring our radio transmissions!
Obviously the consequences of a more advanced hostile alien race attacking the earth would be far more serious than even AGW, and so I’m sure you’ll agree that we should:
a) Stop all radio transmissions immediately
b) Massively increase millitary spending in order to prepare ourselves for the attack (just in case).
sorry, but this math is complete bogus. the idea that 10 stations would report a maximum on a day, and 10 stations report a minimum in one country is absurd. this would actually be a sign of a massive problem with the surface station network.
beyond that, the science isn t really based on those daily records at any station.
instead we average stations and days over a year and find a remarkable result:
http://www.metoffice.gov.uk/corporate/pressoffice/2008/images/g_r_ranked_hadCRUT3_lg.gif
the science is sound.
This may have been mentioned before (penalty for coming late to a active discussion), but:
The debate is all about antropomorphic global warming – that is, man-made global warming – due to mankinds output of green-house gases.
Well if such a thing is true, then the total amount of additional green-house gases must be produced by the total world population. This implies that we each have an average green-house gas footprint.
Given that the world population doubles roughly every 60 years, we would need to halve the average green-house gas footprint every 60 years just to maintain the status quo. That looks like a no-win game to me.
Why is everybody focussed on trying to change the climate side of the equation?
Surely decreasing the size of the global population over the same time period (3 generations) would be easier, and have a more lasting effect. Or is that a taboo that we are not ready to face quite yet?
A nice picture of the station where the North American 1913 record was taken. Too bad they all can’t be of this quality.
http://docs.lib.noaa.gov/rescue/mwr/050/mwr-050-01-0010.pdf (Figure 1)
No climatologists believed that the climate was stable before the invention of the automobile – other than the IPCC.
http://en.wikipedia.org/wiki/File:Hockey_stick_chart_ipcc_large.jpg
Interesting how the AGW crew wants to have it both ways. Stable when convenient, and then deny it when convenient.
If one only looks at the warming trend of one short period and ignores the fact that this is only part of ongoing and alteranating long term cool/warm cycle , then the so called record global warming can be made to look abnormal or alarming. Taken in the context of a longer period , the warming is just another warming cycle of many such events.
LEAST SQUARE TREND LINES PER DECADE FOR VARIOUS PAST WARM AND COOL PERIODS
[Per HADCRUT3vgl]
1900-1926 0.048 C COOL [AMO –VE, PDO –VE &+VE]
1926-1944 0.187 C WARM [AMO & PDO POSITIVE]
1964-1976 0.108 C COOL [AMO& PDO NEGATIVE]
1994 -2008 0.187 C WARM [AMO & PDO POSITIVE]
Notice that the period 1926-1944 had the same rate of warming as 1994-2008. Periods of global warming existed well before 1976-2008.
1900 -2009 0.073 C PAST CENTURY [equivalent of 0.73 C/century]
2002 -2009 -0.195 C LATEST COOL [PDO –VE SEPT/07, AMO –VE JAN/09]
What made the most recent warming[1994-2007] more significant was that some of the AMO and PDO levels were higher than usual [third highest after 1878]
Another observation is that most of the recent warming period was really in the period 1994- 2007 and not 1976-2008. So the real warming was a decade and some three years , a very short period indeed and not a climate trend or long term trend at all. It is amazing how 13 years got blown out of all proportions by the AGW science and misrepresented as an alarming and an un precedented trend when it was really another warm hicup of this planet where regular alteranating cool and warm hicups are par for the planet.
Matt Bennett (22:30:03) :
“What IS apparent after a careful look at his excellent and exhaustive reconstruction, using the best proxies available, is that right now we are way above the range within which these perturbations have been fluctuating, at least over the period he’s reconstructed. This is simply fact. ”
This “fact” depends on the choice of “the period he’s reconstructed”. But does this “fact” hold up everywhere else? I also notice the disclaimer “using the best proxies available”. A lot depends on that.
Brendan H,
Your point is correct, but I think you’re also interpreting an ambiguous word usage by Anthony in a way it need not be.
First of all, Anthony was obviously making a hyperbolic argument to enforce his point. He doesn’t believe anyone believes that, only that the way the data is presented to the general public it would be virtually impossible for the public to not draw that conclusion. Much like the “North Pole will be ice-free this year (gasp!)” statements. It doesn’t matter whether the North Pole has or hasn’t been so in the past, one virtually forces a general audience to draw the conclusion desired even though the data doesn’t support it.
Second – within the recognized flexibility of the Engligh language Anthony could just as easily have meant, “perfect[ly] unchanging climate.” Again, nobody actually believes that, but it would be EXTREMELY difficult for people, for instance, watching Al Gore’s movie and looking at his presentation of the Mann Hockey Stick to not draw that conclusion.
THAT is the point that Anthony, I think, was trying to make.
I neglected to add that 10 of the highest global temperature anomalies also took place in the period 1994-2008 when AMO and PDO were both warm or positive and at higher than normal levels during some years. As both are now negative and anticipated to be so for some time , it is not surprising that we are having more cooler weather like we had in the 1970’s. CO2 is tracking completely opposite of this cooling.
“What does matter for humans is that the climate remains not too far from the range of the past 10,000 years, the period during which human civilisation developed, since our way of life is dependent on that range.”
Our way of life would be shattered by a two degree departure from the mean???
Of course, I’ll have to agree that we certainly benefited from the 8 degree rise in temperature from 20,000 years ago. http://www.geocraft.com/WVFossils/last_50k_yrs.html
Steve Keohane (20:49:16) :
Are the valleys warmer at night?
In general higher elevations are cooler during the day, thanks to convection and the adiabatic lapse rate (about 1°F per 200 feet). At night radiational cooling cools air near the surface which flows down hill and chills the valley. The temperature inversion thus formed can be quite thin (less than 100 feet) and scours away quickly in the morning with the first breeze.
OTOH, on a bicycle tour through the searing (2003) eastern Oregon & Idaho summer there were a couple canyons where the valley suffered radiant heat stored in the basalt canyon walls during the day – we baked all night long.
Brendan H (00:32:52) :
“Ron House: “To be a straw man, the argument of one’s opponent has to be put in a deliberately weak manner.” Well, the imputed argument was: “…the perfect unchanging climate (which our AGW friends imagine used to exist before they were born.)” I don’t know of any climate scientist who claims a “perfect unchanging climate”. Some climate scientists may claim that climate has been relatively stable in the recent past, but that’s not the same as a “perfect unchanging climate”. So, yes, a straw man is being beaten around.”
You carefully didn’t quote the part of my reply where I pointed out that the argument made did not rely on any part of this “perfect unchanging climate” snipe. Yes, that remark by the OP was snide, but no, the argument made did NOT rely on the “perfect unchanging” part of it. Indeed, even with a heck of a lot of variation in the past, as long as the current variation is out of the previous range, statistically more record maxima should be getting set, and they are not. So there is NO straw man argument here, just AGW alarmists pouncing on an irrelevancy (which was obviously intended to be nothing but a facetious wisecrack, as you surely well know) and trying to misdirect people’s attention with it whilst ignoring the actual logical content of the OP’s argument. Deal with the actual argument, please – if you can.
Leif Svalgaard (20:54:24) :
Steven Goddard (20:22:24) :
Work through this simple exercise.
The first year of the record, there is of course a 100% probability of setting the record high. The second year, there is a 50/50 probability. the third year, there is one chance out of three. etc. This is a defining characteristic of a Gaussian
Work through this simple exercise:
Assume that halfway through the 100 years there is a dramatic climate change [e.g. like the Younger Dryas] where the temperature jumps 15 degrees, then that year has almost a 100% chance of setting a record high, the second year after that has a 50/50 chance, etc. Now, if there were jumps halfway to the 50 years and to the 75 years, the same will be true for them, so the odds of records depends very much on the trend. So, at the end, we are not down to 1/100 chance.
Therefore, your point is an underlying increasing trend will raise the probability of record highs in later years, which we don’t see, yes? Seems to me this adds credibility to SG’s thesis.
Matt Bennett (22:30:03):
Mann’s reconstruction is far from “excellent and exhaustive” from what I’ve seen. A simple search of Climate Audit for Mann will show more than enough examples of questionable practices to cast his entire body of work into doubt.
no sod,
The math is both correct and is basic statistics. This is exactly how the temperature distribution would behave in a stable climate. If you have a disagreement about the math – cite something specific. The world “bogus” is not a mathematical proof.