Cross Posted from Climate Audit
by Ryan N. Maue, Florida State University COAPS

Figure: Global 24-month running sum time-series of Accumulated Cyclone Energy updated through March 12, 2009.
Very important: global hurricane activity includes the 80-90 tropical cyclones that develop around the world during a given calendar year, including the 12-15 that occur in the North Atlantic (Gulf of Mexico and Caribbean included). The heightened activity in the North Atlantic since 1995 is included in the data used to create this figure.
As previously reported here and here at Climate Audit, and chronicled at my Florida State Global Hurricane Update page, both Northern Hemisphere and overall Global hurricane activity has continued to sink to levels not seen since the 1970s. Even more astounding, when the Southern Hemisphere hurricane data is analyzed to create a global value, we see that Global Hurricane Energy has sunk to 30-year lows, at the least. Since hurricane intensity and detection data is problematic as one goes back in time, when reporting and observing practices were different than today, it is possible that we underestimated global hurricane energy during the 1970s. See notes at bottom to avoid terminology discombobulation.
Using a well-accepted metric called the Accumulated Cyclone Energy index or ACE for short (Bell and Chelliah 2006), which has been used by Klotzbach (2006) and Emanuel (2005) (PDI is analogous to ACE), and most recently by myself in Maue (2009), simple analysis shows that 24-month running sums of global ACE or hurricane energy have plummeted to levels not seen in 30 years. Why use 24-month running sums instead of simply yearly values? Since a primary driver of the Earth’s climate from year to year is the El Nino Southern Oscillation (ENSO) acts on time scales on the order of 2-7 years, and the fact that the bulk of the Southern Hemisphere hurricane season occurs from October – March, a reasonable interpretation of global hurricane activity requires a better metric than simply calendar year totals. The 24-month running sums is analogous to the idea of “what have you done for me lately”.
During the past 6 months, extending back to October of 2008 when the Southern Hemisphere tropical season was gearing up, global ACE had crashed due to two consecutive years of well-below average Northern Hemisphere hurricane activity. To avoid confusion, I am not specifically addressing the North Atlantic, which was above normal in 2008 (in terms of ACE), but the hemisphere (and or globe) as a whole. The North Atlantic only represents a 1/10 to 1/8 of global hurricane energy output on average but deservedly so demands disproportionate media attention due to the devastating societal impacts of recent major hurricane landfalls.
Why the record low ACE?
During the past 2 years +, the Earth’s climate has cooled under the effects of a dramatic La Nina episode. The Pacific Ocean basin typically sees much weaker hurricanes that indeed have shorter lifecycles and therefore — less ACE . Conversely, due to well-researched upper-atmospheric flow (e.g. vertical shear) configurations favorable to Atlantic hurricane development and intensification, La Nina falls tend to favor very active seasons in the Atlantic (word of warning for 2009). This offsetting relationship, high in the Atlantic and low in the Pacific, is a topic of discussion in my GRL paper, which will be a separate topic in a future posting. Thus, the Western North Pacific (typhoons) tropical activity was well below normal in 2007 and 2008 (see table). Same for the Eastern North Pacific. The Southern Hemisphere, which includes the southern Indian Ocean from the coast of Mozambique across Madagascar to the coast of Australia, into the South Pacific and Coral Sea, saw below normal activity as well in 2008. Through March 12, 2009, the Southern Hemisphere ACE is about half of what’s expected in a normal year, with a multitude of very weak, short-lived hurricanes. All of these numbers tell a very simple story: just as there are active periods of hurricane activity around the globe, there are inactive periods, and we are currently experiencing one of the most impressive inactive periods, now for almost 3 years.
Bottom Line
Under global warming scenarios, hurricane intensity is expected to increase (on the order of a few percent), but MANY questions remain as to how much, where, and when. This science is very far from settled. Indeed, Al Gore has dropped the related slide in his PowerPoint (btw, is he addicted to the Teleprompter as well?) Many papers have suggested that these changes are already occurring especially in the strongest of hurricanes, e.g. this and that and here, due to warming sea-surface temperatures (the methodology and data issues with each of these papers has been discussed here at CA, and will be even more in the coming months). The notion that the overall global hurricane energy or ACE has collapsed does not contradict the above papers but provides an additional, perhaps less publicized piece of the puzzle. Indeed, the very strong interannual variability of global hurricane ACE (energy) highly correlated to ENSO, suggests that the role of tropical cyclones in climate is modulated very strongly by the big movers and shakers in large-scale, global climate. The perceptible (and perhaps measurable) impact of global warming on hurricanes in today’s climate is arguably a pittance compared to the reorganization and modulation of hurricane formation locations and preferred tracks/intensification corridors dominated by ENSO (and other natural climate factors). Moreover, our understanding of the complicated role of hurricanes with and role in climate is nebulous to be charitable. We must increase our understanding of the current climate’s hurricane activity.
Background:
During the summer and fall of 2007, as the Atlantic hurricane season failed to live up to the hyperbolic prognostications of the seasonal hurricane forecasters, I noticed that the rest of the Northern Hemisphere hurricane basins, which include the Western/Central/Eastern Pacific and Northern Indian Oceans, was on pace to produce the lowest Accumulated Cyclone Energy or ACE since 1977. ACE is the convolution or combination of a storm’s intensity and longevity. Put simply, a long-lived very powerful Category 3 hurricane may have more than 100 times the ACE of a weaker tropical storm that lasts for less than a day. Over a season or calendar year, all individual storm ACE is added up to produce the overall seasonal or yearly ACE. Detailed tables of previous monthly and yearly ACE are on my Florida State website.
Previous Basin Activity: Hurricane ACE
| BASIN | 2005 ACE | 2006 ACE | 2007 ACE | 2008 ACE | 1982-2008 AVERAGE |
| Northern Hemisphere | 655 | 576 | 383 | 408 | 557 |
| North Atlantic | 243 | 83 | 72 | 142 | 104 |
| Western Pacific | 301 | 274 | 212 | 167 | 280 |
| Eastern Pacific | 97 | 204 | 55 | 83 | 156 |
| Southern Hemisphere* | 285 | 182 | 191 | 164 | 229 |
* Southern Hemisphere peak TC activity occurs between October and April. Thus, 2008 values represent the period October 2007 – April 2008.
The table does not include the Northern Indian Ocean, which can be deduced as the portion of the Northern Hemisphere total not included in the three major basins. Nevertheless, 2007 saw the lowest ACE since 1977. 2008 continued the dramatic downturn in hurricane energy or ACE. The following stacked bar chart demonstrates the highly variable, from year-to-year behavior of Northern Hemisphere (NH) ACE. The smaller inset line graph plots the raw data and trend (or lack thereof). Thus, during the past 60 years, with the data at hand, Northern Hemisphere ACE undergoes significant interannual variability but exhibits no significant statistical trend.

So what to expect in 2009? Well, the last Northern Hemisphere storm was Typhoon Dolphin in middle December of 2008, and no ACE has been recorded so far. The Southern Hemisphere is below normal by just about any definition of storm activity (unless you have access to the Elias sports bureau statistic creativity department), and the season is quickly running out. With La Nina-like conditions in the Pacific, a persistence forecast of below average global cyclone activity seems like a very good bet. Now if only the Dow Jones index didn’t correlate so well with the Global ACE lately…
Notes:
Hurricane is the term for Tropical Cyclone specific to the North Atlantic, Gulf of Mexico, Caribbean Sea, and the Pacific Ocean from Hawaii eastward to the Mexican coast. Other names around the world include Typhoon, Cyclone, and Willy-Willy (Oz) but hurricane is used generically to avoid confusion.
Accumulated Cyclone Energy or ACE:
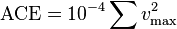
is easily calculated from best-track hurricane datasets, with the one-minute maximum sustained wind squared and summed during the tropical lifecycle of a tropical storm or hurricane.
COPENHAGEN — Hundreds of leading scientists warned Thursday that global warming is accelerating beyond the worst predictions and threatening to trigger “irreversible” climate shifts on the planet.
This is a headline out of The Detroit News March 12. If you own any beachfront property you had better get rid of it as soon as possible. See:
http://www.detnews.com/apps/pbcs.dll/article?AID=/20090312/LIFESTYLE14/903120455/-1/rss
mark (20:16:31) :
“i wonder if Gore will update his slideshows….”
Maybe WWF will drop their “Golf in a level 5 hurricane” commercials…
If AGW causes hurricanes, what causes lack of hurricanes …?
Close correlation to the AMO.
(I imagine the AMO isn’t affecting Pacific cyclone numbers but it certainly impacts the Atlantic numbers). (Note the recent decline with the newest Feb, 2009 figures).
http://img258.imageshack.us/img258/2434/amo1974.png
A splash of PDO and the ENSO might help explain Pacific cyclone numbers.
http://img258.imageshack.us/img258/7535/pdo1974.png
http://img258.imageshack.us/img258/2453/nino1974.png
Note how they are all in negative territory now.
Hey, Len van Burgel
Thanks for clearing up the definition of “willy-willy”.
You have, however, left me with “thunderbox” to puzzle over;-)
The ACE formula is intriguing me.
If I read this correctly, ACE is Accumulated cyclone energy.
Energy is directly proportional to velocity squared.
But energy is also directly proportional to mass.
“ACE is the convolution or combination of a storm’s intensity and longevity. Put simply, a long-lived very powerful Category 3 hurricane may have more than 100 times the ACE of a weaker tropical storm that lasts for less than a day.”
OK, a hurricane with say max velocity of 100mph would have energy of 100^2 that is 10,000 units.
A less active hurricane with twice the swirling mass with a max velocity of say 80mph would have an energy of 2 x 80^2 = 12,800 units.
Am I right in saying that a massive Tropical Storm would have more energy than a less massive Cat 3? (I’m thinking of my vacation, last August, in SW Florida. Boy did we get it!)
And since “ACE is the convolution or combination of a storm’s intensity and longevity”, then am I right in thinking that a 80 mph Hurricane that lasts twice as long as the 100 mph Hurricane will have more energy?
What is actually being calculated by ACE?
What is the ACE unit?
I am really not sure what ACE is trying to tell me.
Help!
spangled drongo (23:14:19)
The Hurricane Hunters fly criss-crossed patterns through the eye and eyewall structure, taking measurements and releasing dropsondes. they can usually find the center of the cyclone fairly accurately. for instances where they can’t find the exact location or couldn’t sample the center, they have fairly accurate correlations and can make a best guess for minimum central pressure. these adjusted readings are rarely more than 2-3 mbar lower than the lowest recorded pressure reading.
hope that helps!
Ryan – Thanks a lot. This was a very interesting article. I’m afraid this information will likely not make it to the MSM to balance the global warming = more, bigger hurricanes hysteria.
I remember the mania that broke out after the 2005 hurricane season – how ** people ** were blamed for hurricanes because they didn’t support radical global warming policies! Here’s a good synopsis of the scientific debate that occurred back then:
http://www.junkscience.com/feb06/WSJ.com-Hurricane_Debate_Shatters_Civility_Of_Weather_Science.pdf
Here are our local records broken for NE Oregon SE Washington-as of yeaterday:
http://www.wunderground.com/US/OR/502.html#REC Courtesy of Weather Underground.
No it’s not Heat, but cold-quite cold…
Al Gore is full of…..
Re: Chris (00:45:55) :
Totally agree. I have been following the media, the published science and observations for the past 5 to 10 years surrounding AGW.
I think there is a trend – the more data that comes in which refutes that theory of AGW, the more strongly worded, frequent and fantastic the press releases and claims have become from the Alarmist AGW camp.
It tells me 2 things:
1) the science was never there to begin with
2) the Alarmists are panicking and going to even more extreme claims in order to keep the political momentum and public fear up
“Al Gore is full of…..”
…Second Breakfast? 😉
Andrew
Hmmm, perhaps this sort of thing just might explain what I commented on earlier…
Made-to-order global threats, and free delivery for any climate of your choosing if you get your credit card ready and call now? They may as well hire Billy Mays as Global Climatology Czar at this point…
Bill Illis
I agree with you that the pattern of AMO and PDO could explain the posted ACE curve. One of the the common threads between 1970’s and the 2008/2009 periods is both AMO and PDO were negative then [from 1964-1976] and are again neagtive now .PDO went negative 1n 2007 and AMO has been negative in jan/feb 2009. The 1993,1998 and 2006 peaks seem to correspnd to peaks in either the AMO or the PDO or both.
Re: Parse Error (06:04:24) :
“Made-to-order global threats, and free delivery for any climate of your choosing if you get your credit card ready and call now? They may as well hire Billy Mays as Global Climatology Czar at this point…”
ONLY $19.95 AFTER MAIL-IN REBATE….HERES HOW TO ORDER
Hahahahaha
(If I wasn’t laughing about this, I’d be crying with dismay on the state of Climate Science)
The data was updated through March 12, 2009, which includes all of Hamish, one of the highest ACE storms of the last couple years. The Southern Hemisphere activity is remarkably weak with many short-lived tropical storm strength cyclones. There just isn’t much time left to make up the deficit.
Also, the 24-month running sum plot has NO smoothing. This plot will always exist and the recent downturn is cemented in history.
The definition of “willy-willy” is rather nebulous since it is slang. The online dictionaries have different ideas on it, but one interpretation is “severe tropical cyclone”.
The monthly and annual AMO and PDO indices both started their decline after the 2005/2006 peak period as did the ACE curve above.
Douglas I hear ya! The usual trend is to go up in March. The current highs and lows are heading SOUTH! You gotta look at these Pendleton station graphs.
http://www.wrh.noaa.gov/climate/temp_graphs.php?stn=KPDT&wfo=pdt
Interesting correlation with the loss of solar activity, less energy from the sun, less energy in cyclones. My understanding, poor as it may be, is that cyclones are fueled by high SST. Another indication that GW is not in Hansen’s ‘pipeline’.
Neil Jones (22:50:04), just checked the current side-by-sides on Cryosphere, their color scheme seems to be the same as a year ago. Interesting how they choose warm colors to mean greater ice.
re: the above graph page. The pull down menu allows you to change stations and will give you an idea of how regional this March weather is. You can see Jan, Feb, and Mar. You can also change to 2008 to compare. This year is WAY colder than last.
Re: Mike (04:16:59) :
If AGW causes hurricanes, what causes lack of hurricanes …?
One is “Climate”, the other is “Weather”?
kidding 🙂
I think the answer is AGW is irrelevant to both…
Neil Jones: They still are not showing anything from 2009 in the side-by-sides though. On the graph of extent for the NH, they are claiming less extent for 2009 vs. 2008.
It’s Elvis and the space aliens. They are the ones doing all of this !!! George W Bush is their leader. He did blow up the levies in New Orleans, since they were designed to take a category 3 storm and were hit with only a Cat 5.
Sad thing is, I know several people who swear the CIA blew the levies in New Orleans to kill them. One of them still lives in the same house with a water mark 1m high on all walls, all over the house, a whole in the floor from damage, but they got the government checks to fix it. They got an Escalade and a Lexus coupe, plus a massive TV that cost more than $10,000. They are waiting for another check so they can get their daughter an Audi. Not fix the damage.
Drive around New Orleans now and you see lots of new cars, but not many homes that got fixed. Terrible site to see.
mark (20:16:31) :
i wonder if Gore will update his slideshows….
Again?
His most gracious Highness, Lord of the darkest and most noxious greenhouse gases, the Prince of the last remnants of frozen antartic territories, the One who was so clever as to stir up the deep slumber of sleeping consciousnes of the most despicable commons by teaching them with words of wisdom how to manage the world order, how not no breath, how not to dare farting, they and their so numerous cattle without paying previously to their Mighty Excellence a most convenient and liberating tax, the Prince of dark and filthy methane, will soon bless us with His Presence in the coming Summer season, to enlight us with truths uttered by His most admirable mouth, through words born deep in His always growing and magnificent belly His most wise sayings and new warnings referring to all the new calamities, we the commons have originated, and how He, as a punishment, has cleverly decided that, instead of warm, COLD will afflict us. This new era, so HE has decided, will bear HIS NAME to remind us WHO our Lord is and how we are suppose to behave before the ominous commandments He graciously pronounces, always for our wellbeing.
Re: westhoustongeo (04:37:57) :
I thought you would never ask! A thunderbox is an old aussie backyard dunny (lavatory). In the outback it wasn’t of the sturdiest construction.
Thought it would be interesting to compare ACE with solar activity. Using Oulu’s neutron count as an inverse proxy for solar activity, I took the neutron count for the same time period, inverted it and overlaid it on Ryan’s graph. There seems to be a few year’s lag between solar peaks and ACE peaks. If the correlation is causal we are in for a continuing plunge in ACE.
http://i40.tinypic.com/282nm1y.jpg