reposted from ICECAP
By Dr. Richard Keen, University of Colorado
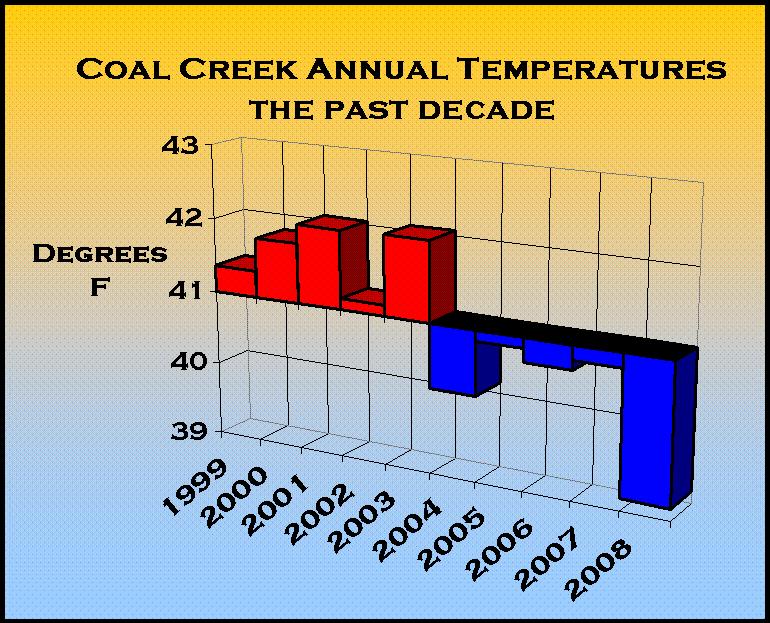
I’m the NOAA co-op observer for Coal Creek Canyon, Colorado, elevation 8950 feet, in the foothills NW of Denver. Here is a graph of average temperatures for the past ten years. 2008 is by far the coldest year in the past decade, with an average of 39F.

See larger image here.
That’s full 3 degrees F colder than 2003. Each of the past five years is colder than any of the previous five years.
This is only one station of the thousands in the NOAA co-op network, but I thought I’d show you the data before it’s adjusted and homogenized by the usual suspects.
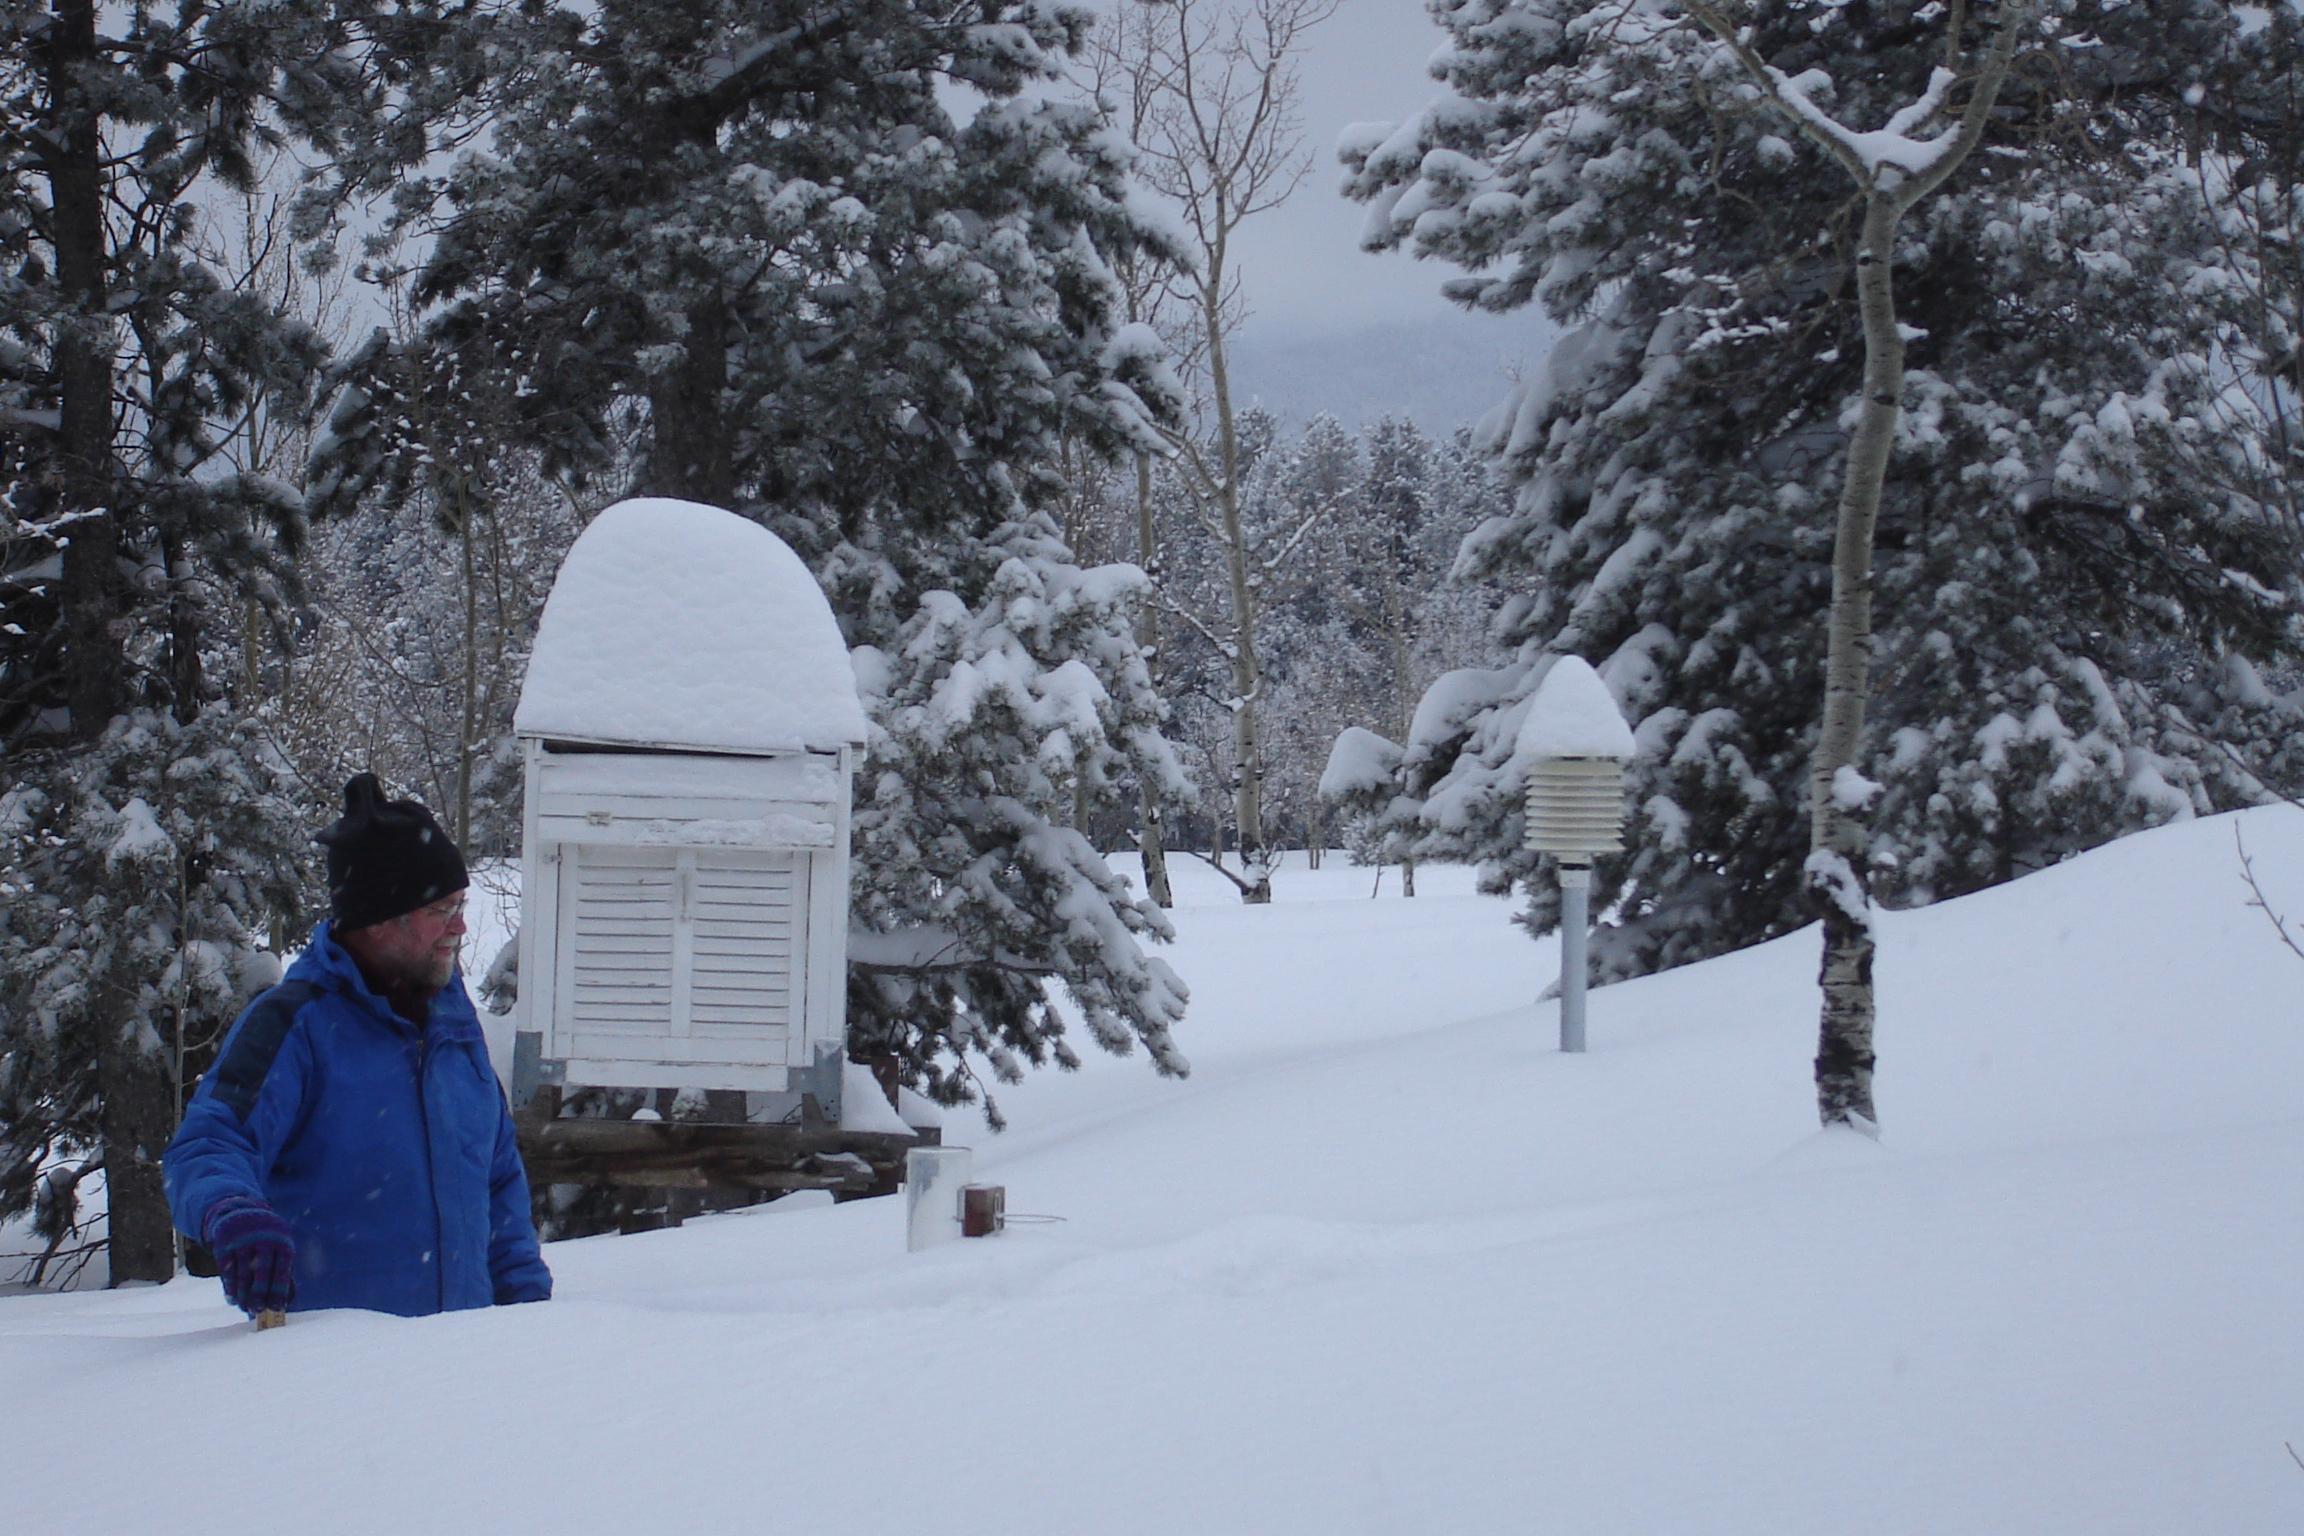
Here’s a photo of the station in January 2007, in the midst of a record round of snow storms in Colorado.

See larger photo here.
Patrick Henry:
“Wolf Creek Ski Area in Colorado has already received 20 feet of snow this winter.
http://www.wolfcreekski.com/snow.asp
Meanwhile, Boulder climate experts predict the demise of the ski industry, due to a lack of snow.
http://www.iht.com/articles/ap/2008/12/16/sports/SKI-Disappearing-Snow.php ”
They have an excuse:
http://www.google.com/hostednews/ap/article/ALeqM5ieNs1iJBpTVuD3_nG9ZB8sqffFEAD95IQD680
Brooklyn Red Leg (20:49:31)
I love it. Like “you measured the temperature in your house but didn’t put the thermometer in the oven??? Don’t you know that’s the hottest place in the house??? The most important place??? (How can people who aren’t peer reviewed climate scientists be this stupid?)”
ak,
So we’ve got global warming, Coal Creak is on the globe so why is it colder? There could be plenty of reasons, but you don’t say.
the_Butcher:
NZ may be *ahem* ‘burning’ [40 deg C = 104 deg F], but remember that NZ is in the Southern Hemisphere, so this is the equivalent of July 7th in the NH. A local heat wave of 40 degrees occurs fairly routinely some time in mid-summer. Let’s look at the NZ temp again next week.
In other predictions, I confidently predict that someone will remind folks from now until Monday not to get complacent, but to vote every 24 hours: click
The link makes it super easy! Just click & vote. Thanks. You are truly a good person. Collect your 100,000 carbon offsets here.
I have seen the work you have been doing on locations of weather stations Anthony so you won’t be surprised to know that most of those in capital cities of Australia are located at airports. Either civilian or at RAAF sites. Here are the locations kindly brought to you in one diagram by the Bureau of metrology. Just click on the orange dot to see a picture of each location.
http://www.bom.gov.au/climate/change/reference.shtml#rcsmap
Thanks Michael (00:32:56)
I looked at that page yesterday but didn’t click on those links just ran my cursor over some to find the location name. What most non-Australian citizens (and those who live in the major cities and never get out of the suburbs) should realise is that the airports where most of these BOM instruments are located are pretty timid affairs. Rather than calling them airports they should be reclassified as places where an occasional aeroplane might land or take off. See Oodnadatta Airport BOM site for instance 😉 Notice how they are fenced off? That stops the dingos p%$sing on them and cause a break in the drought 🙂
More OT after three days in the high 30’sC today we dropped to 26C. Currently 16C (8:15pm) wi a dreich haar blanketing the gloomy gloming. Summers delayed while GW reappears for a couple of days.
L.K.
I would guess that a lot of snow on top of the shelter would decrease minimum night time temperature as the top is insulated against the cold night sky. Similarily, maximum day time temperature is lowered. During winter the former probably dominates, but I can’t tell if it is significant.
Best,
avfuktare vind
Sorry,
“increase minimum night time temperature” it should have been!
Dear Dr. Keen,
it may help to include the years 1997 and 1998 in your graph, then one could see, whether the 1997 El Nino left a fingerprint also at your station.
Re Arctic sea ice:
Crosspatch is correct. The situation in the UK is that due to an intense High over Northern Europe and Scandinavia, southerly winds have predominated in Scotland, while North Easterlies have predominated in England, leaving England FAR cooler than Scotland for the past month at least. This has drawn cold air away from the Atlantic side of the Arctic, while drawing warm Atlantic air North over Greenland etc.
As to Tim Jenvey’s query, I have one of my own- why is it that the comparator line in the nsidc daily chart has flip-flopped between 2006-7, as it was some months ago, then 2007-8, for several months until recently, and now apparently has returned to the 2006-7 line?
See: (current)-
http://www.nsidc.org/data/seaice_index/images/daily_images/N_timeseries.png
(Oct 2008)- http://www.nsidc.org/images/arcticseaicenews/200812_Figure2.png
I do find this odd, and the cynic in me wonders if the comparator is chosen to intuitively suggest the “lowest” apparent current value.
Light hearted off topic;
looks like Wind Turbines are also starting to affect Aliens…
http://www.thesun.co.uk/sol/homepage/news/ufos/article2108149.ece
Mike wrote
No wonder you get cold readings . Lokk at the snow on top of the shelter cooling it . LOL
No wonder you didnt get reply Joe
Le sigh. New Zealand is not burning up at 40C. It was one suburb in Christchurch on one day. The rest of us are at a nice 25-30C.
Summer is nice.
Cooling at “Coal Creek”? I assume then that all that nasty black coal at Coal Creek has been left in the ground, otherwise there is no way there would be cooling there?
Yes, NZ is in the middle of summer. I am sitting almost on top of the equator and wore a jumper today. 23oC is pretty cold in these parts.
BTW – thank you Michael for the Aussie weather stations web page link. That will make a great theme for some sight seeing.
ak, I’m not sure how this is irrelevant. Any chance of clearing this up?
Steven Horrobin (01:40:50) :
It is consistent (kind of) in that they are always comparing with 2007. In the lead up to the start of the melt (which we are in now) you would be more interested in comparing with the 2006-2007 rather than the end of 2007-2008.
During the melt the comparison is just with 2007.
During the recovery they compare it with the end of 2007 and beginning of 2008.
If they are going to compare this year with 2007 then they have to flip from comparing the recovery phase (2007-2008) to comparing the melt phase (2006-2007) at some point.
Hey butcher,
I just checked the NZ temps on world weather, the Max. for today was 29C, how did you measure the temp?
Regards, Freddie in the Swiss mountens, freezing my *** off.
“New Zealand is burning at the moment with temperatures of +40C”
Not sure what planet you’re on but down here temperatures are all around the mid to late 20’s at the moment. Maximum recorded temperature in Auckland so far this month is 27C, Wellington official max is 21C.
BQ.
When the snowfall is WAIST DEEP, I’ll give the guy a break on some snow accumulating on top of the instrument ‘shacks’….
Interesting graph…the daily dose of ‘the world is ending due to man-made climate change’ is almost a conspiracy. Thanks to you (Anthony) and others, we have evidence to tell the alarmists ‘not so fast’…
Thanks for keeping me informed…
~Michael
http://www.cookevilleweatherguy.com
OT, but for the wind turbine story fans out there this one is quite interesting.
It seems that others in the universe are not so keen on the things either.
(I should point out that Lincolnshire has been under a high pressure zone for the last two weeks or more so the blades were probably not turning that quickly.)
“L.K. (22:54:42) :
To all who think snow on top of the “housing” will makesa difference in an annual measurement…why not try an actual experiment?
Get two thermometers, and put one of them in tupperware.
Put them both in your freezer, and put ice on top of the tupperware.
Is there a difference? ;-)”
But that’s only half of the experiment…
You then need to take the same two thermometers, AND ice covered tupperware out side in the sun and take another measurement.
Is there a difference?…I think so now.
JimB
Anthony
I’m sure you have seen the amazing letter James Hansen and his wife have written to President Elect Obama and his wife. From the beginning, where he addresses them as “Barack and Michelle” it is a case study in unapologetic megalomania. I have long suspected that he has several loose screws rattling about under his dome; now I’m convinced. What he doesn’t know about economics can hurt the rest of us if his suggestions are adopted. It doesn’t say much for the rigor he fails to use with the rest of his work. I’d love to see a post by you or one of your contributors on this.
REPLY: The letter has gotten wide coverage elsewhere, I find it so fawning and distasteful that I’ve chosen not to cover it here. – Anthony
hmmm, this is odd. I tried to search for this weather station on gisstemp website to get the raw and homogenized data. Here’s a result of stations withing 243km of Denver, CO:
http://data.giss.nasa.gov/cgi-bin/gistemp/findstation.py?lat=39.78&lon=-104.87&datatype=gistemp&data_set=2
Not a single station has data newer than 2007??? Is this correct? What happened to all these stations? Do they report just once a year? Or have they all stopped reporting?
Avfuktare vind vindsavfuktare (01:18:32) the sides of the Stevenson Screen have open slats, it’s ventilated. Unless the snow completely buries it, there won’t be a significant difference.
Patrick Henry: I lived in the Loveland/Ft. Collins area for twenty years and never heard of Coal Creek. Google maps says it is SW of the Springs, but I assume Dr. Richard Keene knows if he is NW of Denver or not. Can you tell me where this is?
Just a guess, but I would expect the snow to slow the rate at which the box warms. Especially once the air temperatures get above freezing. There’s also the worry that if the air temperatures get to be just below freezing and the sun melts some of the snow, refreezing water could block the slats on the side, reducing air flow through the unit.