From ICECAP
By Joseph D’Aleo CCM, AMS Fellow
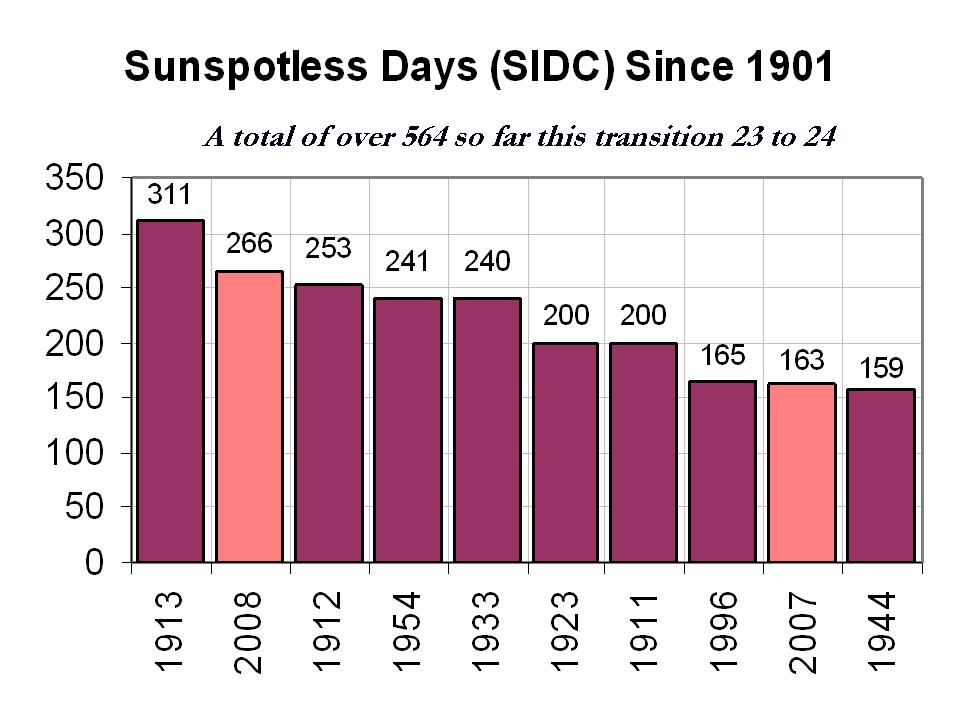
2008 will be coming to a close with yet another spotless days according to the latest solar image.

This will bring the total number of sunspotless days this month to 28 and for the year to 266, clearly enough to make 2008, the second least active solar year since 1900.

See larger image here.
The total number of spotless days this spolar minimum is now at around 510 days since the last maximum. The earliest the minimum of the sunspot cycles can be is July 2008, which would make the cycle length 12 years 3 months, longest since cycle 9 in 1848. If the sun stays quiet for a few more months we will rival the early 1800s, the Dalton Minimum which fits with the 213 year cycle which begin with the solar minimum in the late 1790s.

See larger image here.
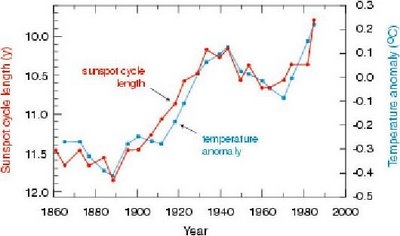
Long cycles are cold and short ones like the ones in the 1980s and 1990s are warm as this analysis by Friis-Christensen in 1991 showed clearly.

See larger image here.
In reply to the arguments made that the temperatures after 1990 no longer agreed with solar length, I point out that it was around 1990 when a major global station dropout (many rural) began which led to an exaggeration of the warming in the global temperature data bases. Also the length from max to max of 21 to 22 was 9.7 years and cycle 22 length min to min 9.8 years, both very short suggesting warm temperatures in the 1990s. The interval of cycle 22 max to cycle 23 max centered in the mid 1990s began to increase at 10.7 years and the min to min length of cycle 23 is now at least 12.3 years.
With the Wigley suggested lag of sun to temperatures of 5 years and Landscheidt suggested 8 years, a leveling of should have been favored around 2000-2003 and cooling should be showing up now. Looking ahead, put that together with the flip of the PDO in the Pacific to cold and you have alarming signals that this cooling of the last 7 years will continue and accelerate.
Phil
No point arguing with you. The paper link to the graphic was provided just before the graphic.
The authors were not aware that of the dodgy nature of the temperature data and I believe backed off too soon. Yes the trend in the MSU has been similar but much smaller than the surface station data sets and all data sets are showing cooling since 2001.
I would love to replicate their analysis. We have good data on cycle length now through 2000 and soon 2008/09 when minimum is finally agreed on. But the only trustworthy temperature data is MSU and it only goes back to 1979. The errors in the other data sets increase after 1990.
How is the mood these days at Hadley?
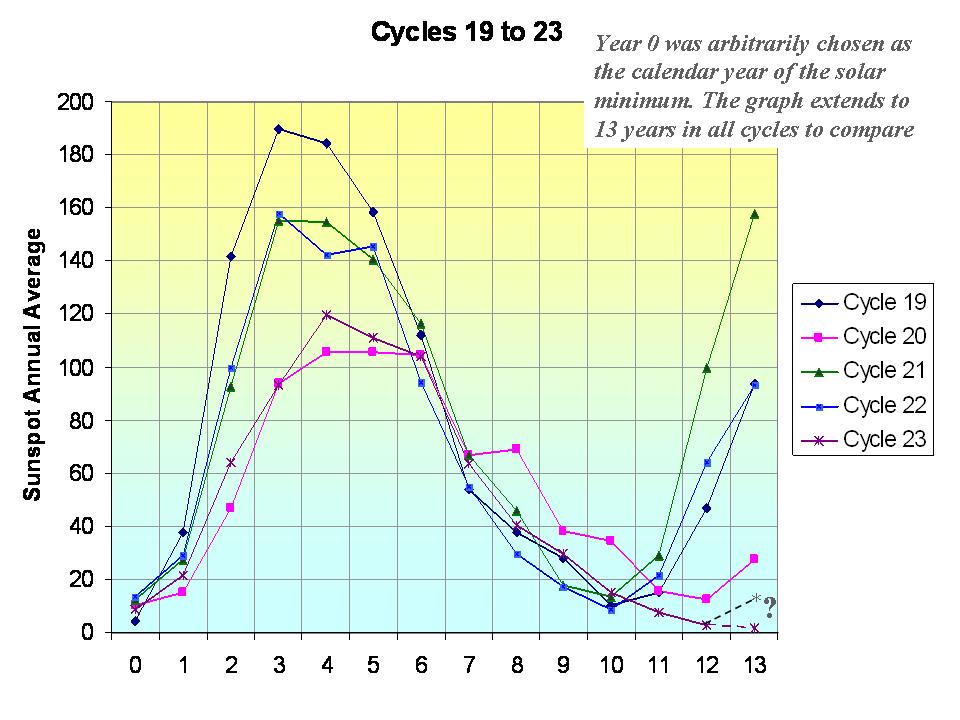
There is now an opdate to the “Evolution of spotless days in SC23-24 and comparison with other cycle transits”. We now have 510 spotless days.
http://users.telenet.be/j.janssens/Spotless/Spotless.html#Evolution
Observe how the SC24 spotless days curve appears to grow rapidly still. The minimum could be very late.
SIDC ISSUES “ALL QUIET ALERT”
Issued: 2009 Jan 02 1215 UTC
:Product: documentation at http://www.sidc.be/products/quieta
#——————————————————#
# From the SIDC (RWC-Belgium): “ALL QUIET” ALERT
#—————————————–#
START OF ALL QUIET ALERT …………………..
The SIDC – RWC Belgium expects quiet Space Weather conditions for the next 48 hours or until further notice.
This implies that: * the solar X-ray output is expected to remain below C-class level, * the K_p index is expected to remain below 5, * the high-
energy proton fluxes are expected to remain below the event threshold.
Leif Svalgaard (19:12:16) :
My seven-year old grandson [Peter] for one. I was looking at http://sidc.oma.be/html/wolfaml.html and he looked over shoulder and commented: “it sure looks like the next one will be small as the three drawings look pretty much alike”.
Absolutely!
I hope that young Peter one day may also agree with this one,
http://www.vukcevic.co.uk/extrapolation.gif
despite his highly respected grandfather is most categorically refusing even to consider possibility.
Assuming we are heading for a major minimum, I know there has been some discussion of how deep it could be. A Maunder- or Sporer-like minimum would be serious, but surely temperatures weren’t that badly depressed during the Dalton Minimum? I seem to remember that from a recent discussion here.
What were the ocean cycles doing during the Dalton minimum? Recent analyses posted here or in comment links, don’t go back that far, I assume due to unreliability of data. My curiosity is mostly to counter a few AGW believer friends who give the usual ‘global warming will resume when the sun wakes up again’ answer.
anna v (04:48:47) :
Nice observation by the way.
I wish he would throw in the cycles previous to 10 to see how they stack up.
Scotty, I need more data.
Joe D’Aleo (05:46:31) :
Phil
No point arguing with you.
Not if you continue to justify sharp practice.
The paper link to the graphic was provided just before the graphic.
Indeed to a pay site which most of your readers would not be able to access, all the more reason you should include the caption. A graph without its caption is meaningless.
The authors were not aware that of the dodgy nature of the temperature data and I believe backed off too soon.
At issue was the dodgy nature of their period data.
Yes the trend in the MSU has been similar but much smaller than the surface station data sets and all data sets are showing cooling since 2001.
Not true see here for example: MALWARE SITE DELETED
I would love to replicate their analysis. We have good data on cycle length now through 2000 and soon 2008/09 when minimum is finally agreed on.
And as shown by Lockwood and Frӧhlich it doesn’t show the correlation that F_C&L claimed.
http://publishing.royalsociety.org/media/proceedings_a/rspa20071880.pdf
But the only trustworthy temperature data is MSU and it only goes back to 1979. The errors in the other data sets increase after 1990.
I suggest you look at the graph I referenced above.
How is the mood these days at Hadley?
How would I know?
Ellie in Belfast and Robert Bateman
I created this graph to show Hadley CET and sun spot activity back to 1750 in order to see if there were any correlation. The closer to the bottom the green line goes the colder it was. There was about a 70-% correlation but I was told that the electro magnetic activity showed a better fit than sunspots.
I was intending to insert pdo’s, the trade winds and various other information.
If someone will give me a link to the digital data I’ll have a go at graphing it-alternatively people are welcome to use the information in this clickable excel sheet.
http://cadenzapress.co.uk/download/sunspots_mencken.xls
TonyB
vukcevic (07:38:54) :
I hope that young Peter one day may also agree with this one,
http://www.vukcevic.co.uk/extrapolation.gif
I don’t think he will, as it is clear that the two curves are not that well correlated.
despite his highly respected grandfather is most categorically refusing even to consider possibility.
To quote Hathaway [quoting Yogi Berra]: “If I hadn’t believed it, I wouldn’t have seen it”.
Ellie in Belfast (08:13:53) :
but surely temperatures weren’t that badly depressed during the Dalton Minimum?
The cold that there was was mostly due to major volcanic activity.
TonyB, interesting.
I’ve tried looking at the Armagh data. Having read Leif’s posts that TSI does not vary enough, I was looking for influences during the Dalton minimum in Ireland, since there’s already been a correlation proposed for Armagh temps and the NAO, but later in the series. There is slight warming over the Dalton min period, but the most interesting data are seasonal trends (milder Fall and Winter; cooler Spring and Summer), which point either to cloud (Svensmark) or ocean influence.
Would be interesting to compare the CET and Armagh data. I’ve avoided the ability to publish on a personal web page til now, but I’ll get on to it so i can post a link.
Leif, I haven’t gotten to as far as thinking about volcanic influences yet, but i will – thanks.
“My curiosity is mostly to counter a few AGW believer friends who give the usual ‘global warming will resume when the sun wakes up again’ answer.”
Oh, the irony. 🙂
nobwainer (Geoff Sharp) (02:58:38) :
“Thanks Tallbloke…but isnt it a great time to be alive and aware. This is all new ground for me…but the further i dig the better it looks.”
What a puzzle! And we certainly live in interesting times. just a thought, have you tried comparing the magnitude of the historical minima with the position of the U+V+J+S alignment with respect to the solar 7 degree axial inclination? I have reason to believe the effect may be more pronounced when the planetary alignment occurs in a position closely aligned with the direction of the suns tilt. The rate of solar precession is very similar to earth’s, about a degree every 72 years.
vukcevic (07:38:54) :
I hope that young Peter one day may also agree with this one,
http://www.vukcevic.co.uk/extrapolation.gif
Leif Svalgaard (11:51:31):
I don’t think he will, as it is clear that the two curves are not that well correlated.
He might like to look at this one as well.
http://www.vukcevic.co.uk/combined.gif
Solar cycles are a bit like my telephone bill; paid last day of the month, may be 28thor or 30th or 31th or even 29th , but different amount every time.
For the waveforms equations look at:
http://www.vukcevic.co.uk and select LANL link
Tallbloke (13:33:17) :
What a puzzle! And we certainly live in interesting times. just a thought, have you tried comparing the magnitude of the historical minima with the position of the U+V+J+S alignment with respect to the solar 7 degree axial inclination? I have reason to believe the effect may be more pronounced when the planetary alignment occurs in a position closely aligned with the direction of the suns tilt. The rate of solar precession is very similar to earth’s, about a degree every 72 years
Sounds interesting. I suspect if it showed a trend it would be small, but will look into it. What I have noticed is, that its the positions of only 2 planets at the end of the day. N+U always come together the same (naturally) but its the quality of how J+S are lining up at the time that really matters. From 1280 till now (now is getting a lot weaker) was a window thats starts to strengthen after the MWP and continues for 700 or so years. I have gone back 3000 years with Angular Momentum graphs as well as solar system viewers and its pretty clear how unusual this past period has been. I might have a go at the most aligned days project…I see that Desmoulins offers his program on his website.
Leif Svalgaard (11:51:31) :
The cold that there was was mostly due to major volcanic activity.
If memory serves me correctly there were 2 major eruptions during that period (1 unknown) that would have had an impact. But these impacts are mostly over in 1 yr and some effects might linger for 3 yrs as recent temperature movements in pinatubo, krakatoa suggest (they also show a very small cooling that fits amongst the normal fluctuations). Claiming 40 yrs of cooling by volcanoes is probably stretching it a bit.
Leif Svalgaard (11:51:31) :
Ellie in Belfast (08:13:53) :
but surely temperatures weren’t that badly depressed during the Dalton Minimum?
The cold that there was was mostly due to major volcanic activity
So did any major volcanic outbreaks happen just before 1812? The famous Minard diagram shows how how Napoleon’s army was decimated in October-December 1812 by extremely cold weather (-38C at worst) during retreat from Moscow
http://www.math.yorku.ca/SCS/Gallery/minard/minard-odt.jpg
The Tambora outbreak didn’t happen until 1815
http://en.wikipedia.org/wiki/Mount_Tambora
Phil:
Not true see here for example: MALWARE SITE DELETED
There is nothing AT ALL of interest at that site. I question virtually everything on it, and the motive of the author(s). Linking to that graphic was completely pointless.
I DON’T BELIEVE IT.
Find another.
890m.com
Red Verdict Image
In our tests, we found downloads on this site that some people consider adware, spyware or other potentially unwanted programs.
Are you the owner of this site? Leave a comment
Contact information: Popularity
A few users
Automated Web Safety Testing Results for 890m.com
e-mail tests for 890m.com:
Download tests for 890m.com:
Downloads we found on this site:
Download Analysis
mario.exe
BackDoor-CEO trojan
Unlocker 1.8.7 (unlocker1.8.7.exe)
006-Garage.zip
008-WINDOWS.zip
009-SouljaBoy.zip
Phil.
Please do not provide links to malware sites such as “cc890m”
Doing so again will result in permanent loss of your posting privilege here.
Fair warning. No second chances. I don’t tolerate this sort of thing at any level.
Anthony
Ouch! My detectors were silent on that site… but looking through the logs, I see the problem.
Sorry for quoting it!
Carsten Arnholm, Norway (17:56:39) :
So did any major volcanic outbreaks happen just before 1812?
The Tambora outbreak didn’t happen until 1815
You may safely assume that statements I make are based on evidence of sorts, e.g.:
“Ice core evidence for an explosive tropical volcanic eruption 6
years preceding Tambora” Authors: Dai, Jihong; Mosley-Thompson, Ellen; Thompson, Lonnie G.
Publication: Journal of Geophysical Research (ISSN 0148-0227), vol. 96, Sept. 20, 1991, p. 17,361-17,366.
Abstract
High-resolution analyses of ice cores from Antarctica and Greenland reveal an explosive volcanic eruption in the tropics in A.D. 1809 which is not reflected in the historical record. A comparison in the same ice cores of the sulfate flux from the A.D. 1809 eruption to that from the Tambora eruption (A.D. 1815) indicates a near-equatorial location and a magnitude roughly half that of Tambora. Thus this event should be considered comparable to other eruptions producing large volumes of sulfur-rich gases such as Coseguina, Krakatau, Agung, and El Chichon. The increase in the atmospheric concentration of sulfuric acid may have contributed to the Northern Hemisphere cooling observed in the early nineteenth century and may account partially for the decline in surface temperatures which preceded the eruption of Tambora in A.D. 1815.
—–
There is further strong evidence in the 10Be flux [which is distorted by sulfuric acid aerosols] around that time of major volcanic activity, see e.g. the Figure on page 2 of http://www.leif.org/research/TSI%20From%20McCracken%20HMF.pdf as well as around Krakatoa in 1883 and Hekla around 1700.
—–
Lastly, one should not make too much of a single Russian winter. 1942 was a bad one too and no sunspots or volcanic activity to blame…
CodeTech (18:30:52) :
Phil:
Not true see here for example: MALWARE SITE DELETED
There is nothing AT ALL of interest at that site. I question virtually everything on it, and the motive of the author(s). Linking to that graphic was completely pointless.
I DON’T BELIEVE IT.
Find another.
Your personal incredulity is irrelevant, here’s another plot of the same data, I’m sure you’ll find it just as unpalatable: http://atmoz.org/blog/2008/02/27/4-global-temperature-anomalies-say-the-same-thing/
nobwainer (Geoff Sharp) (15:01:38) :
linger for 3 yrs as recent temperature movements in pinatubo, krakatoa suggest (they also show a very small cooling that fits amongst the normal fluctuations). Claiming 40 yrs of cooling by volcanoes is probably stretching it a bit.
Several comments: Volcanoes differ extremely in how much sulfuric acid they produce. The 10Be-record distortions suggest that the effects lasted of the order of a decade, both for the 1800s and for Krakatoa. The Dalton minimum [such as it was] didn’t last 40 years but only about half that from 1799 to 1824 and the cooling didn’t last 40 years only, but perhaps only a decade or less [ see e.g. http://www.leif.org/research/cet2.png for Central England Temperatures or http://home.casema.nl/errenwijlens/co2/europe.htm for Central Europe]
Claiming 40 yrs of non-existing cooling on Uranus being in the House of Aquarius is probably stretching it quite a bit.
wattsupwiththat (18:45:24) :
Phil.
Please do not provide links to malware sites such as “cc890m”
Doing so again will result in permanent loss of your posting privilege here.
Fair warning. No second chances. I don’t tolerate this sort of thing at any level.
Anthony
Sorry if it caused problems, I was unaware of any problems with the site, it’s hosted on WordPress as this one is, I would have thought they’d have counter measures?
I’ve notified the owner.
Reply: Point of information Phil (and Anthony). That site uses WordPress software, but is not hosted on WordPress.com. It appears to be a hosting company under a private address. Probably not all sites hosted there contain malware, but the top level domain has been reported for such behavior by commercial security companies, which means some (perhaps all) of the sites hosted below that top level domain do, and are tolerated by the host. The owner of the blog may want to move to a less problematic host.
~ charles the moderator
Leif Svalgaard (20:38:24) :
This link to the met office shows Hadley temp at that timescale, there is a 40 year cool period from around 1790-1830 which no doubt has some influence from eruptions….
http://www.metoffice.gov.uk/research/hadleycentre/obsdata/cet.html
but it was already cold and as we can see by the giss records Krakatoa “maybe” reduced the temp by .1degC after 1883, 3 yrs later it was on the way up. Such a minor movement could be caused by many other factors as well. Not very convincing. I still think your overplaying the volcano factor. 10Be records are also affected by reduced solar activity.
http://data.giss.nasa.gov/gistemp/graphs/Fig.A2.lrg.gif
The Dalton was certainly no badboy in grand minima terms, but was right on schedule with its timing and modulation, just like the 3 previous minima and like the one we are in now….lucky this one will be even weaker.
New Dalton ?
http://www.vukcevic.co.uk/extrapolation.gif
(periodicity only – blue , amplitude – red )
For the waveforms equations look at:
http://www.vukcevic.co.uk LANL link
New Dalton ?
The above link should be:
http://www.vukcevic.co.uk/combined.gif