From ICECAP
By Joseph D’Aleo CCM, AMS Fellow
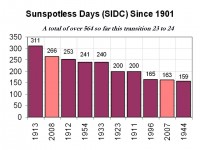
2008 will be coming to a close with yet another spotless days according to the latest solar image.
This will bring the total number of sunspotless days this month to 28 and for the year to 266, clearly enough to make 2008, the second least active solar year since 1900.
See larger image here.
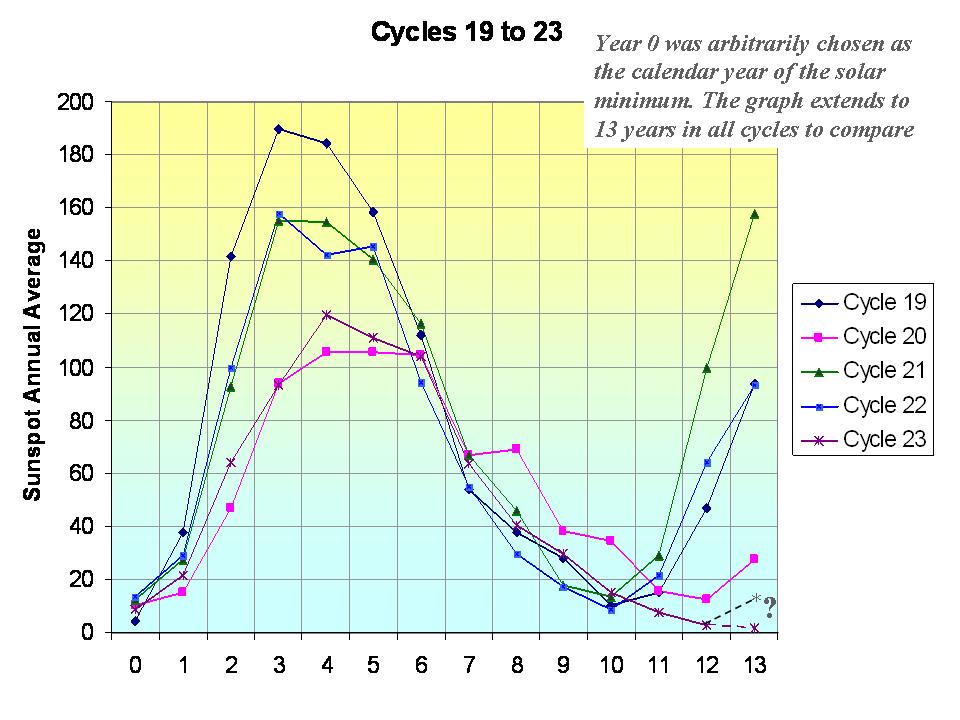
The total number of spotless days this spolar minimum is now at around 510 days since the last maximum. The earliest the minimum of the sunspot cycles can be is July 2008, which would make the cycle length 12 years 3 months, longest since cycle 9 in 1848. If the sun stays quiet for a few more months we will rival the early 1800s, the Dalton Minimum which fits with the 213 year cycle which begin with the solar minimum in the late 1790s.

See larger image here.
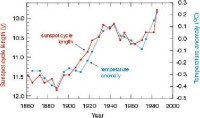
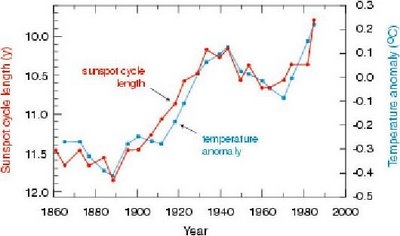
Long cycles are cold and short ones like the ones in the 1980s and 1990s are warm as this analysis by Friis-Christensen in 1991 showed clearly.
See larger image here.
In reply to the arguments made that the temperatures after 1990 no longer agreed with solar length, I point out that it was around 1990 when a major global station dropout (many rural) began which led to an exaggeration of the warming in the global temperature data bases. Also the length from max to max of 21 to 22 was 9.7 years and cycle 22 length min to min 9.8 years, both very short suggesting warm temperatures in the 1990s. The interval of cycle 22 max to cycle 23 max centered in the mid 1990s began to increase at 10.7 years and the min to min length of cycle 23 is now at least 12.3 years.
With the Wigley suggested lag of sun to temperatures of 5 years and Landscheidt suggested 8 years, a leveling of should have been favored around 2000-2003 and cooling should be showing up now. Looking ahead, put that together with the flip of the PDO in the Pacific to cold and you have alarming signals that this cooling of the last 7 years will continue and accelerate.
I’ve wondered often about “harvesting the crop” that is raised, tended and matured on so many threads here.
Phil’s request for the “faulty” graph of Friis-Christensen to be replaced has flushed out the questionable antics of Schneider and the scurrilous behaviour of Damon and Laut: but has Phil taken this in, let alone checked it? And though no much-desired update to Friis-Christensen has appeared, TallBloke rose to the occasion with a graph at WoodForTrees. Both TB and WFT are examples of citizen science at its best IMHO. I plan to add TB’s graph to my Climate Science Primer – TB as you ok with that?
James Hastings-Trew has been helped by various readers and has expressed appreciation. Magnus has been in great form with a funny U-tube and serious comments. Leif’s absence is noticed – but his “double pendulum” image for multiple cycles is working away in people’s minds! We’re reminded that the coming minimum deserves to be – or has been – named after Landscheidt whose pioneering solar work is inspiring many scientists to take the solar cycles seriously as climate drivers.
My high spot of learning was from jorgekafkazar: UV flux has dropped by about 1/2 lately; x-rays are down by 10000:1; magnetic flux varies by about 3:1 over a solar cycle. There is also the interplanetary magnetic field, which has dropped off by 10:1 since July of 2003 (peak value 35 –> 3.5). TSI is a constant; these others are wild-ass variables.
I feel, as do many others no doubt, that though TSI has remained too constant to explain our climate variations, the longer-term variety HAS to go back to the Sun – somehow – and if TSI won’t do it, then it must be factors as yet not spotted, or not correlated, or not shown as reasonable cause-and-effect, or not demonstrated as amplifiers of weak signals.
I ponder the sad degradation of Climate Science that has happened, and what can little me do when there should be thousands of university students, PhD graduates, professors, and Nobel Prizewinners up in arms about this. I remember the story of the Emperor’s New Clothes. I ask for help from Source.
There is far, far more than I can name or appreciate. We all keep on working at it all.
Michael S (19:08:32) said:
“jorgekafkazar (18:00:20) :
‘The Earth core and oceans are both conductors, one strong, one weak.’
“I’m not so sure the ocean as a conductor would be considered weak. Resistance should increase with distance linearly, but decreases with area of the conductor linearly as well. It’s a long distance but also a huge area. Just guessing here but I would be inclined to think that current would flow very easily through the oceans especially if you consider all the possible paths of the circuit… Has anyone published anything on this concept? Looking up the conductivity of ocean water…
Anyone know where to find examples of the cyclical nature Jorge mentions?”
Michael-san: Yes, the oceans are a dandy conductor, though probably not as good as the Earth’s core. I’m not sure how to quantify any of this, as yet. It’s also possible that the Earth’s crust also is an effective conductor on this scale.
I’m not aware of this particular speculation having been proposed anywhere else or by anyone else, though it seems a rather obvious place to look for explanations of a connection between solar cycles and terrestrial heating. I should point out that if this terrestrial dynamo exists, we may be in for some significant geological effects. Moving a conductor (the oceans or Earth’s core, in this case) in a magnetic field creates forces. As the solar flux dissipates, any stresses built up in the Earth’s crust since the last solar-magnetic reversal would now have the lid taken off, so to speak.
Chris Schoneveld (02:01:27) :
Leif’s SC 24 prediction is based on the solar polar field, he just draws the
line between that (and most other things solar) and temperatures on Earth.
Anthony’s reply to DAV (17:46:36) :Ask Tamino about Ian Joliffe, and why no other scientists and contributors guest publish on “Open Mind”, like they do on WUWT.
I remember that. Joliffe demanded an apology from Tamino — and got it — but then Tamino effectively said Joliffe was full of it ; leaving it all in the comments section without altering the main post. Posting at Tamino’s is an exercise. in futility. A perhaps more appropriate title for his blog: “Closed Mind.”
I wonder if Tamino is aware of the irony in his oft repeated refrain: “you *know* your amateurish claim is bullshit, but you’re *counting* on readers not having the expertise to catch your lie.”
Mike D., thanks for the overview of the Columbia River Flood Basalts, of special interest to me since I live in that vacinity – there’s lava all over the place, helping to create some giant canyons as well as plateau, etc. – and for the interesting lava flow-climate connection. I still don’t quite believe that the Earth’s core/sub-mantel heat energy has nothing significant to do with climate or that it can instead be considered as some kind of stable background given.
I have been mulling over the “driver” question. It has occurred to me that I have not considered an enormous source of heat. Is the earth itself not a magma filled balloon? The earth’s crust is not very thick ( relatively speaking) compared to the huge volume of molten rock and metals within. It is also a huge dynamo ( magnetic field and liquid metal core). The dynamo would also be affected by the suns magnetic field which varies as well. We clearly do not have all the pieces of this puzzle. Purely speculation on my part, but one that I find interesting. Comments? Keep the abuse to a minimum, please !! :^)
“though no much-desired update to Friis-Christensen has appeared, TallBloke rose to the occasion with a graph at WoodForTrees. Both TB and WFT are examples of citizen science at its best IMHO. I plan to add TB’s graph to my Climate Science Primer – TB as you ok with that?”
Fine by me Lucy, just make sure the detrending is clearly labelled. The purpose of the graph was to show the clear solar signal in the temperature data. It doesn’t update Christensen as such, but I’d have thought any competent statistician could do that accurately anyway, having made suitable adjustments to the temperature data to allow for the Jones/Hansen effect. Given the bucket adjustment fiasco for postwar sea surface temps and the overblown post 1975 warming figures, I’d say the solar signal is stronger in relation to the other longer term oscillations than has been estimated, maybe around .2C for an average cycle. This leaves us with the question of how the extra effect arrives in the earths climate. Clouds, geomagnetic effects, the interplanetary magnetic field. All these things need much more research money putting in to them.
Also, there is the question of how much energy from successive strong cycles ends up ‘stored’ in the oceans, contributing to longterm trends in the PDO etc.
More like Benny Hill.
No, wait, I liked Benny Hill…
Lucy Skywalker (08:24:34) :
Phil’s request for the “faulty” graph of Friis-Christensen to be replaced has flushed out the questionable antics of Schneider and the scurrilous behaviour of Damon and Laut: but has Phil taken this in, let alone checked it? And though no much-desired update to Friis-Christensen has appeared,
Yes I have checked it and unlike you I read past the ad hominem whining. F-C acknowledged that the point about the mixing of filtered data and unfiltered data was correct but that he shouldn’t be criticized for it because he said that’s what he’d done in the paper. “For the last two extrema [two solar minimum and two solar maximum values], the available data do not allow full smoothing. Therefore we filtered the second to last extrema by estimating the next extremum (because this is included in the filtering with a weight of one-eight only), the last extrema express the unfiltered epochs.” In other words they used a guess which is responsible for that sharp up-tick on the graph used by D’Aleo. My objection the the use of such graphs out of context is that the caveats made in the paper are left behind, had D’Aleo presented the original graph with its caption the mixed data would have been apparent.
In fact as I said above F-C did publish a later paper in which they point out “LFC showed that until 1985, corresponding to the last published data point in the FCL 1991 paper, the solar activity as calculated by the cycle length was indeed increasing in parallel with the temperature. But they also specifically stated that after this date the Northern Hemisphere Land surface temperature variations did no longer follow the solar activity variation expressed by the solar cycle length.” So F-C explicitly states that the agreement “showed clearly” in the 91 graph doesn’t hold past 85 (and that data point relied on a guess).
F-C also disclaimed responsibility for the miscalculation of the period lengths, the “trivial arithmetic error” because it did not come from the Lassen & Friis-Christiansen paper, but from a paper by Thejll and Lassen (yes the co-author of F-C).
So D’Aleo used a graph whose authors admit hasn’t been relevant for more than 20 years without the caveats that those authors saw fit to include in the figure caption when they produced it originally.
Damon & Laut are not the only ones to have taken issue with this data, for example: M. Lockwood and C. Frӧhlich “It should be noted that the solar cycle length L presented here does not appear as similar to the inverse of the global temperature anomaly as has been reported elsewhere ( Friis-Christensen & Lassen 1991).”
David Ball: Yes, the Earth is rather molten down there. A cooling and thereby shrinking crust might crack. Or it could shrink non-uniformly and let a bunch of shallow magma out. We have been fooled by geologic time scales before, no reason to expect we won’t again.
This is an article stating that many scientists are looking for ways to back out from the AGW hoax without damaging their careers!
The wall is falling…
Now it’s the turn for our politicians.
http://www.calgaryherald.com/Cooling+global+warming+hysteria+just+story/1128586/story.html
Tallbloke (06:46:33) :
I can’t get Leif Svalgaard to comment on Hung’s paper despite many attempts, he always dismisses anything to do with the planets effect on the sun as ‘Astrology’
Leif and I had long discussion re Hung and also Desmoulins here (starts about half way through)
http://wattsupwiththat.com/2008/12/14/even-quieter-on-the-solar-front-another-all-quiet-alert-issued/
The recumbent volcano beneath Yellowstone is the tip of a mantle plume. It not some dinky Mt. Saint Helens; it is a major hole in the mantle ala the Hawaiian Islands. It has erupted 3 times
in the past 2 million years, two of those among the largest eruptions known to have occurred on Earth. The last big one was ~600 kya and caused ash flows to the Mississippi. As much as 20 feet of airborne ash was deposited as far away as Texas. The entire continent was impacted in one way or another.
When (not if) the Yellowstone “hot spot” erupts again, it will be devastating to any civilization that exists here. And undoubtedly global climate will be affected, although whomever survives in NA will probably not notice it that much, given the enormity of the direct destruction from the eruption.
Still and all, it will not cause the seas to boil, proof being that previous eruptions did not induce the Venus Effect. That particular Creation-ending phenomenon will be caused by SUV’s, cow flatulence, and coal-fired power plants according to the exploding climate models of eminent NASA “scientists” and Algorites.
Phil thanks for replying. I am already pretty well aware of everything you said – but didn’t spell it out. What I meant originally was, have you taken heed that Damon & Laut were out of order? (and there are a few others). I found out about the limits of Friis-Christensen’s graph, and what he said in acknowledging this, when I discovered a Wikipedia article that mentioned D&L but signally omitted the reply that one would expect, and had other issues that all made me smell a rat – so I did some in-depth research. It’s because I am aware of the limits of the F-C graph that I want to make use of TallBloke’s graph which is uptodate and shows the ongoing correlation that essentially upholds the validity of Friis-Christensen’s original observation of correlation.
Thanks TallBloke. I’m not a statistician but trust I can recognize enough of the difference between good/relevant data and bad/irrelevant data.
Jeff L (12:40:29) :
Your observations are correct.
The lab experiment continues with a lazy sun as you point out.
In addition, CO2 will continue to climb as the Chinese and Indians will NOT do anything to slow their production of cheap energy, via coal burning plants. My understanding is the Chinese are bringing a coal plant every week. Both countries understand economic growth is dependent upon cheap and reliable energy. Both countries are poor and they are really not too concerned about liberals in this country think about their programs.
So the great experiment will continue with not only a lazy sun but growth in CO2, putting the AGW hypothesis in a double test.
All of this will take a few years to work out, so sit back and relax.
The only question is, how much financial muscle will be put behind the AGW theories? My personal opinion, and it is only that, is Obama is too pragmatic an individual to sacrifice an economic recovery on the altar of AGW. To be sure, there will be a lot of lip service to AGW mantras, but when push comes to shove, there will be no carbon tax schemes.
Just imagine how the American public would react to any moves resulting in an increase of 50% on utility bills or a dollar per gallon gas tax. If Obama is silly enough to attempt such a thing, there will be a violent political reaction to such a miscue.
Al Gore is pushing this agenda as we type. His is a pure economic motivation. A carbon tax or cap and trade scheme will benefit his investments. Simple enough to understand. Hansen is out there for ego and pride. Perhaps there are some economic incentives as well.
Both will be disappointed.
Just imagine a carbon tax proposal as the snow flies, temperatures drop, and poor people can’t pay their utility bills.
Don’t even want to contemplate such a scenario.
Anybody catch the new ‘energy czar’s’ commission she’s on?
Carol Browner is on the Socialist International’s ‘Commission For A Sustainable World Society.’
http://www.socialistinternational.org/viewArticle.cfm?ArticleID=1845&&ModuleID=34
Here’s what this group stands for:
(1) To design and put forward proposals for democratic forms of global goverance as the foundation for building a peaceful and sustainable world society overall;
(2) To map out the ways in which social imbalances and economic inequality can be redressed through new forms of governance;
A principal task of new global governance must be to ensure that the benefits of global economic growth and the opportunities for economic development are distributed fairly
Too many people in different regions of the world are being left behind, exacerbating social divisions, cultural differences and inequality within and among nations.
http://melbourne.indymedia.org/news/2006/12/133110.php
If I’m reading the above right, this commission she’s on wants a world government and one of the things this government is going to do is address world economic disparity.
Ric Werme (09:33:41) :
My knowledge of sunspots is limited but I have never come across posts that make the distinction between equatorial and polar solar activity. Admittedly, I am not a very regular visitor and may have missed it. Generally, when solar activities are discussed one always refers the visible manifestations, namely the “sunspots”, which I always thought were the equatorial features (up to 35 degrees latitude). They show this typical butterfly pattern between 35N and 35S latitudes.
Michael S and jorgekafkazar.
I too have been thinking of “offbeat” mechanisms to explain the apparent correlation between sunspots and temperature over the last couple centuries. I wonder about gravitational forcing. I.e. energy from gravitational distortions of the earth resolving as heat or somehow increasing heat flow from the core — distortions caused by the same mechanism that causes sunspots — i.e. its not the sunspots themselves, rather the common cause — perhaps the change in the sun’s orbit around the solar system center of mass.
As you suggest, why not energy from magnetic field interactions also adding perceptibly to the planet’s stored heat?
However, I have not tried to calculate the magnitudes of energy involved; so, I do not know if the above mechanisms are plausible — i.e. could possibly explain a few tenths of a degree of global temperature change.
Perhaps its the additive effect of multiple mechanisms having a common cause.
Fred from Canuckistan . . . (14:37:29) :
Al Gore Minimum.
‘Ron de Haan (14:11:49) :
This is an article stating that many scientists are looking for ways to back out from the AGW hoax without damaging their careers! ‘
Oh, no problem there. Let me demonstrate how to do this:
All you have to do is say that we believe that in times of Great Solar Activity, CO2 has been implicated as having a distinct possibility of adding insult to injury factor when it comes to overheating our beloved Planet Earth.
But in times of Miniscule Solar Activity, it’s the pollution and toxins factor from buring fossil fuels that becomes the major source of irritation.
In either case, we are concerned with making our finite supply of fossil fuels last as long as we can make them, and at the same time, take care of our home.
That do it?
Need more?
What to name the Grand Minima if it occurs?
Badalyan had a 50 for SC 24 in 2000.
Svalgard has a 70 for SC24 in 2005.
And Cliverd has a 42 for SC24 in 2006.
Depends on where we land.
Lucy Skywalker (14:51:10) :
Phil thanks for replying. I am already pretty well aware of everything you said – but didn’t spell it out. What I meant originally was, have you taken heed that Damon & Laut were out of order? (and there are a few others). I found out about the limits of Friis-Christensen’s graph, and what he said in acknowledging this, when I discovered a Wikipedia article that mentioned D&L but signally omitted the reply that one would expect, and had other issues that all made me smell a rat – so I did some in-depth research. It’s because I am aware of the limits of the F-C graph that I want to make use of TallBloke’s graph which is uptodate and shows the ongoing correlation that essentially upholds the validity of Friis-Christensen’s original observation of correlation.
So you knew that F-C’s graph that D’Aleo used was dodgy so why don’t you support my position that it’s inappropriate to use it? Just because F-C and Laut don’t like each other is no reason to ignore the flaws in the use of that graph.
You do realize that Tallbloke’s graph is not an update of the one under discussion, it plots a different variable? In fact it disproves F-C’s original thesis since it is detrended.
Mike D.:
When (not if) the Yellowstone “hot spot” erupts again, it will be devastating to any civilization that exists here. And undoubtedly global climate will be affected, although whomever survives in NA will probably not notice it that much, given the enormity of the direct destruction from the eruption.
Hilarious! That, and the rest of your post certainly shows the intellectual value of applied sarcasm. Thanks, again.
Eddy Minimum.
==========
“Leif and I had long discussion re Hung and also Desmoulins here (starts about half way through)”
http://wattsupwiththat.com/2008/12/14/even-quieter-on-the-solar-front-another-all-quiet-alert-issued/
Thanks Geoff, waded through that. It’s obvious from Leif’s comments that he still hasn’t read the Hung paper properly, and is getting the mercury link to solar flares mixed up with the syzygy’s of V,E,J and their correlation with sunspot cycle intensity, after rejecting the V,E,J,M correlation.
Oh well, his loss.
Anyway, I’ve read your stuff on the Landscheidt repository site, great progress, and all the best for 2009. I’m looking more to lgl’s suggestions about resonance, and wave modulation in spin tanks to get a handle on how the planetary motions produce cancelling and amplifying patterns in solar activity.
Leif wants nice clean numbers, he obviously never had to do studies in fluid dynamics involving perturbatory flows. Still, scientists tend to leave that sort of nitty gritty to engineers…