This is a “sticky” post that remains at top so that you can watch the progess of Ike. Click images for full size or the link below them for an animated loop.
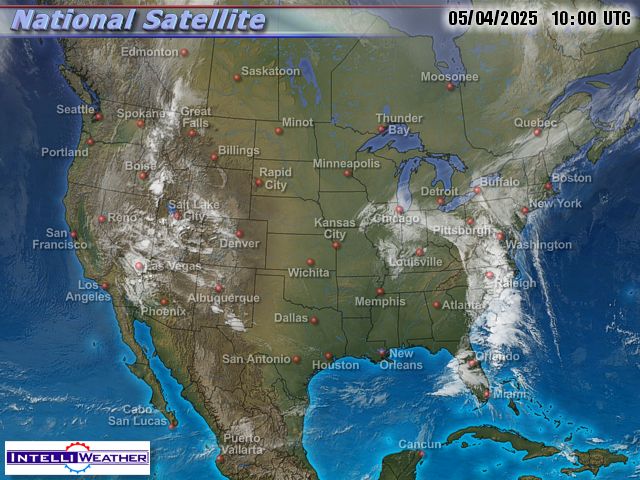
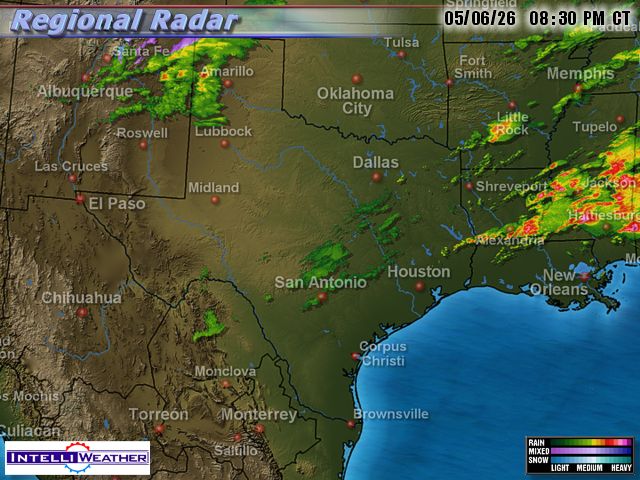
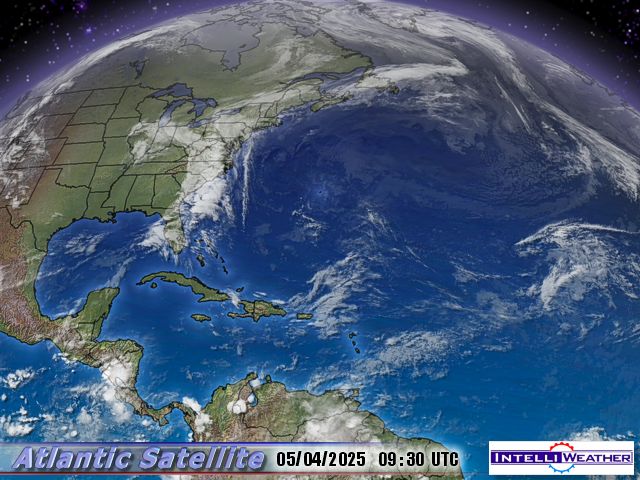

Click for loop Click for radar loop Click for loop Click for full size
UPDATE:
Latest Buoy Observations near Hurricane Ike
Zoomable map of Ike Radar loop of Ike
Galveston Hurricane of 1900
http://www.cnn.com/SPECIALS/2000/galveston/
http://www.nhc.noaa.gov/HAW2/english/history.shtml#galveston
Cool sticky post. Here is a site that shows the “spaghetti” computer projections.
http://my.sfwmd.gov/portal/page?_pageid=3194,21328260,3194_21169354:3194_21260388:3194_21260861&_dad=portal&_schema=PORTAL
I was thinking how much these would diverge in 100 years. Of course the GCMs are much more accurate.
Yeah, it makes one wonder. The NHC always cautions people not to pay too much heed to the 3-5 day projections. There are so many variables it is difficult to forecast accurately where a storm will go and how intense it will be at that time. This then begs the question of how we are supposedly able to forecast for decades or centuries the temperature of globe, which is an even more complicated process given the factors that go into it. I think the reality is that we cannot at this time, and the ‘forecasts’ are being used for political purposes. I know that is not shocking to anyone who reads this blog reguarly.
The disclaimer at the bottom of the hurricane “spaghetti” graph…
“If ANYTHING on this graphic causes confusion, ignore the entire product.”
Maybe the IPCC should include a similsr disclaimer on their products.
I like their attitude. If you click on the “additional information” link you get additional disclaimers:
These scatter plots are intended for use by individuals with proper training and expertise.
There are multiple potential causes of misinterpretation that include, but are not limited to, the following:
– Each model utilizes different assumptions and different calculations which leads to different models performing better in different situations.
– All models have unique biases.
– Some models utilize statistics, some utilize physics formulas, some utilize a combination of both.
– Some models perform best with weaker systems, others perform best with well-developed, purely tropical systems.
– The spread of the various model solutions can give a sense of the uncertainty associated with a particular storm track. However, some of the models are interrelated as they share the same initial analyses or the same global forecast fields. Therefore, clustering of model solutions does not necessarily indicate truely independent agreement.
– Poor model analyses of initial conditions can lead to even worse model solutions.
– The National Hurricane Center has access to many other models and data not included in these products. At times, these other models and data have a significant impact on the forecast track issued by the National Hurricane Center.
– Further information on some of the models used by the National Hurricane Center can be found at the National Hurricane Center website, the National Weather Service Southern Region Headquarters website, and the Hurricane Research Division website.
It appears that every model missed the slight jog north.
When this storm gets stronger and the central dense overcast gets a lot bigger and better organized, it’ll respond very easily to the upper level environment. I think high pressure will be NE of it by this time(48hrs or so) with a trough moving in from the NW. It’ll feel that trough and start moving a little more NW. I’m thinking Galveston area landfall as a Cat 3 or weak 4. But , because this thing is getting so big, it’ll affect huge amounts of real estate on the western Gulf with strong tropical/hurricane force winds, and also the tornadoes.
Everyone in Houston and just south needs to be careful here. Landfall will be in this area, and as the days go by, the NHC will move the forecast cone there. The only reason they aren’t doing it now is for continuity with previous forecasts and to see what the ingestion of new data into the 00z model runs look like. The trends are ominous. Also, one should expect explosive deepening tomorrow, and a cat 4 by day’s end is not out of the question. Ike’s structure and the local environment are screaming for rapid intensification beyond the next 8 hours time period.
Now you know
Does anyone archive the model runs and produce a map showing actual track along with the spaghetti?
I do like the style of presentation of both the spaghetti plots and the bent ice-cream-code that Anthony links to at the top, but have always wondered idly about winding time back to compare actual path with predictions….
Ok, I want to play to. I will guess it hits north of Houston. I say cat 2 by end of day tomorrow.
Disclaimer:
I know absolutely nothing about hurricane forecasting. If anything in this product confuses you, please ignore it.
Has anyone seen Josephine? Maybe we’ll get lucky and Ike will meet up with some wind shear.
RBerteig.
Unlike IPCC climate models, hurricane spaghetti models have a shelf life of 6 hours at most. These models are dependent on the information of the current conditions that appear to have an immediate effect on the storm. As those conditions change, the models change to reflect what the updated conditions tend to forcast. We all know that these models will change over time. As one who lives on the coast of central southwest Florida, I start watching the model forcasts early even though I know they are going to change. I have a steady checklist of things I need to do as a storm approaches. I use the models as a time & degree of danger table rather than a set in stone prediction. These models dictate what I am going to do and when I am going to do it.
It didn’t take long for the eye structure to reform after leaving Cuba. As Emeril says “BAM”! If I lived on the TX coast, I’d be packing and finding another place to go for a while.
I predict a hypercane!
Many know this as a special class of hurricane that feeds off the sucrose that is absorbed after passing over sugar cane fields.
Hypercanes have a gestation period of several days when the sucrose is digested by a bacteria whose dormant cycle is awoken by the low pressure in the eye-wall of a hurricane. The bacteria become “hyper” when exposed to sucrose. Current research has proven that Anthropogenic CO2 is a catalyst for the sucrose digestion.
After several days of gestation, the bacteria near the surface of the water are attracted to those on the opposite side of the wall and this attraction causes the eye wall to close at the surface. The hurricane now has formed the classic hyper cane configuration, in which the lower portion of the cane forms a large bowl shape which detaches from the surface. The hyper cane becomes especially unpredictable as it tends to bounce and the path cannot be predicted using traditional tracking models.
What is most frightening is that with a doubling of CO2, the hypercanes will have enough bounce to overcome gravity and be ejected from the atmoshpere.
The Weather Channel is showing the predicted landfall between the borders of Texas. Well I have my evacuation plan, but I hope they are wrong.
Pete,
LOL LOL LOL
Ha, that hypercane is probably a Category 10 CO2. Could it be the human race’s entree to the Galaxial Council?
Bill Nye the science guy, on The Weather Channel has changed CO2, to CO2 pollution whenever he speaks of it.
@Mike Bryant
Thankfully, he no longer has a children’s science TV show, otherwise I would have to proclaim this yet another example of childhood indoctrination!
Tucker (15:57:03) :
We’ll see. The water vapor image shows some dry air where the storm is heading tomorrow, so that may slow down development for a while. Other than that, it’s a good looking storm.
Dee Norris wrote:
He’s got a show on Planet Puke, er, Green, which seems to be geared toward idiots.
As I recall watching the Ike models over time (even before this thread), the XTRP (black triangle) model has been doing quite well at predictive tracking…
Mr Watts,
Until you present a fourth image of Loop Current with the surrounding temperatures the three ones visible on your site are kinda worthless.
Regards
‘Bill Nye the science guy, on The Weather Channel has changed CO2, to CO2 pollution whenever he speaks of it.’
Just one of the reasons why I no longer use TWC as a source.
McCall,
XTRP is simply an extrapolation of current motion. It is not a model. Many people mention it sarcastically, so if you were doing so, then nevermind. Also, CLP model is really just an historical model. I really have no idea why they even show it.
Ric Werme,
True enough. It only takes one negative variable to upset the apple cart of intensification. The inner core is so tight that I’m not sure the dry air will have a great impact, but you could certainly be correct. At this time, it appears to be on the threshold of taking off strength-wise. I agree that shear becomes a bigger player over time. Even if Ike were to reach a cat 5 (which I am not predicting btw), I don’t believe it hits TX higher than cat 3. That’s strong enough though.