More hot days — or “purpose-designed” temperature sensors at play?
I don’t believe in conspiracies of silence except when it comes to Harvey Weinstein and the Australian Bureau of Meteorology.
For some time, weather enthusiasts have been noticing rapid temperature fluctuations at the ‘latest observations’ page at the Bureau’s website. For example, Peter Cornish, a retired hydrologist, wrote to the Bureau on 17 December 2012 asking whether the 1.5 degrees Celsius drop in temperature in the space of one minute at Sydney’s Observatory Hill, just the day before, could be a quirk of the new electronic temperature sensors. Ken Stewart, a retired school principal, requested temperature data for Hervey Bay after noticing a 2.1 degrees Celsius temperature change in the space of one minute on 22 February 2017.
In both cases, the Bureau assured these ‘amateurs’ that they didn’t understand what they were noticing. In the case of Dr Cornish, he was referred to a Bureau report that makes reference to international studies, which explains how measurements from the fast responding electronic sensors are made comparable with measurements from the more inert mercury thermometers by averaging over at least one minute – except the Bureau does not actually average any of the measurements recorded from its custom-built sensors.
Electronic sensors, progressively installed into Bureau weather stations replacing mercury thermometers, beginning some twenty years ago, can capture rapid changes in temperature.

On a hot day, the air is warmed by turbulent streams of ground-heated air that can fluctuate by more than two degrees on a scale of seconds. So, if the Bureau simply changed from mercury thermometers to electronic sensors, it could increase the daily range of temperatures, and potentially even generate record hot days approach 50 degrees Celsius, because of the faster response time of the sensors.
Except to ensure consistency with measurements from mercury thermometers there is an international literature, and international standards, that specify how spot-readings need to be averaged – a literature and methodology being ignored by the Bureau. For example, the UK Met office takes 60 x 1-second samples each minute from its sensors and then averages these. In the US, they have decided this is too short a period, and the standard there is to average over a fixed five-minute period.
The Weather Observers Handbook 2012, for example, states that if averaging is not over a five-minute period it affects temperature extremes. An example is even provided. Dodge City, Kansas, has a long temperature record dating back to 1875. The hottest day on record stood at 43.3 degree Celsius. Then there was a heatwave in 2011, the highest reading from an electronic sensor was 43.9 degree Celsius. But when it was found this record was from readings that had only been averaged over only one minute, the new record was scratched – because when the same readings were averaged over the ASOS standard of five minutes, the maximum temperature was 43.3 degree Celsius – a tie.
In Australia, our Bureau takes not five-minute averages, nor even one-minute averages. As Ken Stewart discovered when he persisted with understanding the nature of the data he had been provided by the Bureau from Hervey Bay: the Bureau just take one-second spot-readings.

More examples from Ken Stewart here and here
Check temperatures at the ‘latest observations’ page at the Bureau’s website and you would assume the value had been averaged over perhaps 10 minutes. But it is dangerous to assume anything when it comes to our Bureau. The values listed at the ‘observations’ page actually represent the last second of the last minute. The daily maximum (which you can find at a different page) is the highest one-second reading for the previous 24-hour period: a spot one-second reading in contravention of every international standard. There is absolutely no averaging.
For about five weeks now the Bureau have been obfuscating on this point. There is ‘more than one way’ of achieving compliance with WMO guidelines they write in a ‘Fast Facts’ published online on September 11 – after I wrote a blog post detailing how their latest ‘internal review’ confirmed they were in contravention of international standards. I even suggested that the last 20-years of temperature recordings by the Bureau will be found not fit for purpose, and eventually need to be discarded. (I would have written like Harvey Weinstein, except that was a few weeks before this other scandal broke.)
The Bureau has been insisting for some time that they don’t need to average because they have sensors with a long response time, which actually represent an average value, that is the same as the time constant for a mercury thermometer. How this is achieved in practice was detailed for the first time in a letter from the new head of the Bureau Andrew Johnson, last Friday.
The letter explains that all the sensors the Bureau uses have been ‘purpose-designed’. I had been requesting manufacture’s specifications, but instead, I received this advice that it’s to Bureau specifications and, by inference, there is no documentation. To be clear, there are also no reports detailing the laboratory and field tests that explain how the custom-built devices have been designed to ‘closely mirrors’ the behaviour of mercury thermometers including the time constants – to quote from Dr Johnson’s letter of last Friday.
The few values quoted in this letter from Dr Johnson indicate that the Bureau has rolled-out a network of electronic sensor that under hot and windy conditions will potentially capture temperature spikes – as noted by Mr Stewart and Dr Cornish – which would be impossible from a mercury thermometer.
I am not blaming the sensors for being so responsive, just the Bureau for pretending one-second spot-readings from their purpose-designed sensor are comparable with instantaneous readings from mercury thermometers – while providing no proper documentation. I’ve suggested recording in a way that will facilitate averaging, but Dr Johnson has indicated that the Bureau would be ‘unable to meet this request’. I am not blaming Dr Johnson exactly, he didn’t put the system in place, but he is going to defend it.
If you believed in conspiracies, you might believe the increase in the incidence of hot days across Australia was because of the purpose-designed sensors, but really it has more to do with the system of one-second spot readings. Whichever, the Bureau can give us a hottest winter on record, even when there are record snow dumps in the Alps, and record numbers of frosts on the flats.
While it may be the expectation of the Australian community that temperatures would be measured consistent with some standard, clearly this is not the case. The only real question now, is whether the Bureau is such a big and important Australian institution that, like Harvey Weinstein, it’s transgressions are best ignored – at least for the moment, not under the current Minister’s watch, what? I had my eyes closed.
Jennifer Marohasy is a Senior Fellow at the Institute of Public Affairs and blogs at jennifermarohasy.com.
Jennifer Marohasy and Joanne Nova are two of Australia’s greatest Climate Warriors in the war against CAGW Alarmism.
Thank goodness for people with questioning minds and integrity!!!!
Kudos for the insights and the insistence.
These bureaucrats ( the term could not be more appropriate ) think they are beyond question and think they can browbeat and bullshit everyone like we are all high school kids, not trained and intelligent adults.
Stick with it. Step by step, they get wedged into a corner from which they cannot escape.
One thing that seems to be missing from this excellent investigation is the question of negative spikes being automatically removed. So not only will this produce unrealistically hot peak days but similar negative excursions are being deleted and this will lead to significant positive bias in daily Tmax-Tmin “average” temps.
If you Google Australian temperature, you find climate alarmist warming stories like this and headlines such as “get ready for 50 degree days”. ,http://www.theaustralian.com.au/news/nation/scientists-warn-sydney-melbourne-could-face-extreme-temperatures/news-story/1941d67b29dabf3ae9a5a2963a0484ac
These stories should be viewed in the context of this excellent investigation.
Too right mate.
Thanks for the reference WhiteRabbit. It looks like an interesting article. However, it’s paywalled, at least here in the U.S. The Australian wants $4 per week for digital access.
Joe The Australian wants $4 per week for digital access.
A trick for bypassing paywalls is post the link OR a substantial quote from the headline into google then usually the top link is the one you want, it bypasses the paywall and shows the article without bother (or it does so for me at least)
I have access to the article. Just 2 or 3 short paragraphs of the usual AGW rubbish. Nothing worthy.
But the more than 700 comments to the article, nearly all of them bashing the climate cult, is mindblowing. Imagine the mental despair of the Goebels warmers.
Thanks Karl, I’ll give it a try.
I’m not sure where this article gleans its observations data from, but the Weatherzone observations series for the Maryborough site (which comes from BOM) shows observations of 32.2C at 1pm and 33.1C at 1:10pm that don’t seem to be in the time series on the graph in the article. http://www.weatherzone.com.au/station.jsp?lt=site&lc=40126&dt=15%2F02%2F2017&list=ob&of=of_f&ot=ot_b#list
If you Google Australian temperature you find alarmist stories predicting 50 degree days. For example here,
https://goo.gl/2pP1tb
But no mention of this excellent investigation
Google algorithmns have been “adusting” climate google searches for at least 2 years now, probably longer.
+1000
That was supposed to go under the comment about Jennifer and Jo being two climate warriors….can you move it mods??
Jennifer
although I don’t really understand the science, your article is fascinating.
However, to draw comparisons with Weinstein devalues it.
Weinstein is currently undergoing trial by media. He has been found guilty of nothing in a court of law, yet.
Whatever happened to the simple concept of innocent until proven guilty, by a court of law, not the media.
So you’re only guilty if a court decrees it?
Weinstein is a known offender by every industry figure in HW.
He admits to most of it and has done in a cavalier manner for a decade.
Unfortunately it all went wrong recently when his fellow shareholders (particularly his brother) decided to dump on him to acquire his shares for a song while reducing their exposure.
Warren Blair
In civilised society a court is the only place where an accused’s guilt or innocence can be determined. Without it, we would still be burning ‘witches’.
And Hollywood is a paragon of virtue to be judging others and pronouncing them guilty? I don’t think so.
I only saw one statement from Weinstein in the The New York Times. His only concession to any guilt was “I appreciate the way I’ve behaved with colleagues in the past has caused a lot of pain, and I sincerely apologize for it.” There is no mention of what his behaviour was, it might have been financial, professional or any number of other actions. I fully appreciate he may have made admissions elsewhere specific to sexual activities but I haven’t seen them.
https://www.nytimes.com/interactive/2017/10/05/us/statement-from-harvey-weinstein.html
The media trial has ruined Weinstein before his guilt or innocence has been established in a court of law. If he is absolved of the accusations made against him, who will pay for his losses? The media?
It’s also notable that, to my knowledge, Weinstein hasn’t been arrested yet, unlike Larry Nassar http://www.bbc.co.uk/sport/gymnastics/41673058 where there is, presumably, convincing evidence, other than obscene images of children, which presents him as a threat to society.
It seems there is not yet enough evidence against Weinstein to even detain him. Evidently the law takes his case far more seriously than our sensationalist media.
..So you’re only guilty if a court decrees it?….
Yes. Next question?
Dodgy Geezer
No. You are guilty if you did it.
Now, if the government happens to catch you, that government decides to try your case, that jury (or the judge by himself) happens to find you guilty of that charge, the SYSTEM has found out what was true from the beginning: That you are guilty of the crime.
If the “System” decides that you cannot be guilty of anything (Clinton, Clinton, Obama, Rice, Holder, Koskian, Comey, Kennedy, etc, etc, etc, etc.) than you are still guilty. You just have not been held accountable by the government that is protecting you.
Yes.
<Whether someone is guilty or not, is simply a question of fact. Has the accused committed or not committed the offence? No proclamation or verdict is required by anyone.
A Court of Law does not determine whether the crime has truly been committed by the accused. That is why someone who is actually and factually guilty, may walk free (ie., be found not guilty), and why someone who is innocent of the charge may be found guilty.
A Court merely deliberates on what the evidence suggest. In civil matters on whether on the balance of probability the defendant has committed the complaint made against him (or her, or it), and in criminal cases, whether beyond all reasonable doubt, the accused has committed the offence with which the accused is charged.
That said, in a civilised society, it is better to refrain from trial by media, and the presumption of innocence should stand until a Court determines guilt.
I agree that it would be better that this article did not conflate scientific issues, and the silence of scientists, with the Harvey Weinstein matter.
A court of law determines legal guilt.
Individuals are still free to form their own opinions based on the information in front of them.
As far as I’m concerned, O.J. killed Nichole, even if a court found otherwise.
“In civilised society a court is the only place where an accused’s guilt or innocence can be determined. Without it, we would still be burning ‘witches’.”
Not a good example, it seems to me, since many of those accused might very well have been psychopaths/sociopaths and the like, who really were committing heinous crimes, and whom would have been convicted in a “civilized court” . . So the example essentially contradicts the principle espoused . .
Warren,
For the purposes of allowing the state to punish him, yes, he is presumed innocent until proven guilty in a court of law. However, private individuals are free to judge and convict him in their own minds. They are also free to “punish” him socially by not associating with him, or even commercially by refusing to buy his products. Just because the state can’t prove your guilt does not mean you are free from the consequences of your [perceived] actions. You may not like it, but this is the way human societies work.
Sigh. How many of you think John Wilkes Booth is innocent of killing Lincoln? He never had his day in court. Proving someone is guilty in a court of law is prone to many arbitrary decisions, does not always determine guilt, and never determines innocence.
Did no one ever hear of the Salem witch TRIALS (although they were hanged, not burned). They were found guilty in the ‘legal’ courts of the day. A legal court trial is prone to error the same as the court of public opinion.
If you think Weinstein cannot get a fair trial because of the publicity, what do you advocate? No trial? What about terrorists? Other famous people? Or do you advocate silencing publicity, trashing the concept of free speech and freedom of the press? And don’t forget, in earlier times, often the accused was well known as a local figure or neighbor to the judge and all the jurors, no publicity required.
Thinking that reasonable men cannot form an unbiased opinion based on the evidence presented in court because of outside publicity is wrong. Believing that the court of public opinion has no place in society is equally wrong, and offensive.
Jtom
If someone does not have their day in court, with the opportunity to defend themselves, one can never be certain a guilty conviction is sound.
The law and the rule of evidence has come a long way since the Salem Witch Trials, not to mention science and the belief in the occult.
“A legal court trial is prone to error the same as the court of public opinion.”
A patently untrue assertion. A legal trial is based on all the evidence available. The court of public opinion is founded on rumour, conjecture and media bias, in much the same way as the alarmists manipulate the climate debate.
I think everyone on WUWT prides themselves on having an objective view of the climate debate based on scientific fact. What you have said undermines your credibility in that respect.
Weinstein will get a fair trial, I’m certain of that. However, if those accusing others of rape are entitled to their anonymity, likewise, Weinstein should have the same privilege. I’m not sure how it works in the US but in the UK, the alleged victim is allowed anonymity, but not the alleged assailant.
The crossover between court proceedings and media influence is taken seriously enough in the UK that people who talk to the media, or even make Face Book comments on trials, have themselves been jailed. Entire juries have been dismissed because of casual tittle tattle, and numerous juries are accommodated in hotels for the duration of the trial to exclude undue influence.
Your court of public opinion has no place in determining the guilt or innocence of anyone. It is simply trial by a mob.
Despite Weinstein’s decades of abuse, attacks and rape, Park City, UT might be the only jurisdiction in the world in which he could stand trial for rape.
http://www.hollywoodreporter.com/thr-esq/harvey-weinstein-could-still-be-prosecuted-rape-utah-1049524
It will then come down to how willing the jury is to believe Rose McGowan, whom he bought off, about what happened 20 years ago.
HotScot, patently untrue. In a court trial the only evidence allowed is the evidence the judge allows. Much evidence is never presented.
In a court trial, the side with the better lawyer usually wins, evidence be d@mned.
Anthony, sorry, I posted this before I saw your post.
https://www.yahoo.com/news/lapd-investigating-rape-claim-against-212808156.html
Possible charges in LA.
Yes, that analogy to Weinstein is pretty poor whatever that truth of that affair is, it has little to do with data corruption by BOM. Total distraction.
W was jerking himself off, BOM are jerking off the public. Stick to scientific arguments are more power to you.
“Jerking off” is a pretty poor analogy of the subject matter in this article. You commit the same sin of which you accuse another. Besides, it is totally inappropriate. Why don’t YOU stick to scientific argument?
The analogy is that in both cases, lots of people knew, but in order to protect their careers, decided to remain silent.
I believe the conspiracy regarding Harvey Weinstein is not about his actions, but the actions of those who knew about it, joked about it even years ago, and even joked about it on prime time television.
Not that I think we should continue this here, but all Weinstein’s victims had ample opportunity to come forward to expose him when Jimmy Savile was exposed in the UK as a predatory paedophile, and since then Dave Lee Travis and Rolf Harris. They didn’t take that opportunity then, what has changed? But all of a sudden celebrities, failed and otherwise, are crawling out the woodwork for a tilt at the publicity, the very oxygen by which they support their careers.
If Weinstein has his day in court and is found guilty, I hope he burns in Hell. But until then he is an innocent man.
That is the foundation of civilised society.
PS
And of any community on the internet, WUWT subscribers, with their insistence on evidence based science and their disdain for the media ought to be the very people to defend Weinstein’s right to a fair and unbiased trial.
Hot,
Savile had little power when exposed. Weinstein still had power. So much so that Farrow couldn’t get his network to publish his piece, so had to resort to print media, where the offender had less control.
Many of Weinstein’s crimes can’t be adjudicated, because the SoL has expired. His victims didn’t go public at the time of the outrages because he had too much power. Others he bought off.
People in the entertainment industry have known about his abuse and rape for decades. Those who now say they didn’t are lying, to include Streep and Tarantino, who didn’t have the guts to speak publicly himself, but only indirectly through a friend’s Twitter feed. His own then GF, Mira Sorvino, was mashed by Weinstein. She says that the only reason he didn’t rape her was that he didn’t want to antagonize one of his leading directors, ie her BF.
Look what happened to the women who came forward about Clinton’s rapes and abuse.
Yet another comment lost in cyberspace.
WordPress makes trying to comment here pointless and a waste of time.
Htscot,
“If Weinstein has his day in court and is found guilty, I hope he burns in Hell. But until then he is an innocent man.”
Nope, he might be guilty as sin, in fact . . and you telling me otherwise is just you being presumptive . . unless of course you don’t actually mean what you said, which is what I believe is going on.
“That is the foundation of civilised society.”
No it’s not, the refraining from committing crimes is . . and speaking falsities ; )
John Knight, HotScot, and others.
STOP. This has nothing to do with temperature sensors. Do I need to put you all on moderation?
i would remove all the posts relating to weinstein . these are diversionary on probably the most important story since climategate in this arena . it is also easy to understand the issue here for laymen ,this story needs wider distribution.
Anthony,
Someone else said some things, and I responded. Why are you threatening me?
(I protest ; )
(Because you and others were waaaay off topic,no one is banned,just trying to stop it) MOD
MOD,
Thanks for the response, I appreciate it.
Ha Ha! JK, HS and others, the jerk circle in action!
Well, I consider my behavior here utterly innocent, craig . . since the conversation was well under way when i chimed in, and it originated in the article itself, which Anthony himself posted. I would suggest he not post things that are “waaaay off topic”, if he does not want people to comment on them . . and if they merely respond to those who do, I would suggest he avoid singling people out with threats for no particular reason . . (though I appreciate his apparent confidence in my ability to anticipate his angst/displeasure ; )
I’d try asking nicely, if it were my site, and see if that didn’t do the trick. But hey, I’m just a nobody who doesn’t fully grasp the mysterious ways of scientifical discourse, such a it is ; )
How does that work, HotScot?
Weinstein and his accomplices should be allowed to continue preying upon people he can victimize, until somebody can “prove” him guilty in a court of law?
Perhaps you should read into where Weinstein’s influence and cash can influence people…
Weinstein payoffs for procurement, silence and protection have been verified.
Weinstein
Multiple women have testified to Weinstein’s misogyny and sexual abuse. These testimony’s have been to officials and police as the women seek justice.
Until recently there has been zero justice for Weinstein’s victims. Payoffs are not justice.
ATheoK
I’ll defer to Anthony’s request that we all stop dissecting Weinstein’s case.
Do CRU, UEA, FOI ring any bells?
Hillary Clinton and her Russian nuclear deal. Has not been found guilty, solely because of the active cover-up by Holder, Mueller and co.
Yes, after all, what did Weinstein do that Hugh Hefner, who was universally praised when he died, did not do? On the other hand, Weinstein did not publish a magazine featuring naked women; he only produced movies that did.
The issue is not “guilt” or “innocence,” but instead valid information comparable across decades and changes in methods. The “science” is quite simple to understand if you have a kitchen, a candy thermometer and an instant-read thermometer. Heat a pan of water or oil (oil will get hotter) and then dip each thermometer in for five measured seconds and read them. The thermometers will read differently because they operate differently. To collect comparable data you need to “adjust” readings in some fashion so the rapidly reacting measurements can be validly compared to data collected from slower reacting systems. The simplest way is to average data from faster systems across sometime span that resembles the response time of the slower system. The issue doesn’t involve any “law” but those of physics and those are not adjudicated in a court.
This raises a follow up question. What happens to the GAST record when the Australian data is removed?
Even with all that fudging and cheating they were still unable to create the needed correlation between warming and emissions.
https://ssrn.com/abstract=2968352
Rather than discarding the flawed data as Jennifer suggests, presumably there must be some way to average the existing data to make it more in line with WMO standards?
In many cases, the original data wasn’t saved. Just the bits that were useful to those collecting the data.
Bloke down the pub
But what “is” the data recorded? Is an instantaneous 2 seconds of hot air (maybe !) an actual temperature, much less the the actual hottest temperature of the day? The real data has been discarded into a digital never-never-find-it-land.
‘ the increase in the incidence of hot days across Australia was because of the purpose-designed sensors,’
Given the ‘benefits’ this could bring to those seeking to support a view point , you can see why this would not be seen as problem at all. Lets us be honset good science comes a long way down any list in this area , poltical ‘value ‘ has always been far more important.
Do they still have the original second-by-second data, so they can go back and make 5-minute averages? Or did they simply dump the original data?
No, they do not keep one second data. They do keep 1 minute data, which is the value at the last second of every minute, and they do keep the highest 1 second value and the lowest 1 second value, hopefully for every minute but that is definitely not freely available to anyone. Jennifer has requested it for a couple of stations. I’ve purchased 1 minute (final second) data for a number of stations, and it’s very interesting, but there are 59 seconds missing from every minute.
Ken Stewart
Makes me suspicious that the setup is actually collecting the three highest values!
I have said on record many times I would have stood in front of a bus to support the integrity of Australia’s CSIRO and BoM. I just thought the world of these institutions just like I and Americans probably feel/felt about NASA etc. That is until about 10 years ago.
Now I feel cheated big time and am so thankful for people like Dr Jennifer, who did cop a career wack a couple of years ago, for having the courage to keep these people honest.
I suspect you can extrapolate this to lots of organisations worldwide.
The answer is to prosecute but that will probably not happen.
I just hope young scientists can get back to real scientific method.
‘Built to specifications’ means that Specs were produced by the BOM, and delivered to the manufacturers. These specs should be a matter of public record.
We’ve asked for them too, without any luck.
KS
If you consider that NASA (and NOAA) are both run by the Department of Commerce, your estimate integrity can drop – a lot.
BOM baseline stations haven’t been fiddled (yet) and their decade long data shows no warming.
Normal common sense scientific procedure would have been to run the old and new sensors alongside each other for a couple of years to provide continuity.
.”I had been requesting manufacture’s specifications, but instead, I received this advice that it’s to Bureau specifications and, by inference, there is no documentation”.
Unbelievable, A major organization replaces mercury thermometers with electric AWS units and are unable to supply specifications. What sort of project proceeds without proper documentation? Surely there was a manager for this project who was given the scope of the project and a budget or is this another “pink batts episode?
Have or offer are two different words with two different meanings , the inability to show does not mean you do not have it could mean you do not want others to see.
every single detail of every single piece of equipment that public servants buy with public money should be available outside security sensitive issues . that reply is a wholesale cop out ,basically a middle finger to public oversight of these self absorbed nonentities .
Exactly. They are just laughing in our (taxpayer) faces.
The known idiosyncratic behaviour of these sensors and the simple methodology to mitigate the effect and to generate robust raw data (be that 1 or 5 minute averaging) and the fact that this method appears standard practice in at least two, English speaking, developed countries ( the USA and UK no less) just leaves this engineer utterly gobsmacked how BOM could possibly let ‘spot’ data through into their reporting regime, let alone into regional or global temperature values. One wonder what on earth someone was thinking or planning.
Anthony,
Thanks for reposting this. Clearly the Australian Bureau of Meteorology has been recording surface temperature data from electronic sensors (PRT) in a way that is not consistent with callibration. Of course, Australia is a rather large landmass. Surely, GISS (NASA) and your NCDC would be concerned that all this data is being provided from Australia yet is not fit for purpose. It has certainly not been collected according to World Meteorological Organisation guidelines.
What can we do about this?
Ralfellis,
Australia’s Bureau of Meteorology have set their data loggers to only record the highest one-second reading, the lowest one-second reading, and the very last one-second reading in each one minute interval. So, it will never be possible to work out the one-minute or 5-minute averages from the last 20 years of historical data as recorded in automatic weather stations.
When I first realized this, I felt so ill. How could the Bureau be so stupid.
The maximum temperature for the day is thus a one-second spot reading. Why they bother to take the last one-second reading in each minute interval is curious – but it is what they do. I’ve seen the data they are recording. (Sometimes I’m embarrassed to be Australian.)
Sparky,
Despite rolling-out automatic weather stations with these electronic sensors across Australia beginning about 20 years ago (and just taking one-second spot readings), no comparative parallel data has ever been provided. Furthermore, there are no reports, published papers. Nothing. It is scandalous: but true.
At many locations they just removed the mercury thermometer and replaced it with an electronic sensor (PRT). At some locations there is theoretically parallel data – that is for a period there was both a sensor and mercury thermometer in the same Stevenson screen. But so far the Bureau has refuse to provide this data. For example, I requested 15 years of such data for Wilsons Promontory lighthouse in August 2015. But they have just stonewalled. More recently (26th September 2017) I requested 11 years of such data for Mildura, and the Minister Josh Frydenberg has promised it will be provided to me. But so far the head of the Bureau, Andrew Johnson, just wants to meet with me to have a Cuppa. I would prefer to make my own pot of tea, and be provided with the data instead.
Well done Jennifer; you have been brave despite some fierce hostility.
I’m sure you are proud to be Australian just not so proud of how a few with influence have behaved. Perhaps it can be addressed at the political level.
Keep up the good work.
“Well done Jennifer; you have been brave despite some fierce hostility.
I’m sure you are proud to be Australian just not so proud of how a few with influence have behaved.”
That’s right. It’s not your fault or most Australians fault, it is the fault of just a few individuals. Blame them, not yourself, or your country.
A majority of voters put the fools into office.
The people can’t escape from this mess scot free.
“The maximum temperature for the day is thus a one-second spot reading” … are you sure about that? It could be that the “latest data” is unsmoothed, but they do smoothing to get the daily maximum figure. I have looked at what happened when they switched to AWS around 20 years ago, and found nothing significant, besides the little-commented-on “climate shift”:
https://climanrecon.wordpress.com/2017/09/26/the-late-20th-century-climate-shift-in-se-australia/
They do NOT do any smoothing at all. The highest one second reading for the day becomes the maximum. They claim that their custom built sensors have a metal shield so it mimics the response time of a mercury thermometer, so the one second value is in effect a smoothing of the previous 40 to 80 seconds.
The 90s climate shift is real and disguises any system wide result of AWS introduction.
KS
I suggest: With only the highest 1 second, lowest 1 second and last 1 second readings of each minute, there are enough minutes in each hour to identify which of the readings are reasonably good and which ones are outliers, and a 5 minute average of reasonably good readings can be considered good. The highest good 5 minute period and the lowest good 5 minute period of each day would be considered the day’s highest and lowest temperatures for weather record purposes.
The Mauna Loa CO2 readings have an outlier identification procedure that is necessary, and it works. They have to identify when readings are representative of the northern hemisphere troposphere, and when they are contaminated by CO2 sourcing/sinking by nearby surface biomass and a nearby active volcano.
It is possible to reconstruct something that looks like what the real data probably was, but you are going to have to increase the error bars on your data to account for the fudging.
Jennifer, see my email to you on what may be the genesis of choosing the wrong temperature sensor. I found a BoM report from 1997 that explains a lot of it.
Hi Anthony
Much thanks for your email. And I’ve checked that report, and just sent you (by email) the only other report that I have been able to find regarding testing of sensors.
I’ve also asked you in the email (just sent) about statisticians who may be interested in helping with analysis of parallel data (assuming it is eventually provided by the Bureau), and how we might know if there has been any fiddling of the data by the Bureau before it is eventually provided to me.
You can find the current Bureau practices here:
http://www.bom.gov.au/climate/change/acorn-sat/documents/ACORN-SAT_Observation_practices_WEB.pdf
or at least, this is what they claim.
Jennifer:
After decades of working in IT or peripheral to IT, it is not uncommon.
Whether working with Finance, Engineering, Mail Processing, Marketing or whatever major department; each customer felt they had the right to pick and choose which data to keep.
e.g.
Finance collected work hours for payment purposes; and accidentally information about the work people did for their money. Yet, Finance regularly refused to keep anything that was not of direct use to Payroll processing.
Until data types connected, without authorization, directly to mail processing equipment and payroll processing equipment; then siphoned off relevant mail processing workloads
Engineering, under pressure to keep mail processing equipment costs low, put cheap low level processors in the machines. Which prevented greater levels of data capture until new processors were procured and installed; which did not occur due to costs.
Those same engineers couldn’t care less about any data they did not immediately need for running the machines.
Anal retentive types among engineers have very bad habits regarding explicitly adhering to written specifications.
Sure, the engineers knew when specifications were terrible or stupid. Not their problem. The customer sets the specifications.
Which explains why so much of the Postal Service’s mail processing equipment operates independently, and uniquely, on a mail processing floor. None of the specification addressed equipment integration, so all equipment is stand alone; even if it depends upon output from other mail processing machinery.
Yet, as others have mentioned, if BOM solicited equipment according to specifications; then those specifications are matter of record.
Or the BOM has committed contract fraud.
In America, contract specifications are a matter of public record for most contracts.
Every adjustment to that contract should be in the contract record. As that is where contractors line item every change to the original contract for costs incurred.
Best of Luck with your attempts to fix weather science in Australia, Jennifer!
Thank you for all you have researched and documented!
Putting in more capability than the customer asked for costs money. Money that the customer is not going to refund to the company.
@MarkW
That depends on the tools one is using to provide the product. It might cost more to remove a feature from a template than it does to leave it in.
The Bureau is not stupid, they know exactly what they are doing.
Congratulations to you and I really admire the work you are doing on behalf of us all.
This is insane. It makes a complete farce out of the min-max calculation.
(P.S., electronic sensors attached to a heat sink? Sheesh!)
Anthony,
Thanks for reposting this. Clearly the Australian Bureau of Meteorology has been recording surface temperature data from electronic sensors (PRT) in a way that is not consistent with callibration. Of course, Australia is a rather large landmass. Surely, GISS (NASA) and your NCDC would be concerned that all this data is being provided from Australia yet is not fit for purpose. It has certainly not been collected according to World Meteorological Organisation guidelines.
What can we do about this?
Ralfellis,
Australia’s Bureau of Meteorology have set their data loggers to only record the highest one-second reading, the lowest one-second reading, and the very last one-second reading in each one minute interval. So, it will never be possible to work out the one-minute or 5-minute averages from the last 20 years of historical data as recorded in automatic weather stations.
When I first realized this, I felt so ill. How could the Bureau be so stupid.
The maximum temperature for the day is thus a one-second spot reading. Why they bother to take the last one-second reading in each minute interval is curious – but it is what they do. I’ve seen the data they are recording. (Sometimes I’m embarrassed to be Australian.)
Sparky,
Despite rolling-out automatic weather stations with these electronic sensors across Australia beginning about 20 years ago (and just taking one-second spot readings), no comparative parallel data has ever been provided. Furthermore, there are no reports, published papers. Nothing. It is scandalous: but true.
At many locations they just removed the mercury thermometer and replaced it with an electronic sensor (PRT). At some locations there is theoretically parallel data – that is for a period there was both a sensor and mercury thermometer in the same Stevenson screen. But so far the Bureau has refuse to provide this data. For example, I requested 15 years of such data for Wilsons Promontory lighthouse in August 2015. But they have just stonewalled. More recently (26th September 2017) I requested 11 years of such data for Mildura, and the Minister Josh Frydenberg has promised it will be provided to me. But so far the head of the Bureau, Andrew Johnson, just wants to meet with me to have a Cuppa. I would prefer to make my own pot of tea, and be provided with the data instead.
WordPress.com / Gravatar.com credentials can be used.
not fit for purpose.
that of course depends on the nature of the ‘purpose ‘
Well done Jennifer for your dogged persistence and for putting up with the BOM BS for so long. You deserve a medal.
Thanks again Jennifer – you have made a real difference to the debate and I just hope this emboldens many others. I finally feel they are on the run and can’t hide behind others coat tails (eg Greg Hunt).
do not be embarrassed to be australian jennifer. it is that aussie dogged determination that got you to this point . keep up the good work , and don’t let the buggers grind you down.
The Bureau is not stupid, they know exactly what they are doing.
Congratulations to you and I really admire the work you are doing on behalf of us all.
Jennifer wrote:
“For about five weeks now the Bureau have been obfuscating on this point. There is ‘more than one way’ of achieving compliance with WMO guidelines they write in a ‘Fast Facts’… ”
“Fast Facts” indeed – and the proper response is “HEY – NOT SO FAST!”
Since the WMO (presumably) retained all the raw data, the simple solution is to re-interpret their results and their “records” based on a five-minute average. Then they should summarize the results and make them public, together with all the background data, so that it can be independently verified.
Is seems obvious that one-second sampling and reporting of temperatures will increase extremities, both hot and cold, when compared with mercury thermometers that have inherent thermal inertial.
…Is seems obvious that one-second sampling and reporting of temperatures will increase extremities, both hot and cold, …
Won’t increase cold. They have set a lower limit for cold excursions. But not an upper limit for heat…
Furthermore, the heat spikes are created when the sun heats a nearby surface to a temperature that is significantly warmer than the air. In a calm moment, this surface will heat the air above it to a warmer temperature. Then a little breeze can send this warmer air over the observation sight, briefly bumping up the readings for a few seconds. The differential heating of the sun, and the turbulence this creates in the near-surface air, is far more significant than the differential radiative cooling that takes place at night.
In a nutshell, it won’t have much affect on reported low temperatures, but it will significantly increase the high temperatures, especially on light wind, sunny days. This is one of the main reasons that observation sites are supposed to be in open fields, surrounded by uniform vegetation (or some other natural surface in places where grass doesn’t grow.) This is pretty basic meteorology, and those who set up the new system had to be aware that it would create a false warming trend. It might be tough to prove that, but they had to know.
jclarke341:
Actually, it does decrease minima fractionally: Because the PRTs are accurate to +/- 0.2degrees C (some are +/- 0.5C) random instrument noise will produce temperatures up to 0.1 or 0.2C cooler in early mornings. This noise is then duly reported as the day’s minima.
Yes, logically, one second readings will bias high because you get hot gusts (eg, AWS at an airport – gusts from a jet). What aeroplane gives out cold gusts?
Allen,
The data is collected by the Bureau, not the WMO.
The raw data consists of a lowest, highest and last second spot-reading for each one minute interval. This can’t be reworked to generate a valid one-minute or five-minute average.
How could the WMO oversee the production of a guideline back in 1997 specifically for Australia, and then not check that the same guideline was implemented?
But that is what they have done.
Well, for a 5 minute interval, you would have 5 readings that are not selected by value but by time (the last second of the minute readings), so it seems to me that the average of these would be a reasonable estimate? You could use the highest and lowest values to estimate a confidence interval.
You can create an average of any set of numbers.
Whether that average in turn represents anything is a different question.
Having thrown out 95% of your data prior to taking an average, the resultant average is going to be way less accurate than it otherwise would have been.
Mark, I’m not saying that I consider throwing out most data good practice – merely that one still could make some use of the remainder.
I am a bit bemused anyway about the use of 5 minute intervals for determining temperature “records”. A car parked next to a station with its engine idling could easily create spurious records, be they measured with mercury or otherwise. To use such “records” as a basis for judging “climate change” seems pointless.
No, you cannot simply create an average from these one second values. This is because one second values are biased high, because you always get gusts of hot wind, eg from a jet engine at an airport, but you rarely get gusts of cold wind.
Thanks Michael and Allan,
Given the extent of the variability apparent within the minute intervals I hesitate regarding the value of calculating a 5 minute average based on just 5 spot readings. So, far we have some limited data that Ken Stewart was able to ‘extract’ earlier in the year. Not wanting to seem ungrateful, I keep waiting and hoping for some parallel data, and some data that might provides more insight into the within minute variability especially at different locations at different times of the day.
As Michael points out, the last second-readings have been selected at a regular time interval: they do have value. As regards using the highest and lowest to estimate a confidence interval, it is not obvious to me that what you write is true or relevant… Really we have three time series from three independent methods of sampling (highest, lowest and last second)?
I would be interested to correspond with statisticians on this issue – in anticipation of receiving a large amount of parallel data, at least half of it in this form, hopefully soon. My gmail address is best and at my blog at the ‘contacts’ page.
Does the algorithm account for the chance that the last second is also the high or low for the preceding minute? If it doesn’t, it could potentially double count the high or low.
If the data presented is merely high, low, last, then there is now way to tell if the high or low was also the last.
Mark: not logically. If the last = high or the low, it is the high or the low.
Mark: continuing, that does not mean that there are not other seconds that also match the high or the low, its just not in the sampling/recording logic of the device to care.
If all they are doing is averaging the high and the low, why do they need the last?
Hi Jennifer,
I hate to argue with you because I have the greatest respect and admiration for your work.
But technically, I think we can average the five last-second-of-the-minute readings and get an acceptable average for a five-minute period, centered at 3:00 of those five readings.
A re-working of the temperature from each station should result in somewhat less extreme temperatures, both hot and cold.
Best personal regards, Allan
Post script:
I concluded below that much or all of the apparent warming since ~1982 is a natural recovery from the cooling impact of two major volcanoes – El Chichon and Pinatubo.
Real global warming probably did occur after the Great Pacific Climate Shift, circa 1977.
https://wattsupwiththat.com/2017/09/15/report-ocean-cycles-not-humans-may-be-behind-most-observed-climate-change/comment-page-1/#comment-2613373
My previous simpler equation using only the Nino3.4 Index Anomaly was:
UAHLTcalc Global (Anom. in degC, ~four months later) = 0.20*Nino3.4IndexAnom + 0.15
Here is the plot of my previous equation, without the “Sato” index {“Aerosol” optical depth):
https://www.facebook.com/photo.php?fbid=1106756229401938&set=a.1012901982120697.1073741826.100002027142240&type=3&theater
It shows that much or all of the apparent warming since ~1982 is a natural recovery from the cooling impact of two major volcanoes – El Chichon and Pinatubo.
I added the Sato Global Mean Optical Depth Index (h/t Bill Illis) to compensate for the cooling impact of major volcanoes, so the equation changes to:
UAHLTcalc Global (Anom. in degC) = 0.20*Nino3.4IndexAnom (four months earlier) + 0.15 – 8*SatoGlobalMeanOpticalDepthIndex
The “Sato Index” is factored by about -8 and here is the result – the Orange calculated global temperature line follows the Red actual UAH global LT temperature line reasonably well, with one brief deviation at the time of the Pinatubo eruption.
Here is the plot of my new equation, with the “Sato” index:
https://www.facebook.com/photo.php?fbid=1443923555685202&set=a.1012901982120697.1073741826.100002027142240&type=3&theater
Data:
Nino3.4IndexAnom is at: http://www.cpc.ncep.noaa.gov/data/indices/sstoi.indices
UAH Lower Tropospheric (LT) Temperatures http://www.nsstc.uah.edu/data/msu/v6.0/tlt/uahncdc_lt_6.0.txt
Sate Global Mean Aerosol Optical Depth at 550 nm https://data.giss.nasa.gov/modelforce/strataer/tau.line_2012.12.txt
Do the math, and let us know what the error bars would be.
No. One second readings will bias high.
Allan MacRae. I have been working on this with Ken and Jennifer for a long long time. Averaging the last second samples for five minutes does not solve some of the many problems. One problem is that unlike an InGlass thermometer platinum RTDs have a self heating error. So they are are deliberately run at a low current to reduce this at the trade off point between output signals perverted by electrical noise and the self heating error. Worse a significant real event can happen between each last second of minute sample or not. Longer averages reduce diurnal range so after you do this the warmists will say “look the minimums are warming”. Worse still the time constant curve that a transient change follows is perverted by the glass thermometer expanding just before the liquid expands this all changes with windspeed. So the glass and PRTD are not easily comparable without both wind speed and time constant curve correction. Oh and they used a smaller Stevenson screen recently plus changed through about five different probes with different cooling/heating time constants. Lance Pidgeon
Stan no a one second reading does not bias high or low it is just less dots in a game of join the dots. Being the last remaining one second sample after the other 59 teeth on the cog are lost means it is effectively a one minute sample rate. Do not confuse the averaging time and the sampling rate these are very different things. I suggest you and Allan could both benefit a lot from reading this. http://www.wescottdesign.com/articles/Sampling/sampling.pdf
This makes me so angry.
These are the people who say the Australian Public Service has not been politicised.
These are the people that say the Australian Public Service is a meritocracy.
Rubbish.
It started when Neville Wran AC was slotted into the Chairmanship of CSIRO in 1986 by his left-wing Labor mates. It has accelerated from that.
Sceptical Sam,
Entirely agree.
I had a lot to do with CSIRO in the 1960 – 1980 period (several divisions). They were an excellent organisation and utilized the highest ethical .standards.
Unfortunately, this modus operandi has diminished over the years and is now virtually non-existent.
What is more intriguing that no one has thought about is why isn’t the BOM readings under Standards Australia or if you are really going to assign significance to the readings the National Measurements Unit.
According to the UAH satellite record of monthly lower troposphere temperatures, the 5 most anomalously warm months in Australia since 1979 have all occurred within the past 20 years, i.e. over the period of transition from glass to electronic thermometers at the surface stations. The UAH data set also confirms that the warming trend in Australia since 1979 is consistent with that observed elsewhere globally; slightly faster in fact, according to UAH (0.18 C/dec in Oz compared to 0.13 globally).
This doesn’t counter Dr Marohasy’s criticism of the BOM data compilation method, which might be fair enough; but it does show that the warming trend recorded by surface instruments in Australia since 1979 is replicated, to some extent at least, by the satellite lower troposphere record. It’s not *just* the surface instruments or data compilation method.
UAH data available here (Australia is the column furthest to the right. Decadal trends from start date are given at the bottom of each column for each region): https://www.nsstc.uah.edu/data/msu/v6.0/tlt/uahncdc_lt_6.0.txt
UAH Australia, last 20 or so years

Sorry, That one was slightly out of date.
Last 20 years, The period of the AWS.. What does BOM data say about this period?

And before the slight step between 1996 and 1998.

A very slight calculated trend exists only because of the dip through the mid 1980’s, followed by a spike in 1991,2.
There was no actual warming from 1980 -1996 either.
Thanks for point us to UAH, DUUR 😉
And just for interests sake, here are some added indicator lines to draw your attention to something

oops, I missed one from 2001 – 2005.
Andy,
Why not post a chart showing the full UAH monthly set for Australia, complete with its +0.18 C/Dec warming trend?
The ‘rate’ of warming in Australia may have slowed during the past 20 years according to UAH, but 9 of the 10 warmest years on record (since 1979) have occurred within that period, and each successive decade has been warmer than the previous one.
2017 looks set to join the top 3 or 4 warmest years on record for Oz; it’s already been the 3rd warmest Jan-Sep period. Both January and March 2017 also set new monthly warm records, according to UAH.
So while the rate of lower troposphere warming may have slowed (RSS may show a different picture, but don’t provide specific data for Australia), the satellite data agree that record high temperatures, (since 1979 at least) continue to be set in Australia. This supports the observations from the surface temperature record referred to.
DWR,
Like all alarmists you want to use El Nino events to create a trend, then say its from CO2
El Ninos are ALL YOU HAVE .. 1979-1980, 1998, 2016
NO WARMING between those El Nino events.. GET OVER IT !!!
NO CO2 Warming
NO Anthropogenic Warming..
…… and your insistence of using El Ninos to create a trend shows that you KNOW that to be the case.
Either that or you have absolutely ZERO comprehension of climate events.
dwr, unless you missed the head post i think we know why all those hot years have occurred in the last twenty . not that i think a few years in the 38 since the satellite record began are of any significance in relation to climate trends in the first place ,but hey ho.
“DWR54 October 19, 2017 at 6:24 am
The ‘rate’ of warming in Australia may have slowed during the past 20 years”
Well, Australia is now a bit further north, as much as 120cm, now than it was 20 years ago.
“the 5 most anomalously warm months in Australia since 1979 have all occurred within the past 20 years”
And none of them are since 2010.
AndyG55
“…but 9 of the 10 warmest years on record have occurred in the last 10 years”
Said the climatologist in 1945 before the start of the fossil fuel era
Mary Brown
According to HadCRU the 10 warmest years globally prior to 1945 included 1878! That’s the equivalent of 1951 being inside the top 10 warmest years today. (It’s not, of course.)
Shift goal posts.. find someway of using the recent El Nino spike.. DOH !!!
Quite pathetic attempt
September 2017 was the 13th warmest September.
The El Nino is over, you can’t keep using it except in your dreams
———————————————
And HadCru… Seriously?? Get back to reality. !
NO, the warmest is still probably some time around the 1940’s ., certainly in the Northern Hemisphere.
But because of the manifest CORRUPTION of data, we will never know.
Because of the way in which the time series thermometer reconstructions are compiled, at no time during the course of the time series reconstructions are we ever comparing like data with like data, we simply do not know whether today is any warmer than it was around 1880!
It is quite conceivable that around 1880 was the warmest period during the course of the last 150 years, although it is more like that around 1940 was the warmest period during the last 150 years.
Of course most of these reconstructions are based on made up ‘data’. NOAA at the moment is flogging that September was the 3rd hottest on record, and yet this claim is based upon a considerable amount of made up data, and flies in the face of actual measured data. Viz:
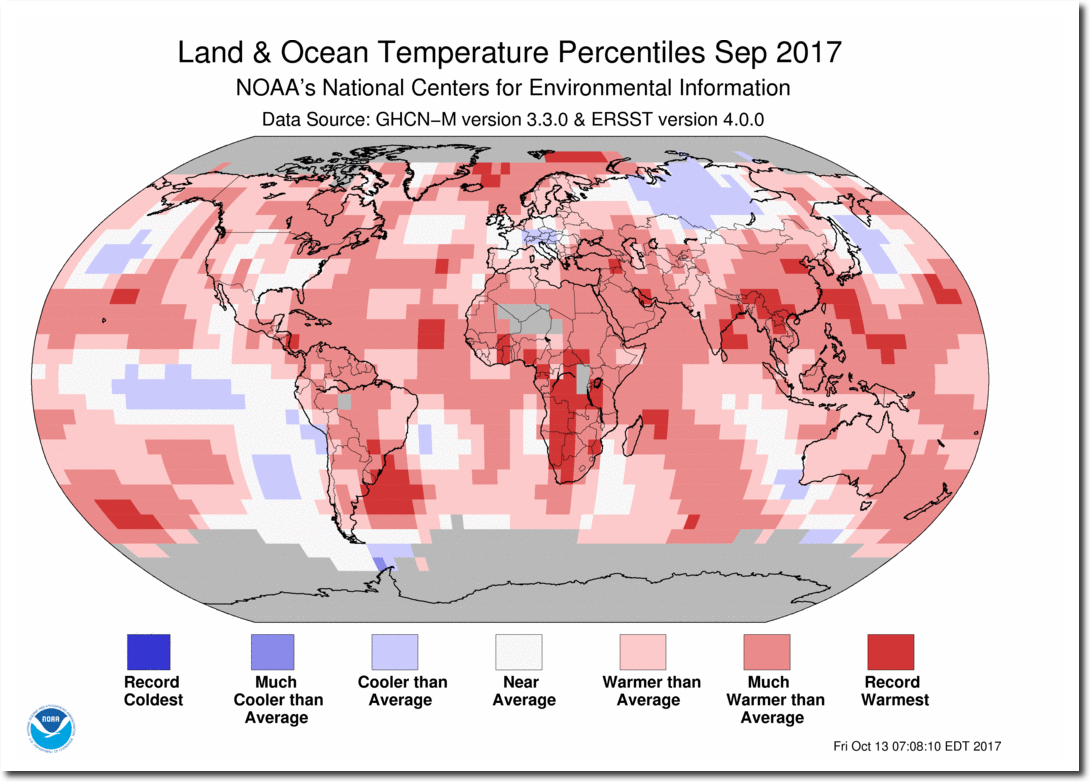
Note how hot NOAA claim Africa is, and yet this is not made on the basis of any measurement since NOAA has no data for most of Africa. Here, from their own site, they detail where they have temperature measurements. The area in grey is specifically stated to be where they have no data.
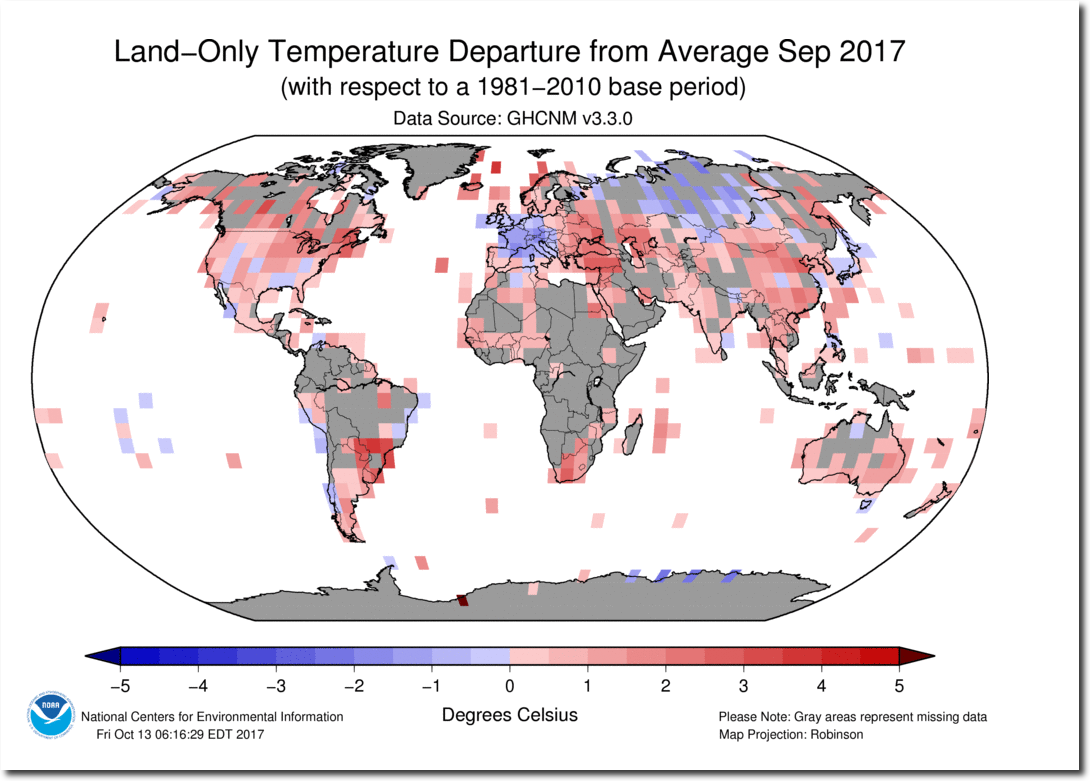
You will note from the actual measurements that the majority of the map is blue, ie., anomalous cool! This map which is based upon actual measurements is the very opposite for what NOAA claims for September.
Anyone can make up their own mind !

Darn , forgot to put a key.
Blue is UAH,
Crimson is BOM.
@richard
Gotta luv what NOAA has done with the India Asia region 😉
AndyG55 October 19, 2017 at 1:54 pm
@richard
Gotta luv what NOAA has done with the India Asia region 😉
You can see why the Indians have launched their own weather satellite
http://www.isro.gov.in/update/08-sep-2016/gslv-successfully-launches-india%E2%80%99s-weather-satellite-insat-3dr
At the moment we in Australia do not know the effect of the Indian Ocean Dipole on continental Australia, which was recently discovered.
It would seem that the Indians will have data to use in any JMarohsy future intelligent self learning neural networks to help predict our climate.
Comparing apples and oranges in order to defend watermelons.
Nice of you to concede that Jennifer’s complaints about the scandalous behavior at the BOM, might have merit.
Seems you are completely wrong. UAH shows no warming for Australia over the past 20 years. So, you proved the opposite: the thermometer switch is indeed creating false warming for Australia in that time period that does not exist as measures by the lower troposphere. Fabricated data should mean the whole bureau departments responsible are fired and replaced. That is how we handle data fabrication consequences in the science world; it is the highest sin and they are indeed doing it as UAH and this investigative reporting article demonstrate.
Here is that graph since AWS started around 2000.

I have said before elsewhere, but is there not enough money from somewhere to set up say five to ten sites which replicate these issues? Have the various instruments used to create the instrument record over the last 50-60 years (or more) and run them in parallel for a year or two and use the different methodologies used to record them, e.g. no average and averaging?
It really wouldn’t take much to see what sort of problems there might be.
Anthony, is the title of this piece correct, as it seems that the fault lies not with the sensors, but with how the data from them is handled?
A hysterical lack of hysteresis 🙂
As an engineer, who gas done a bit of instrumentation, this is unacceptable. There are well known ways to apply whatever averaging is deemed necessary to any analytical instrument to eliminate spikes of that nature. IF – and it is an if – it is deemed desirable that they are eliminated. You can do it in so many ways – as an analogue low pass filter on the sensor prior to digitisation, as part of te digital signal capture, or post processing in the data set.
One has to wonder why they have not done that
Hi Leo,
You might email me at my gmail address – so I can better understand the three methods you propose given we are looking to set-up some of our own sensors in screens. Also, I’m interesting in what techniques could be applied post recording of measurements given the scrapy data I am likely to be provided by way of parallel measurements, hopefully soon.
I am interested in the spikes, but they probably need to be eliminated if/when the purpose is to make the measurements comparable with measurement from a mercury thermometer.
Leo,
A simple impulse filter with the correct coefficients could also do the job. I’ve used exponential filters quite successfully in similar cases.
The obvious solution is to have an instantaneous reading per second and a duplicate with the recording tip set into a brass or stainless steel ball that has a thermal mass equal to a glass thermometer. Next, run them side by side to prove the averaging applied to the fast measurements match the one in the thermal mass.
The article basically claims there will be a difference between the three systems (glass, mass and fast) and there should not be.
If a public agency purchases equipment they must follow a tendering process. The tendering process must be open and accessible and should normally be viewable by anyone with bidding credentials at least, if not the public at large. During any technical tendering, there must be at least a minimum set of technical req’ts to be met along with some basic product assurance req’ts. If not then I can propose my cat as a temperature sensor and get the bid accepted.
Do a freedom of information request for the public tender notice (not the industry proposals, you won’t get those) but the agency released tender request (whatever it is called in Australia).
This will at least get the bread crumb trail up and going.
You may also consider checking current public tenders, no doubt they need replacement sensors or support equipment. Valuable information can be found there.
This is Australia. Nothing will happen. Australians are more worried about Lisa being sacked from Channel 9.
Moaner Lisa
Thanks. Will do.
I’ve got a PRT sitting on my desk in front of me. This one is designed to go to the bottom of the sea (well, 6000m), and is housed in a titanium sheath. It has an in-water response time (63%) of about 0.25s. (Note – response time constants are exponential functions, and a single time constant is ~63% change, 3t is ~95% change, which is also commonly quoted, but is it is important to state what you are quoting). Even a 95% response time on my PRT is less than a 1 second.
Granted, time constants in water are less than air, but even so, I can see within a matter of seconds the effect on this PRT output of someone opening the door to my office. I am really struggling to work out what I would have to do to this sensor, on a simple practical level, to increase its time constant to the order of a minute. And that then leads me to two questions:
1) Even if I could, why the hell would I want to? It would be adding complexity, size and expense to something to solve an issue that could be done by simple sampling and averaging.
2) Even if I had done this, what on earth were the instantaneous temperature values that even with this time constant, allowed me to detect rapid changes as shown on your Mayborough graph above?
I don’t believe them.
BOM does ….
“1) Even if I could, why the hell would I want to?” Yes best question ever. Way back in 1887 Sir Charles Todd was comparing different screen types to a sling thermometer. The rapid wind speed makes the sling very very fast. They should have done the same now. That they have not means that the mix between time constant which changes with wind speed and temperature is terminally confused. Not just in Australia but perhaps worldwide.