From the “just in time for Paris” and “impending doom canceled” department comes this report from the EUROPEAN COMMISSION JOINT RESEARCH CENTRE:
After a decade of rapid growth in global CO2 emissions, which increased at an average annual rate of 4%, much smaller increases were registered in 2012 (0.8%), 2013 (1.5%) and 2014 (0.5%). In 2014, when the emissions growth was almost at a standstill, the world’s economy continued to grow by 3%. The trend over the last three years thus sends an encouraging signal on the decoupling of CO2 emissions from global economic growth. However, it is still too early to confirm a positive global trend. For instance India, with its emerging economy and large population, increased its emissions by 7.8% and became the fourth largest emitter globally.

The EU continues to show leadership on CO2 emission reductions
In 2014, despite an overall increase of 1.4% in the GDP for the European Union, the EU decreased its CO2 emissions by 5.4% with respect to 2013. This comes after reductions also in the two previous years, although the reductions in 2012 and 2013 were at much lower rates (-0.4% and -1.4 %). The results illustrate the continued decoupling of Europe’s economic growth from CO2 emissions. Total EU CO2 emissions are now 23% below the 1990 level.
The study suggests three main reasons for this drop: 1) a 4.5% emissions reduction from industrial facilities and power plants that are part of the EU Emissions Trading System, 2) a mild winter which resulted in a 10% lower heating demand and 3) a 0.5% reduction in oil consumption for transport.
Significant reductions in national CO2 emissions were recorded for Slovakia (10.6%), the United Kingdom (9.0%), Denmark (8.8%), France (8.4%), Italy (7.7%), Finland (6.9%), Greece (6.3%), Austria (6.0%), Germany (5.6%), the Netherlands (5.3%), Portugal (3.6%) and Poland (3.4%). Of the 28 EU Member States, only Bulgaria and Cyprus increased their emissions, by 6.9% and 0.5%, respectively.
For the first time, the EU’s share of global CO2 emissions fell below 10%. Responsible for 9,6% of the global emissions, the EU is still the third largest emitter globally after China (30%) and the United States (15%).
Global emissions stalled in 2014
Apart from the EU, other countries such as Japan (-2.6%) Russia (-1.5%), and Australia (- 2.1%) also reduced their emissions. In total, only a 0.5% increase in global CO2 emissions was recorded in 2014 with respect to the previous year. The total emissions from fossil fuel combustion and industrial processes amounted to 35.7 billion tonnes CO2 in 2014, compared to 35.3 billion tonnes in 2013.
China emissions also slowed down
Although it remains the largest emitter world-wide, China has also managed to slow down its emissions growth. After the surge in CO2 emissions recorded over the past 10 years, China’s emissions increased by only 0.9% in 2014, the same rate as the United States. A big part of the overall curbing of global emissions can therefore be attributed to China’s structural changes in its economy favouring less energy-intensive services, a high value-added manufacturing industry and investments into more low-carbon energy options.
US per capita emissions among highest
The United States still has very high emissions per head of population, with 16.5 tonnes CO2per capita in 2014. This is more than twice as high as those of China (7.5 tonnes CO2 per capita) and the EU (7.1 tonnes CO2 per capita).
###
Background information
These results were published in a report by the European Commission’s Joint Research Centre (EC-JRC) and PBL Netherlands Environmental Assessment Agency.
Related links:
Trends in global CO2 emissions:2015 Report
Not actual emissions of course, but the computer generated variety.
Exactly right. Putting a number out doesn’t mean it’s correct.
As if EVERY country is telling the truth about their activities.? Does CO2 now come with a country of origin DNA tag? Nope. Just more modelling GIGO.
That’s great news! Because all GW alarmists know models are more valid than actual observations. 😉
Cam,
GW Alarmists do not look out of the window.
And, PS, the EU is not a country.
“Global emissions stalled in 2014
Apart from the EU, other countries . . . .”
It is a socialistic construct that is heavily dependent on German war-guilt to provide finances for more and more grandiose – if uneconomic – projects.
Probably what you [and most certainly what I] expect from a pressured bureaucracy intent on preserving their jobs-for-life, with negligible taxes and platinum-plated pensions, from an attack of the dreaded reality.
Auto, increasing dis-chuffed with the ascendency of ‘checkers’ over ‘do-ers’.
Even were it true, growth in atmospheric CO2 stagnated at the same time as the “pause”. Cause does not preceded effect, and atmospheric CO2 is not significantly driven by human inputs.
Global co2 growt accelerates more the last decade. Human emisions goes down, global co2 level rises even faster.
http://co2now.org/Current-CO2/CO2-Trend/acceleration-of-atmospheric-co2.html
Nonsense and cherry picked intervals. Atmospheric CO2 has very clearly decelerated over the past twenty years into an essentially linear rise.
“The trend over the last three years thus sends an encouraging signal on the decoupling of CO2 emissions from global economic growth.”
Doesn’t this go against the unspoken wish of some Luddites that want to impose their pre-modern way of life?
How do they derive a number to at least one point of accuracy for national CO2 emissions? I suppose their numbers come from stats on fossil fuel consumption, …is that correct?
CO2 production is big business. A lot of money changes hands, so carbon is tracked by an army of accountants and auditors. Not all totally dedicated to scientific accuracy, but you can do a lot of cross checking. Fuel is measured when it is mined, then when it is transported, then when it is distributed.
Nick,
Fuel is measured most certainly when it is taxed.
Auto
Just as an FYI Nick, I saw your linear “concentration vs emissions” plot the other day. In an unrelated discussion it became a relavent point, so I downloaded the co2 project’s budget data, and the “cumulative concentration / cumulative emissions” ratio quickly converged to 44%. I’m sure that you would caution against arguing for an exponential decay model for “excess” co2, but I made the point that it appeared to be that way.
Nick,
Funnily enough, a lot of money that “changes hands” does so without being duly recorded and tracked by your accountants.
You certainly can do a lot of cross-checking and you can come to any conclusion you like to account for the many discrepancies.
When I read that Nigeria loses 4 billion a year to oil theft do I think that this is determined from a poll of Nigerian oil thieves? Or number crunchers that like things to add up?
Does isiS report a million dollars a day in oil revenue, or does someone in New York infer it?
And who keeps track of plant respiration and photosynthesis?.
Nick not all carbon is tracked by an army of accountants. Fuel production outside the developed economies involves lots of untracked carbon. Partly because a lot of ad hoc production at village level is simply undocumented. The ILO issued a report in 1999 indicating that in Asia, South and central America and Africa as many as 100 million people. Now not all of those mines are for fuels but we know that in China alone more than 400 people engaged in small scale undocumented mining were killed in accidents in 1998.
A Paper published by the University of Swansea in 2004 stated
“China alone is estimated to employ 2.5 million people in what are considered the world’s most dangerous
mines – mainly village-level coal mines that the state is constantly trying to close. As noted by the ILO, as many as 6,000 people die each year in these mines.”
In Africa theft from oil pipelines is so serious that the oil companies have to patrol them by helicopter and those patrols often meet heavy resistance from armed bands. Much of the oil produced in Libya and Iraq is now under control of insurgent groups like Al Qaida and ISIL. I seriously doubt that either of those groups files regular accounts. In South America we know that the Venezuelans have been returning fraudulent accounts for years to siphon of petrodollars to shore up the state and fill the offshore accounts established by the ruling elite.
Multiply/divide a number with an accuracy factor of 2 enough times and you’ll get a result with a decimal point. Can’t argue with that can you?
Patrick, there is something fundamentally wrong with these national totals.
Indonesia burns massive amounts of peat through the illegal clearing of land to plant economically unviable palm oil plantations to produce subsidised European biodiesel. The emissions from this burning create the huge smoke cloud that blankets Singapore and Malaysia each year where the oil palm company bosses live. The CO2 emissions of Indonesia are, as a result, larger than the USA and the emissions per capita are larger than that of Americans. This is not reflected in the accounting at all. It doesn’t even get a nod!
The correct ranking of emitters is something like China, Indonesia, USA, the E.U. then India and so on. The USA might be much lower (net) when the massive regrowth of the Eastern forests is considered because it is presently absorbing somewhere between 50-80% of total industrial domestic CO2 missions. I smell not just one rat but several.
India’s Brown Cloud is neutralised each year. Indonesia’s is not. Siberia, due to slight warming and CO2 fertilisation offsets a lot of Russia’s emissions. Brazil on the other hand, burns more jungle than it grows so it is losing stored Carbon
By placing undue emphasis on ‘anthropogenic industrial emissions’, in short the easily taxed portion of total emissions, the report skews perceptions, leaving the incorrect impression that it is industrialisation that is ‘the problem’. All the while the deserts are greening and food production easily keeps pace with the growth in population.
If the world would warm as models predict, the rains across the Sahara would have restarted by now and farmers in North Africa would be flooding the international markets with additional food. The CO2 accounting report above is serving someone’s narrow purpose, I fear.
Crispin writes “The CO2 accounting report above is serving someone’s narrow purpose, I fear.”
I believe this effect is carefully and completely described in Nick Bostrom’s (Oxford, Martin School) treatise on Anthropic Bias (http://www.anthropic-principle.com/). It’s worth a read for anyone interested in how scientific method and data collection in particular are influenced by the experimenter/observer.
So , in other words, if we incinerate China and India with nukes , the greens will be happy ???
“Look, look, look! The recessions are working! Emissions are being reduced!”
:/
And the temperature has stabilised (remember the pause) as the CO2 emissions are reduced and we introduce more renewable energy sources. Its a big Win for the climate champions and it proves that they were right in the first place. All deniers should be jailed or executed or both. /sarc
Really? writes: “All deniers should be jailed or executed or both. /sarc”
In my book that observation is a “funny peculiar” rather than a “funny Ha! Ha!”. I’m reminded of the anti-tobacco campain of the 60’s and 70’s that correlated lung cancer with cigarettes. Pay no attention to above ground nuclear testing or repeated accidental releases of radioactive gasses by plutonium breeder reactors’ it’s tobacco smoke.
Couple this “denial” with strong warnings made by Surgeon Generals all over the world and legislation/taxation that successfully reduced the number of tobacco users, banning above ground nuclear testing, and a coincident reduction in the per/capita lung cancer rates over the following 40 years, and we can conclude that reducing tobacco use caused a reduction in plutonium induced lung cancers. Dulce et decorum est.
“…by plutonium breeder reactors; it’s tobacco smoke.
Bingo!
Here is the Mauna Loa data and the corresponding percent increase in human emitted CO2.
Mauna Loa CO2 and ppm increase …… % increase in human emitted CO2
2009 _ 5 _ 390.19 …. +1.65 ………………… (4.0% increase)
2010 _ 5 _ 393.04 …. +2.85 ………………… (4.0% increase)
2011 _ 5 _ 394.21 …. +1.17 ………………… (4.0% increase)
2012 _ 5 _ 396.78 …. +2.58 ………….……. 2012 (0.8%)
2013 _ 5 _ 399.76 …. +2.98 ………….……. 2013 (1.5%)
2014 _ 5 _ 401.88 …. +2.12 ………….……. 2014 (0.5%).
2015 _ 5 _ 403.94 …. +2.06
HA, iffen I didn’t know any better I would hafta claim that the % increase in human emitted CO2 for 2012, 13 & 14 were carefully calculated to “match” the Mauna Loa yearly increase in CO2 ppm.
Did they “cherrypick” those years for their Report to prove that … “reducing human emissions is working”?
From the above data over 7 years, the average CO2 increase was about 0.56%, close to that of the last 20 years. I have seen reports that about half of the emissions are absorbed by CO2. This is fairly close for the last 3 years, but way out of line with the claims of 4% in the past.
If emission rose 4% and CO2 rose only 0.55%, absorption must be 3.45% or about 14 ppm per year. This gives a half life of excess CO2 (400-280) of less than 6 years, much less than several estimates of about 40 years.
HL = ln(0.5) / ln(106/120)
@ur momisugly Richard Petschauer
Me thinks the “half-life” of atmospheric CO2 has to be re-calculated each and every year …. unless or until the Mauna Loa data confirms it to be in a “steady state” (no yearly increase or decrease).
Calculating the “half-life” of atmospheric CO2 is a “do nothing task” …. for those persons who have nothing else to do.
If through fuel statistics this report found out that human CO2 emissions stalled in 2014 than the increase on Mauna Loa is from Nature. Warmer weather -> warmer oceans -> more CO2 emissions……
Alarmists are trying to keep this quiet during Paris COP21 !!
Other data I have seen shows CO2 emissions growing about 4 ppm/year, not 4%, but only about 1%. And CO2 atmospheric content grows about half as much. This 4% past annual growth claim looks to be incorrect.
Notice that the E.U. and the U.S. have in effect “exported” their CO2 production to China.
This was achieved by the miraculous program of raising energy costs and forcing local industry out of business. Then importing all the goods and materials that we continue to need, from China where energy remains cheap.
Look at this handy list of aluminium smelters worldwide.
A casual glance will reveal that most of the list is in China.
No prizes for figuring out why!!!
https://en.wikipedia.org/wiki/List_of_aluminium_smelters
This page makes the same point more clearly.
https://en.wikipedia.org/wiki/List_of_countries_by_aluminium_production
Dan,
Yes.
But our friend Froggy shows why – by eye, about half the aluminium smelters are in China, including the biggest by throughput [and four of the ten biggest (as well as six of the twelve smallest, in fairness)].
Now the Anglesey one has close, following the local nuke station closure, we have one – in Fort William.
[Fort William is a delightful town in the West Scottish highlands; I guess their smelter gets some of its juice from hydro-power]
Auto
indefatigablefrog at 10:09 am mentions …
… “exported” their CO2 production to China.
Your quotes ought to be on “China” insofar as various factors have increased these “exports” with regard to many countries. For example, Pres. Bill Clinton removed, in Feb. 1994, the 19-year trade embargo against Vietnam. Imports from there into the USA began in March of that year and have grown substantially and steadily. See here:
http://www.census.gov/foreign-trade/balance/c5520.html
Is this not a good thing?
It must seem so to the people of Vietnam and those other countries exporting to the USA and the EU.
Yeah, I am also completely in favour international trade.
The problem with the situation regarding energy tariffs and rising costs in the E.U. is that we have created an impediment locally which does not exist globally.
Whilst we continue to import vast quantities of goods from territories that do not suffer from such an impediment to industrial production.
For example, here in the U.K. we have set our sights on the closure of ALL coal fired power stations by 2025.
Whilst we are now almost completely reliant on Chinese manufacture of goods. Manufacture powered primarily by chinese coal generation.
The upshot of this, is that we in the E.U. can pretend that we do not rely on coal, by getting others to do our manufacturing for us, cheaply, using coal.
I can see no merit in such a delusion.
indefatigablefrog commented: “…The upshot of this, is that we in the E.U. can pretend that we do not rely on coal, by getting others to do our manufacturing for us, cheaply, using coal. I can see no merit in such a delusion.”
Just as America’s “Cap and Trade” is a delusion because it only moves the emitting source to a different location…..that’s still in our atmosphere (basically what you are saying). The “delusion” is that AGW is about temperature. It’s not. It’s about changing the economic basis of the world to redistribute the living standard into a homogeneous level no matter how low that may be. And it will be lower for the majority of the people on this planet.
I see it in an even simpler light.
At the most fundamental level all such cases of over-governance are only driven by the desire on the part of some agent C, to extort money from a producer A and a consumer B.
Generally by imposing, taxes, tariffs, fines, trade controls, duties etc upon the transactions that are agreed between A and B.
Currently that means that a vast number of people would like to profit from other people’s hard labour and risk taking, whilst sitting quite comfortably in an air-con office.
But, it’s always amounted to more or less the same thing in every age.
Nobody is REALLY concerned about redistributing to the poor. Even that is just another layer of the deception.
People want to be the redistributors.
Because the cash will stick to their sticky fingers!!
Indefatigable: don’t overlook the EU exporting their biodiesel emissions to Malaysia and Indonesia. The scale is massive. The EU mandates a biodiesel component and sunrises the destruction of the tropical jungles. The habitat destruction is beyond belief. Take a bus from Singapore to Kuala Lumpur and see it. Europeans have no idea how environmentally destructive their ‘green’ policies are.
Absolutely. Biodiesel and bio-ethanol have been a catastrophe, environmentally and economically.
There doesn’t seem to be anything that reasonable people can do to stop the juggernaut of insanity rolling ever onward, leaving a trail of destruction, starvation and poverty in its wake.
Prince Charles went on a mission to preach about sustainability a few years back and took a private train (!!!) up and down the country.
For some reason he is unable to grasp that the trainload of biodiesel that he wasted is a draw-down on the total “biodiesel+diesel” supply.
The two resources are now used interchangeably and are therefore in elastic competition.
Price Charles clearly hasn’t got the memo. He is a man of very limited intellectual capacity.
Which makes him the perfect proponent of the biofuel delusion.
Note that the Fort William smelter was built there as there was plenty of potential hydropower. The Lochaber hydro electric installation was actually purpose built to supply it.
Yes, Keith, hydropower has great potential and can produce dispatchable power at competitive LCOE.
That’s probably why it is strongly resisted by the eco-nazis.
Because it is cheap and it works.
Three Gorges produces more power than all the nuclear plants in the UK together (I seem to recall hearing, although I should check that claim).
Iceland also using hydro to power profitable aluminium smelting.
Look to the bottom of this page and you will see the boringly inevitable mention of resistance from enviro-loons:
https://en.wikipedia.org/wiki/K%C3%A1rahnj%C3%BAkar_Hydropower_Plant
@ur momisugly EC-JRC: So — what?
*************************************************
AGWers and lukewarmers “feel” that CO2 might drive the climate of the earth. That’s it. No evidence.
Their “after-therefore-because-of” feelings about it are not even logical:
CO2 UP. WARMING STOPPED.
*******************
And, specifically to the “I just have a feeling” lukewarmers:
HUMAN CO2 RATE OF INCREASE NON-LINEAR.
NET ATMOSPHERIC CO2 RATE OF INCREASE LINEAR.
*******************************************
There is NO logical, evidence-based, reason to limit the freedom of the world.
Only l1es (or “feelings”).
What will they say if CO2 level begins to drop?
(youtube)
Then they will lower current temps instead of raising them to show that it works.
Gerald Machnee: Then they will lower current temps instead of raising them to show that it works.
Perhaps but their most difficult obstacle will be explaining how CO2 deceased in the first place given their obstinate insistence that the human FF addition is “extra” that upsets their imagined carbon cycle “balance”.
“AGWers and lukewarmers “feel” that CO2 might drive the climate of the earth. That’s it. No evidence.”
Amen sister, amen.
HAPPY THANKSGIVING TO YOU, Mark Stoval!
#(:))
Let’s face it lukewarmers are just skeptics who are trying to continue a “conversation” with the alarmists.
Or skeptics who are trying to save face, or save their friendships, or save their career.
And in that situation, it is certainly NOT going to be acceptable to suggest that maybe we know shit-all about climate sensitivity, or that maybe feedbacks are net negative, or that maybe all of the observed warming is natural. Or that any 20th century warming may have been damped by human particulate emissions (i.e. natural warming may have been greater without us, who knows?).
In other words there are a whole bunch of things that most people can not think out loud.
Personally I am not in favour of the existence of thought-crime.
The current sanction on free thinking and open discussion do nothing to advance the development of science. Science should ideally not be a matter of attaching oneself to fashionable opinion and then forming prejudices against other types of consideration.
I believe in keeping all hypotheses alive until they are absolutely, and without any possible doubt, ruled out.
In the current mood of climate alarmism, almost no other hypothesis is being openly considered.
Something is very wrong!!
Dear Indefatigable Frog,
I agree that freedom of speech for all points of view must be vigilantly defended.
When it comes to refuting the pseudo-science about human CO2, nevertheless,
it is about freedom versus the dictatorship of the elite,
it is about happiness versus misery,
it is about life versus death.
Only on the rock-solid ground of evidence will the battle for freedom be won. All other ground, however pardonable due to professional survival concerns, is crumbling sand.
I do not find the “let’s all just get along” mentality admirable in the least when it means, ultimately, clamping shackles of poverty on the majority of the world. Those who good-naturedly-but-foolishly keep a dialogue based on half-truths and supposition going with the AGWers only buy them time, thus, enabling their vile enviroprofiteering.
Yours, most sincerely grateful for YOU, Frog,
Janice
FEELINGS ….NOTHING MORE THAN …….FEELINGS,
dang, can’t remember the singer !!!
Marcus, lol — how COULD we remember that singer — we were just little kids… and the song sounded REALLY stupid to a little kid…. like one of my grandma’s soap operas… probably something like Chucky Smush or …. something……
Morris Albert, 1974. With B-Side for glass-half-empty-worry-warts.
Marcus writes: “FEELINGS ….NOTHING MORE THAN …….FEELINGS,”
Barbara Streisand.
Barry Manilow ?
The EU publishes a report that reports the success of EU CO2 reduction policies. Hmm …
+1
How can China’s CO2 emissions be down? Wasn’t it recently reported that China used 17% more coal than they said they did. Seems that the lies never stop.
The title of the post is a bit misleading, it is the rate of increase that is (lol, maybe…. if the models are correct for once….) slowing. You are correct, Mr. Bergin, China is going, full bore. And good for them. We in the U.S., Europe, Australia, etc… should do the same!
Nice catch!
#(:))
You noted that “China’s emissions increased by only 0.9% in 2014”, but why leave off the last part of the sentence which noted that China’s increase was at “the same rate as the United States”.
It must also be noted that China (a third world country) has over 4 times the population of the U.S. and emits less than half the CO2 per capita and still managed to hold their rate of increase to only 0.9%, equalling the U.S.
Why can’t America be more successful than China at reducing the production of CO2 emissions?
How is it that in 2014, the European Union, actually decreased its CO2 emissions by 5.4% while America can’t….Oh ya….. The EU has industrial facilities and power plants that are part of the EU Emissions Trading System and the U.S. doesn’t (because it would tank the economy) and yet, the EU still managed an overall increase of 1.4% in the GDP…….AND, they have universal health care. How DO they do it?
It looks like the EU has proven it IS possible to offer universal health care, employ an Emissions Trading System, reduce CO2 emissions AND grow the economy, all at the same time. Why doesn’t the U.S. try this? Oh ya….The Republicans say it would tank the economy, except……Oh, never mind.
Xander Bekkett
Because, without the limits and artificial price increases that benefit the big banks TRADING their carbon credits that hurt the third world’s poor (but HELP the third world dictators!), the US economy was growing at 3-5 percent per year.
It has now returned to those low rates DESPITE Obolo’s deliberate attempts to break our economy!
No.
The “Great Recession” actually occurred AFTER Pelosi’s House of Representatives and Reid’s Senate stopped oil exploration and raised energy (oil) prices) in mid 2007 to more than 135.00 per barrel. This slumped the economy mid-late 2007, and destroyed the artificial house bubble being propped up by the democrat’s deliberate lending schemes commanding loans be given to bad loan risks under “social justification” falsehoodsbetween 1998-2007. The subsidized housing markets collapsed 2007-2008, and the recession ensued when those banks lost their artificially high values re-re-re-sold mortgages. All this caused BY democrat socialist schemes propping up their NY banker donors and international bankers to get local votes from their slavish dumbed-down electers.
I hate to inform you that the man occupying the White House bears responsibility for it. It happened on his watch.
X. Bekkett:
1. Because it was irrelevant to the point I was making.
2. China’s CO2/capita is NOT, per se, by any means a sign of economic prosperity, thus, not = “success.”
3. Reducing CO2 is not “success.” This concept is empty of any significant meaning. It would be more logical to say that increasing CO2 is “success,” for it means: 1) increased productivity; and 2) more plant food.
4. In the U.S. healthcare has been available universally (and affordable) via the private market with taxpayer-funded care for the poor FOR YEARS and it has excellent quality. Where would you rather have a stroke or a heart attack or need a hip replacement? Waiting times in the grossly inefficient EU-type healthcare system are a death warrant for many. The government need not control the medical industry to improve it or to ensure that the poor have healthcare (e.g., pre-existing condition coverage can be mandated or taken care of by free market competition across state lines for health ins. policies). Rather, government’s controlling healthcare results in (proven by data): lower quality and availability of healthcare for the poor after the first 5 years or so. Basic economics (and THIS is proven by facts, one clear case you could examine is Sweden which ruined a good healthcare system in the 1970’s).
5. Those for ordered liberty in the U.S. do not say that government-run medicine “will tank” the economy, they can prove that it, along with economy-crippling tax policy and energy regulation, IS tanking the economy. Employers are explicitly not hiring to avoid paying the healthcare costs (shifted to them from the private insurance market which has nearly been destroyed) which would put them out of business, thus, stagnant job market.
If you like how the Europeans do things so much, go live there. Not practical? Well, (mirthless laugh) stick around…. the statists (usually “Democrats” and RINOS), if not stopped SOON will bring Europe to you! Including Paris… .
Janice
WOW ! . The liberals above are more delusional than ever !! Must be a new brand of Koolaid !!
You might find your life expectancy to be about the same in those places as in the USA because of genetics. Given equal health care, diet, etc. black people die younger than whites or east Asians. European countries have a much lower black population than the USA so that skews their life expectancy up compared to the USA.
http://www.businessinsider.com/huge-racial-gap-in-life-expectancy-2014-1
Increase to life expectancy is a direct result of cheap energy from fossil fuel. http://www.moralcaseforfossilfuels.com/data/
1oldnwise4me@reagan.com writes: “Doesn’t compare to the deliberate success his predecessor had in causing the Great Recession.”
Or, more importantly, the deliberate success of his predecessors in engineering the collapse of the Soviet Union?
Meanwhile the atmospheric CO2 concentration continues to climb at its’ usual pace. Seems to me that would be proof that man’s use of fossil fuels does not affect it….much less the climate. This sounds like Part 1 of explaining away the “pause” in a light that shines favorably on fossil fuel use reduction.
You post wasn’t there when I posted the next post Mark 🙂
Yes the 18 year pause occured because stopped increasing CO2 output for the last three years.
/sarc
expect the truth is that the amount of CO2 in the atmosphere is dominated by exchange with that in the ocean, Henry’s law and all that. If there is extra CO2 from another source, volcano or cement production, that is offset by a reduction in output by the oceans. Which would explain the graph in my next post.
Robert of Ottawa
November 26, 2015 at 10:32 am
Please- cement production is a temporary emission, concrete sucks the CO2 from calcining back over time.
http://www.concretethinker.org/technicalbrief/Concrete-Cement-CO2.aspx
The concrete and lime CO2 emissions and their reabsorption should be understood by scientists on this site and non-scientists as well. It is either ignorance on the CAGW proponent side that cites this emission all the time or it is a deliberate lie.
The E.U. exported their emissions to eastern and western Asia by raising the price of electricity to the point that whole sectors of manufacturing were unviable. Therefore CO2 emissions dropped.
Yes, Mr. Leskovar.
“Answer: in either case, emissions are accelerating, so atmospheric concentration should be accelerating.
But it isn’t.
The rate of change of atmospheric concentration instead leveled off to a near constant value at the onset of the “pause.”
Bartemis, here: http://wattsupwiththat.com/2015/11/24/co2-residence-time-said-to-be-40-years-not-1000-as-noaa-claims/#comment-2079152
Yet total CO2 continues to grow … hmm.
http://www.esrl.noaa.gov/gmd/webdata/ccgg/trends/co2_trend_gl.png
Emissions keep rising, only the growth is slowing, see figure 2.1 on page 11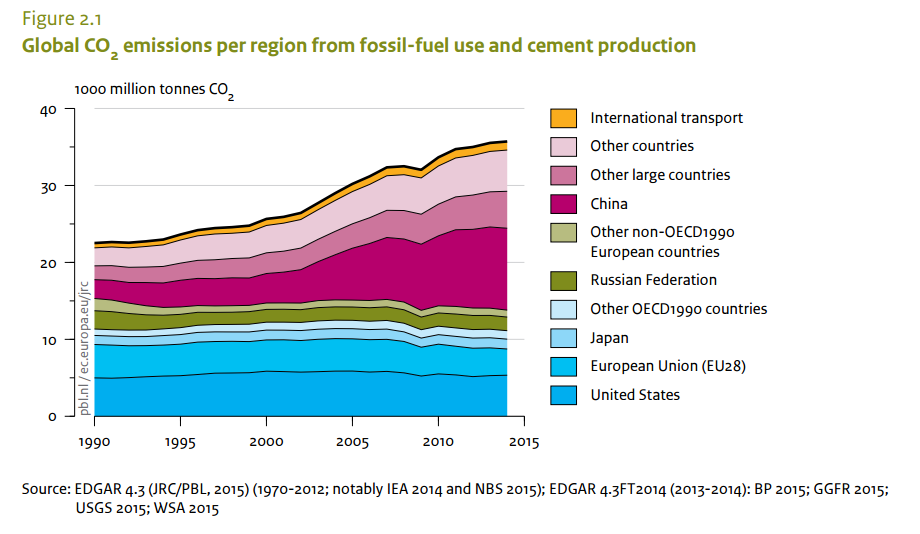
Don’t forget the “tipping point” which we’ve crossed repeatedly- making all efforts at doom dodging pointless. Just a matter of time before we can light our cigarettes just by sticking our faces out the window!
Remember to put the cigarette in your mouth first!
And don’t forget to roll the window down.
Britain lowered its emissions by two steel smelters going bankrupt and one aluminium plant closing. But since that production and those jobs all moved to India and China, who don’t give a stuff about emissions, CO2 production was actually increased overall. A great win-win for Green Deception.
And since the remaining population in Britain will now be so poor, they will not be able to heat their homes over the winter and will freeze to death. And so we will save another 9% in CO2 production in following years. Another great win-win for Green Deception.
One could almost call the CO2 delusion and our response to it the “Suicide of the West” if James Burnham had not already beaten us to it and famously used that title.
Gives one such a delightful sense of the Christmas spirit!
“If they’d rather die {than go to the poorhouse}, then they had better do it and decrease the surplus population, … “{said Ebenezer Scrooge}.
Charles Dickens, A Christmas Carol.
************
Good point, Mark S. — But, there are a lot of people who have not and WILL not drink the Kool-Aid! Truth — will — win!
ralfe
I don’t question your facts or your approach.
However, Brits should be able to survive – by trading, by services, by breeding and by importing Brits-of-the-future.
Sooner or later [and I hope the coming Parisian deep-freeze blizzard that my computer model* shows for much of the next seventeen days, might mean sooner] the watermelon tribe will be outed by MSM.
*
A simple model.
So, type in cell A1 -17.
Write in cell B1 Temperature in Paris during COP = B2
In cell B2 (=A1*1)
I’m off to Paris soon, with short-sleeved shirts!
Auto – models – don’tcha luv’em!
Agenda 21 requires the reduction of the human population !!
If CO2 growth has stagnated and CO2 is generated by economic activity then I seriously doubt CO2 has stagnated while economic growth has continued on uninterrupted. I’d be suspicious of the economic numbers. The other possibility is that an immense new CO2 sink has occurred. What could that be?
It could be that the oceans are cooling and they are releasing less CO2. Worth looking at.
Yes I should read the articles sequentially from oldest to newest. That point was implied in ‘About Spurious Correlations and Causation of the CO2 Increase” three articles ago. All of this also implies that the steady drumbeat of the Warmists that man made CO2 is the driver, i.e. that it’s all anthropogenic global warming is dicey at best. The pause or whatever else might be cooling the oceans might be the reason for the CO2 slowdown. But if the oceans aren’t cooling, then what?
I think, John, that, for the sake of clarity, we need to more precisely define what CO2 we are talking about (v. a v. this thread):
— Human CO2 emissions rate of increase may be (just a modeled guess) slowing.
— Net atmospheric CO2 is still increasing (at a slower rate).
— Human CO2 is (and has been for years) increasing at a faster rate — non-linear — than net atmospheric CO2 (from all sources and sinks, human and natural) — linear. Thus, the net atmospheric CO2 level is NOT driven by human CO2 emissions.
(Here’s what a real scientist said about it yesterday:
http://wattsupwiththat.com/2015/11/24/co2-residence-time-said-to-be-40-years-not-1000-as-noaa-claims/#comment-2079152 )
My first thought
A warming ocean releases CO2 and a cooling ocean absorbs CO2?
Shouldn’t the carbon footprint from all the shipping of goods back to the countries that originally outsourced their manufacturing plants be charged to those countries?
Who “pays” for the CO2 emissions that take place in international waters?
Ferdinand Englebeem, would you like to have a go at this? I trust you are also not misled by the greens into including cement and lime in your emissions accounting – it is reabsorbed back into ageing concrete and mortar products, lime is used in industrial processes some of which also do so.
Gary Pearse
November 26, 2015 at 11:07 am
“Robert of Ottawa
November 26, 2015 at 10:32 am “
Cement made from limestone is not the same as the original limestone after curing. It takes about 3.2 GJ to turn a ton of limestone into lime. That investment of heat is not recovered by making concrete, ever, because the final chemistry is different.
Cement production is CO2 net positive, whatever the energy source.
Also, main energy uses are in manufacturing and transportation. If you kill manufacturing and render the population poor, then you will decouple CO2 from the economy. You replace it with a service economy and ‘growth’ is increased government sector ‘contribution’ to the economy. All those social workers you have to hire to deal with the burgeoning poor. Building and selling high-priced windmill energy is part of this accounting. The windmill production uses C based energy but that is emitted in China. New age economics and statistics! Even the left must start to regret the big dumming down at some point.
Well put, Mr. Pearce.
As to your last thought (sigh), probably….. not.
As one of their more famous Dictatorship of the Elite (F. Hayek) comrades famously said:
“Things as they are will last out my time.” Louis XV
Europe simply sent much of their industry and CO2 emissions to China and other Asian nations with cheap labor forces.
And cheap energy. See comments at start of thread.
With reference to Aluminium Smelting – which is energy intensive, but not especially sensitive to labour costs.
Not only that. We put the Germans in charge of monitoring European CO2 emissions. Since they implemented a new software we have become much more efficient at reducing emissions.
Epic!
+ 1,000
I recently read that atmospheric co2 concentrations just passed the 400 ppm mark, it was supposedly beginning of the end for humanity. Though I haven’t noticed anything catastrophic yet, I continue to hope.
If our output has flatlined, why are concentrations still rising?
http://sciencespeak.com/climate-basic.html
“Short and Sweet
Many scientists believe in the carbon dioxide theory because of “basic physics”, or rather its application to climate, the basic climate model. Other scientists are skeptical, because of the considerable contrary empirical evidence.
Dating back to 1896, the basic climate model contains serious architectural errors. Keeping the physics but fixing the architecture, and using modern climate data, shows that future warming due to carbon dioxide will be a fifth to a tenth of official estimates. Less than 20% of the global warming since 1973 was due to increasing carbon dioxide.”
If our CO2 output has flat lined why are temperatures still rising? Big problem for Deep Green!
Hang on -I thought temperatures had stopped rising. Did someone mention a pause? Which is it?
seaice has no clue. That is shown by his typically vague comment that ‘temperatures have stopped rising’.
Speaking of ‘jargon-like words’, seaice provides no time frame, no context, and no rational discussion. Just another lame talking point; trying to score a ‘gotcha’ because he lacks the one thing necessary to support his belief: measurements of AGW.
Yes, global T has stopped rising, for more than eighteen years now. Prior to that the planet showed evidence of its recovery from the LIA. It will very likely do so again. But there are still no measurements quantifying AGW, and without measurements (aka: data), the only thing the alarmist clique has is a series of baseless opinions, which comprise its entire failed argument.
That isn’t nearly good enough in science. It’s only useful for the alarmist crowd’s eco-religion. That is a big distinction.
Without verifiable, testable, empirical measurements quantifying AGW, all the alarmist clique has is an unproven conjecture; an opinion, nothing more.
If the global average temperature over the past eighteen years has increased, it is inseparable from the noise and inaccuracy of the instruments. As far as we can tell, it hasn’t changed. No one can say it has with a modicum of confidence.
“The study suggests three main reasons for this drop: … 2) a mild winter which resulted in a 10% lower heating demand”
Thank you, global warming. 🙂
More realistically, “Thank you El Nino”.
In a world where countries have deliberately adjusted historical data does anyone trust any figures that are produced by governments. China’s figures have already been shown to have been understated . This is probably the tip of the iceberg. With future commitments based in part on each countries green credentials and success so far who is going to trust these figures.
+1 I don’t understand why there isn’t more outrage over the data tampering. And to anyone that claims the changes are valid I would like to know why such great efforts are being made to hide the reasoning behind the changes. You don’t hide the truth. When I ask my warmist friends about this they just smile and accuse me of conspiracy theory.
There’s a new satellite up that has sporadically given info on where global CO2 emissions are coming from. So far, consensus expectations are not well matched. And, IIRC, China is emitting more CO2 than expected.
Technically who cares? Politically very important? But really where should I invest?
Transportation (pipelines, trains, shipping of all types). With all the upheaval in location of production and market, transportation will be reliably profitable for some time to come. Now… WHICH companies, lol…. (depends on your risk-averseness, lol — I’d go with ~ 70% historically reliable, myself, and ~ 30% new-well-organized-funded).
There! That was fun! #(:))
Yes, Terry B., I realize it is highly likely your Q was only rhetorical. Thanks for the opening, even so.
Janice,
Shipping is an industry with a relatively low-entry cost.
It also has significant profits when you get the timing right. The late 1960s ‘Universe’ class of VLCCs, (Daniel Ludwig’s idea, twin engine, twin rudder, and over 320,000 deadweight), mostly paid for themselves with their first three [or two!] voyages
In my working lifetime there have been serious over-supply of – Supertankers [VLCCs]; Big Box Boats; mid-range bulkers; Super-bulkers [VLOCs]; mid-range tankers; blooming big box boats ( those a quarter of a mile long); Very Large LNG Carriers; smaller tankers [18000-30000 tonnes]; many coastal trades – in small ships – have had regional gluts, with all that a glut does to freight & charter rates.
I believe there may be oversupply in Cruise liners [at least in some domestic markets], too.
If you do a Ludwig – brilliant!
But – some investments could go up, as well as inexorably down.
Auto
Shipping freights are extremely low at the moment. Not a good time to be an owner, or a long term charterer.
I wonder how this is expressed in the Keeli g curve…..
“The United States still has very high emissions per head of population, with 16.5 tonnes CO2per capita in 2014. This is more than twice as high as those of China (7.5 tonnes CO2 per capita) and the EU (7.1 tonnes CO2 per capita).”
This is a completely bogus measurement which means nothing.
The US and China each provide about 16% of global GDP. How many people live in each country is completely irrelevant to the level of goods and services they contribute to the global marketplace.
Yes! (bh2)
Lol, I would say (as an American), that it means China needs to up its game. Heh.
(and we need to double-down and aim for 50 tonnes/capita!)
bh
An opinion.
So far as CO2 is concerned – quite correct.
Here, we’re free to express opinion, questions – even for me, sometimes, ignorance.
But –
Is CO2 a danger?
Is it relevant?
What does CO2 matter if it is, in fact, a lagging indicator?
Are there natural cycles?
Can humanity’s output trump those cycles?
Can it do so if two or more of the bigger natural ones turn ‘Cold’ for a decade or two?
I’ve got a good supply of warm clothes – as well as short-sleeved shirts.
Auto
from the press release:
“In 2014, when the emissions growth was almost at a standstill, ”
from the actual report:
“CO2 emissions from fossil-fuel combustion for 2013 and 2014 in this report are calculated by extrapolation”
So the press release tells you what emissions WERE in 2014 but the report tells you what they ESTIMATE it to be based on previous measurements from several years ago. The whole gist of the release is about the changes in rates AFTER they extrapolate.. Best accounting practice this isn’t. Who gets away with this kind of discrepancy in the real world? Is everything related to climate science following the form of prioritizing guesses over data? Who dreams of making a big fuss about how things had changed if they had guessed at how they changed!
Why is all of climate science a constant pea and shell game being played in a dark alley?!!!!!!!!!!!!!
Because it is a con game!!!!!!!!!!
🙂
J
+ serious lorry-loads!
Auto
Yup, plus a bucketload (canvas or otherwise)
I have 3 more exclamation marks than you Janice. How much more angry does that make me? Are their some proxy studies for this?
Dave in Canmore, lol, roughly 57-43 = 14% more. How do I KNOW this?? Ha! I coded it into my super-simulator-see-ya-later-sukkah MODEL!!!
It has a super-secret formula that can compute how angry a person is based on the PSI on the keyboard … and… other stuff…..
You can tell a person is REALLY REALLY SUPER-DUPER MAD when they blow the end-bold < thingy and MACH 10 MAD when them make werwlyy aweird typioes that they won;dt even see beause they are so MAD!!!!!!!!!!!!!!!!!
lololololololoooolo — and I only had diet cola today ….. 🙂