 This post provides an update on the progress of the early evolution of the 2014/15 El Niño with data through the end of May 2014. The post is similar in layout to the May update.
The post includes 5 gif animations and 16 illustrations so the post might take a few moments to load on your browser. Please click on the illustrations and animations to enlarge them.
Included are updates of the weekly sea surface temperature anomalies for the four most-often-used NINO regions. Also included are updates of the GODAS map-based animations of sea surface height anomalies, T300 anomalies (depth-averaged temperature anomalies to 300 meters), sea surface temperature anomalies, and the cross sections of temperature anomalies at depth along the equator. I’ve also included two additional animations. The animations start in January 2014 for the full progress of this year’s event. And I’ve added a couple of graphs of the BOM Southern-Oscillation Index (SOI) for this update.
We compared the evolution of the 2014/15 El Niño to the 1982/83 and 1997/98 El Niños in the third post in this series. The evolution of this El Niño is still being hyped by comparing it to the strong 1997/98 El Niño. So I’ve updated those graphs. And since we’ve been watching the downwelling (warm) Kelvin wave as it makes its way east along the equator in the Pacific, also included in this post are evolution comparisons using warm water volume anomalies and depth-averaged temperature anomalies from the NOAA TOA project website.
Then, as we did with the May update, we’ll take a look at a number of Hovmoller diagrams comparing the progress so far this year to what happened in 1997. But for this update I’ve also included Hovmoller diagrams comparing 1982 and 1997. All will serve as a background for a general discussion of what should happen next as this El Niño evolves, regardless of how strong this El Niño eventually becomes.
NINO REGION TIME-SERIES GRAPHS
Figure 1 includes the weekly sea surface temperature anomalies of the 4 most-often-used NINO regions of the equatorial Pacific. From west to east they include:
- NINO4 (5S-5N, 160E-150W)
- NINO3.4 (5S-5N, 170W-120W)
- NINO3 (5S-5N, 150W-90W)
- NINO1+2 (10S-0, 90W-80W)
As of last week, the sea surface temperature anomalies in all four equatorial NINO regions are elevated—a result of the warmer-than-normal subsurface waters (associated with the Kelvin wave) being upwelled.

Figure 1
EL NIÑO EVOLUTION COMPARISONS FOR NINO REGION SEA SURFACE TEMPERATURE ANOMALIES
Using weekly sea surface temperature anomalies for the four NINO regions, Figure 2 updates the comparisons of the evolutions of this El Niño with the 1982/83 and 1997/98 events. As you’ll recall, the NINO3.4 and NINO1+2 comparisons were originally provided in the post 2014/15 El Niño – Part 3 – Early Evolution – Comparison with 1982/83 & 1997/98 El Niño Events. NINO3.4 and NINO3 region sea surface temperature anomalies this year are falling behind the two earlier strong El Niños. And in the NINO1+2 region, the temperature anomalies have broken away sharply from the 1982/83 El Niño evolution, but they continue to be far below the values at this time for 1997/98 El Niño. The NINO1+2 data are an indicator of an East Pacific El Niño, which are stronger than Central Pacific El Niños.

Figure 2
ANIMATION UPDATES
In the first post in this series, we discussed a number of animations of maps and animations of equatorial cross sections available from the NOAA Global Ocean Data Assimilation System (GODAS)website. Each cell of the animation is a 5-day (pentadal) average. Those animations ran from January 3rd to March 29th. The following are updates, again starting in January 3rd. GODAS only maintains their animations for 3 months. I’ve stored the maps since the first of the year and will continue to add maps as time progresses. That way we can watch the El Niño unfold from the beginning and then try to keep track of the warm water when El Niño is over.
Animation 1 provides the sea surface height anomalies and the depth-averaged temperature anomalies for the top 300 meters (T300) side by side.

Animation 1
Animation 2 is a similar side-by-side comparison, but on the left are maps of sea surface temperature anomalies and on the right are the H300 maps.

Animation 2
Animation 3 is an update of the cross sections of temperature anomalies at depth along the equator.

Animation 3
I’ve included Animation 4 to put Animation 3 in perspective. The cross sections above in Animation 3 show subsurface temperature anomalies growing quite high as the Kelvin wave moves east. For those who are not familiar with what’s happening there, a look at an animation of the cross sections of the subsurface temperatures (not anomalies) will be helpful. This is provided in Animation 4, which only presents the data for equatorial Pacific. As shown, as the Kelvin wave travels from west to east along the equator, more warm water than normal is carried east by the equatorial undercurrent. This pushes down on the thermocline (the boundary at 20 deg C), causing it to reach deeper than its normal location. As a result, subsurface waters are warmer near the normal location of the thermocline, creating the elevated anomalies shown in Figure 3. Those subsurface waters are now being drawn to the surface through upwelling, causing the sea surface temperatures to rise in turn.

Animation 4
The Kelvin wave didn’t create any warm water. It simply caused more warm water than normal to travel from the west (where the subsurface waters are normally warmer) along the equator to the east (where the subsurface waters are normally cooler).
Animation 4 was created from the cells of the animations available from NOAA here. Mine is an extended version, starting in January 2014.
The Jet Propulsion Laboratory provides maps of sea level residuals on their Latest El Niño/La Niña Watch Data webpage. Animation 5 presents those maps. They provide a slightly different perspective of the impact of the Kelvin wave on the sea levels of the equatorial Pacific.

Animation 5
EL NIÑO EVOLUTION COMPARISONS WITH TAO PROJECT SUBSURFACE DATA
The NOAA Tropical Atmosphere-Ocean (TAO) Project website includes data for two temperature-related datasets for the equatorial Pacific. See their Upper Ocean Heat Content and ENSO webpage for descriptions of the datasets. The two datasets are Warm Water Volume (above the 20 deg C isotherm) and the Depth-Averaged Temperatures for the top 300 meters (aka T300). Both are available for the:
- Western Equatorial Pacific (5S-5N, 120E-155W)
- Eastern Equatorial Pacific (5S-5N, 155W-80W)
- Equatorial Pacific (5S-5N, 120E-80W)
Keep in mind that the longitudes of 120E-80W stretch 160 deg, almost halfway around the globe. For a reminder of width of the equatorial Pacific, see the protractor-based illustration here.
In the following three sets of graphs, we’re comparing data for the evolution of the 2014/15 El Niño so far (through the end of May 2014) with the data for the evolutions of the 1982/83 and 1997/98 El Niños. The Warm Water Volume data are the top graphs and the depth-averaged temperature data are the bottom graphs. As you’ll see, the curves of two datasets are similar.
Let’s start with the Western Equatorial Pacific (5S-5N, 120E-155W), Figure 3. The warm water volume and depth-averaged temperature data show the Western Equatorial Pacific had slightly less warm water or was slightly cooler this year than during the opening months of 1997. But 2014 had more warm water or was warmer than 1982.

Figure 3
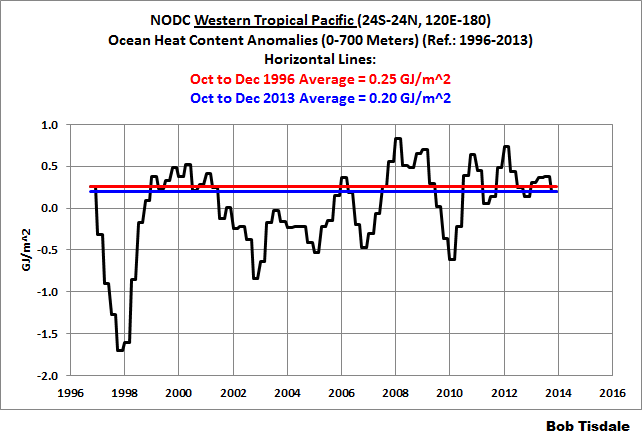
In the second post in this series, we showed that the ocean heat content for the entire eastern tropical Pacific (24S-24N, 180-80W), for the depths of 0-700 meters, was cooler before the start of the current El Niño than it was in before the start of 1997 El Niño. (See the graph here.) The warm water volume and depth-averaged temperature data shown in Figure 4 for the eastern equatorial Pacific also show lower warm water volume and lower depth-averaged temperatures in 2014 than in 1997.

Figure 4
As a result, across the entire equatorial Pacific, Figure 5, warm water volume is lower and depth-averaged temperatures are less in 2014 than they were in 1997. Then again, they’re higher than they were in 1982.

Figure 5
Keep in mind, though, that both the 1982/83 and 1997/98 events were strong El Niños.
SOUTHERN OSCILLATION INDEX (SOI)
The Southern Oscillation Index is another widely used reference for the strength, frequency and duration of El Niño and La Niña events. We discussed the Southern Oscillation Index in Part 8 of this series. It is derived from the sea level pressures of Tahiti and Darwin, Australia. El Niño events are strong negative values and La Niñas are strong positive values, which is the reverse of what we see with sea surface temperatures. The May 2014 Southern Oscillation Index value is +4.4, which is definitely not an indicator of El Niño conditions. Figure 6 presents a time-series graph of the SOI data.

Figure 6
Figure 7 compares the evolution of the SOI values this year to those in 1982 and 1997, the development years of the strong 1982/83 and 1997/98 El Niños. The top graph is the monthly SOI data, and the bottom graph presents the monthly data smoothed with a 3-month filter to reduce some of the weather “noise”. In both cases, the Southern Oscillation Index this year is lagging behind the values in 1982 and 1997.

Figure 7
Refer also to the discussion of a video from WeatherBell’s Joe Bastardi later in the post.
COMPARISONS OF HOVMOLLER DIAGRAMS OF THIS YEAR (TO DATE) WITH 1997
Hovmoller diagrams are a great way to display data. If they’re new to you, there’s no reason to be intimidated by them. Let’s take a look at Figure 8. It presents the Hovmoller diagrams of thermocline depth anomalies (the depth of the isotherm at 20 deg C) with 2014 on the left and 1997 on the right. GODAS, unfortunately, furnishes the illustrations (not the data) in different dimensions for the two years. The vertical (y) axis in both is time with the Januarys for both years at the top and Decembers at the bottom. The horizontal (x) axis is longitude, so, moving from left to right, we’re going from west to east…with the Indian Ocean in the left-hand portion, the Pacific in the center and the Atlantic in the right-hand portion. We’re interested in the Pacific. The data are color-coded according to the scales below the Hovmollers.

Figure 8
Figure 8 is presenting the depth of the 20 deg C isotherm along a band from 2S to 2N. The positive anomalies, working their way eastward since the beginning of 2014, were caused by the downwelling Kelvin wave, which pushes down on the thermocline (the 20 deg C isotherm). You’ll note how the anomalies grew in strength as the Kelvin wave migrated east. That does not mean the Kelvin wave is getting stronger as it traveled east; that simply indicates that the thermocline is normally closer to the surface in the eastern equatorial Pacific than it is in the western portion. The 1997/98 El Niño was preceded by two downwelling Kelvin waves shown in the right-hand Hovmoller in Figure 8. The first one that began in 1996 wasn’t very strong, but the second one that began a few months later in 1997 was enough to start the 1997/98 El Niño.
Note how the thermocline continued to drop in the eastern equatorial Pacific as 1997 progressed. The 1997/98 El Niño was a freak. So much warm water flooded from the western tropical Pacific into the eastern portion that the normal warm water distribution below the surface of the equator reversed. That is, normally there is more warm water in the western portion than in the eastern portion of the equatorial Pacific so that the thermocline slopes upward from west to east, but at the peak of the 1997/98 El Niño, there was more warm water in the central and eastern portion than the west, with the slope of the thermocline growing downward from west to east. (See the cross section from ECMWF here.)
Figure 9 presents the 2014-to-date and 1997 Hovmollers for wind stress (not anomalies) along the equator. The simplest way to explain them is that they’re presenting the impacts of the strengths and directions of the trade winds on the surfaces of the equatorial oceans. In this presentation the effects of the east to west trade winds at various strengths are shown in blues, and the reversals of the trade winds into westerlies are shown in yellows, oranges and reds.

Figure 9
The two westerly wind bursts shown in red in the western equatorial Pacific in 2014 are associated with the downwelling Kelvin wave, and the westerly bursts early in 1997 are associated with the Kelvin waves that year. (See the post ENSO Basics: Westerly Wind Bursts Initiate an El Niño.) Note how in 1997, as the May progressed through September, the negative wind stresses decreased (associated with a weakening of the trade winds), with the neutral whites expanding eastward. Also note the repeated westerly wind bursts in the western equatorial Pacific from August through November. Those westerly wind bursts throughout 1997 continued to help push warm water from the western equatorial Pacific into the east, strengthening the 1997/98 El Niño.
Figure 10 presents the Hovmollers of wind stress anomalies…just a different perspective. Note how there were more positive wind stress anomalies in the western equatorial Pacific in 1997 than there have been so far this year. It doesn’t look as though this El Niño will be anywhere near the strength of the one in 1997/98.

Figure 10
And Figure 11 presents the Hovmollers of sea surface temperature anomalies. Unfortunately, the Hovmoller of sea surface temperature anomalies is delayed a few weeks…thus the purplish line. But as we’ve seen in the comparison graphs in Figure 2, the sea surface temperature anomalies of the NINO3.4 and NINO3 regions in 2014 are starting to fall behind those of 1997, and the sea surface temperature anomalies this year in the NINO1+2 region are less than they were at this time in 1997. As you’ll note in the Hovmoller for this year, it didn’t take long for the La Niña conditions in the eastern equatorial Pacific to disappear.

Figure 11
A FEW COMPARISONS OF HOVMOLLER DIAGRAMS OF 1982 AND 1997
Some readers are hoping for an El Niño this year to end the drought in their regions. Others are hoping against it, since an El Niño could extend their drought. Because many of the indices this year have fallen behind the 1997/98 El Niño, that does not mean there will not be full-fledged El Niño this year. It also does not mean the El Niño this year will be weak…or strong. It’s still too early to tell. If you were to scroll up to Figure 2, you can see that evolutions of the sea surface temperature anomalies for the NINO3 and NINO3.4 regions started out pretty much the same for the 1982/83 and 1997/98 El Niño events, but then the 1982/83 sea surface temperatures started to lag behind during the months of May through late July, early August—the boreal summer, austral winter. Afterward, the 1982/83 El Niño began to strengthen and eventually grow as strong as the 1997/98 El Niño toward the end of the year in the NINO3.4 region.
Figure 12 compares the Hovmoller diagrams of winds stress anomalies for 1997 (left) to those during 1982 (right). We can see that the initial westerly wind bursts in 1997 were stronger than they were in 1982, and that the wind stress anomalies were much stronger starting in May 1997 and lasting through to the end of the year. During that time in 1997, as a result of the additional wind stress anomalies, the Pacific undercurrent (subsurface) and the equatorial counter current (on the surface), should have been transporting much more warm water, compared to 1982, from the western tropical Pacific to the east.

Figure 12
As a result, the sea surfaces of the eastern tropical Pacific warmed earlier, and warmed much more in 1997 than they did in 1982. See the Hovmoller comparison of sea surface temperature anomalies in Figure 13.

Figure 13
This also appears quite obviously in a comparison of the evolutions of the sea surface temperature anomalies of the entire eastern equatorial Pacific, from the dateline to Ecuador. See Figure 14.

Figure 14
We’d never know that the 1997/98 El Niño was much stronger than the 1982/83 El Niño by looking at the most-used sea surface temperature-based ENSO index (NINO3.4 SST anomalies). They show the 1982/83 El Niño was comparable to the 1997/98 El Niño, but it wasn’t. The 1997/98 El Niño was much stronger over the entire eastern equatorial Pacific.
Bottom line: there could be a strong El Niño this year, but we won’t know for sure until the boreal summer, austral winter. The trade winds are going to have to weaken. That’s basically the message from IRI’s Tony Barston in his May 2014 Climate Briefing video. And there’s a remote possibility that this El Niño could fail to continue to develop.
WHAT’S HOLDING BACK THIS EL NINO?
In his Saturday Summary for May 10, 2014 video, Joe Bastardi of WeatherBellAnalystics discussed why this upcoming El Niño will likely not be a strong as the 1997/98 El Niño, and why the Southern Oscillation Index had been positive in April (and continued to remain positive in May). Before I provide a link, there are a couple of things to discuss.
Joe will note that the sea surface temperatures in the West Pacific Warm Pool are warmer now than they were in 1997, and that the warmer sea surface temperatures there are impacting the trade winds. See Figure 15.

Figure 15
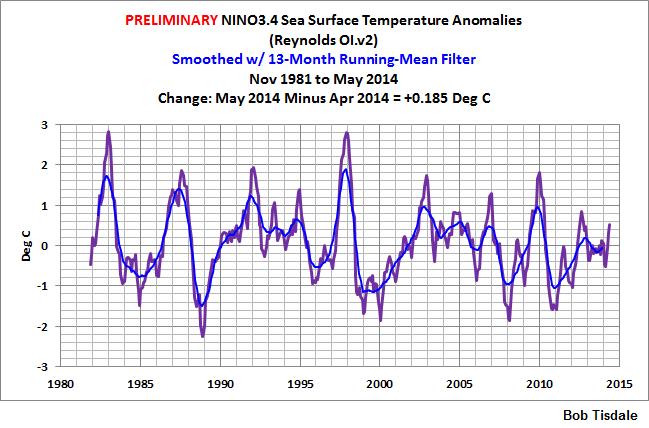
That might lead some visitors here to think the warming in the West Pacific Warm Pool was caused by manmade greenhouse gases. But the sea surface temperature data for the entire tropical Pacific show the surfaces there have not warmed in more than 32 years, Figure 16, while the climate models indicate they should have warmed more than 0.55 deg C in that time, assuming they were warmed by the infrared radiation associated with those manmade greenhouse gases. It’s tough to claim the surface warming in the western tropical Pacific was caused by anthropogenic greenhouse gases when the surface of the tropical Pacific as a whole has not warmed in more than 3 decades.

Figure 16
Figure 16 was originally presented in this year’s model-data comparison for sea surface temperatures Maybe the IPCC’s Modelers Should Try to Simulate Earth’s Oceans.
The sea surface temperatures of the West Pacific Warm Pool (see graph here) show that the warming occurred in El Niño-related upward shifts in response to the 1986/87/88 and 1997/98 El Niño events. Those steps are the result of the warm waters discharged from below the surface during those El Niños and the increased strength of the trade winds in response to that warming, with the stronger trade winds providing positive feedback. Thus, while the surface of the western tropical Pacific warmed, the surface of the entire tropical Pacific has not.
And as we discussed in the second post in this series, while the ocean heat content in the western tropical Pacific was comparable before the start of the 2014/15 and 1997/98 El Niños, the ocean heat content of the eastern tropical Pacific was much lower before the start of this El Niño. So, while the Kelvin wave may have had a comparable supply of warm subsurface water in the western tropical Pacific to draw from this year, when it arrived in the eastern tropical Pacific, it entered a cooler environment. That also has not helped it.
Joe also appears to use the term PDO to mean the multidecadal variations of ENSO in his discussion. To avoid confusion with the PDO Index from the North Pacific, I would have said that the evolutions of El Niño events changed after the Pacific Climate Shift of 1976, and again shifted after the 2006/07 El Niño, which then led to two pairs of double-dip La Niña events, one double-dip before and one double-dip after the 2009/10 El Nino. (The 1998-01 La Niña and the El Niño events of 2002/03 and 2004/05 appear to be aftereffects of the 1997/98 El Niño.) For a further discussion of the PDO, see the 5th post in this series.
And without further introduction, here’s a link to Joe Bastardi’s Saturday Summary for May 10, 2014. Joe’s discussion in the video of this year’s El Niño starts about the 3:45 minute mark. Thanks, Joe.
WHAT’S NEXT IN THIS SERIES?
There are a couple of recent posts by an alarmist and one by a reporter (whose error may have been unintentional) that provide food for a post. RobertScribbler is always full of misinformation. (More examples here and here. I wonder if he’s vying for a job with Joe Romm.) And Nate Cohn’s article in the NYT includes at least one blatant El Niño-related error. I’ll have to read it again to see if there are more. Do you know of any other recent posts or articles with misinformation about the upcoming El Niño? I’d be happy to include them.
I started work on a new video about ENSO basics and will try to complete it within the next month or two. Last, my new book is progressing slowly but surely. I’m shooting for a completion date toward September 2014.
THE NOAA ENSO BLOG
Almost forgot: NOAA has recently opened an ENSO blog. Since May 5, 2014, they’ve published 6 posts. Their postHow ENSO leads to a cascade of global impacts, authored by Anthony Barnston of IRI, would definitely have provided an additional support link for our discussion in Part 6 of this series.
EARLIER POSTS IN THIS SERIES
- The 2014/15 El Niño – Part 1 – The Initial Processes of the El Niño.
- The 2014/15 El Niño – Part 2 – The Alarmist Misinformation (BS) Begins
- The 2014/15 El Niño – Part 3 – Early Evolution – Comparison with 1982/83 & 1997/98 El Niño Events
- The 2014/15 El Niño – Part 4 – Early Evolution – Comparison with Other Satellite-Era El Niños
- The 2014/15 El Niño – Part 5 – The Relationship Between the PDO and ENSO
- The 2014/15 El Niño – Part 6 – What’s All The Hubbub About?…
- The 2014/15 El Niño – Part 7 – May 2014 Update and What Should Happen Next
- The 2014/15 El Niño – Part 8 – The Southern Oscillation Indices
- The 2014/15 El Niño – Part 9 – Kevin Trenberth is Looking Forward to Another “Big Jump”
And for additional introductory discussions of El Niño processes see:
- An Illustrated Introduction to the Basic Processes that Drive El Niño and La Niña Events
- El Niño and La Niña Basics: Introduction to the Pacific Trade Winds
- La Niñas Do NOT Suck Heat from the Atmosphere
- ENSO Basics: Westerly Wind Bursts Initiate an El Niño
FURTHER READING
My ebook Who Turned on the Heat? goes into a tremendous amount of detail to explain El Niño and La Niña processes and the long-term aftereffects of strong El Niño events. Who Turned on the Heat? weighs in at a whopping 550+ pages, about 110,000+ words. It contains somewhere in the neighborhood of 380 color illustrations. In pdf form, it’s about 23MB. It includes links to more than a dozen animations, which allow the reader to view ENSO processes and the interactions between variables.
I’ve lowered the price of Who Turned on the Heat? from U.S.$8.00 to U.S.$5.00. A free preview in pdf format is here. The preview includes the Table of Contents, the Introduction, the first half of section 1 (which was provided complete in the post here), a discussion of the cover, and the Closing. Take a run through the Table of Contents. It is a very-detailed and well-illustrated book—using data from the real world, not models of a virtual world. Who Turned on the Heat? is only available in pdf format…and will only be available in that format. Click here to purchase a copy. Thanks. (I also am very happy to receive tips or donations.)
Thanks for the update Bob.
Thanks Bob. You are a tireless asset.
Cue Trenberth blaming the lack of warming on Indonesian volcanic activity :-). It will be amusing to see how he manages to blame volcanoes without leaving himself open to the suggestion that the sun causing warming during El Ninos 🙂
http://wattsupwiththat.com/2014/05/30/large-volcanic-eruption-in-indonesia-this-years-excuse-for-the-pause/
These newest figures for May have torpedoed any sensible talk about strong el ninos. It will be moderate at worst, likely weak and possibly (though not likely) no el nino at all.
Maybe Kevin was referring to volcanoes on the sun?
Bob, thanks. I guess we had best be ready for some Gulf of Mexico weather later this season……
Thanks Bob! Good stuff.
excellent post as always Bob…thanks
The PDO and MEI are linked closely. In other words, you will see the PDO and MEI warm together much of the time and cold together also. There are differences between the two, its just that, for instance, we notice the MEI going positive now and so is the PDO. The reason is simple, both of them rely on conditions in the tropical Pacific for their derivation to some degree, so if the tropical pacific is warming or cooling both of them are going to respond. Here an example, the El Nino of 1957-1958. The PDO in Jan 1957 was MINUS 1.82. June is skyrocketed to plus 1.76 and was still plus 1.5 in October before falling off. The mark of the cold PDO/MEI ( when the MEI is predominately cold too, as it is when the PDO is cold is a rapid run up then flattening) The most recent enso event, 09/10 had a PDO of -1.4 in Jan of 2009, it reached plus .83 in Jan 10. So the PDO spikes too! The latest April Value was plus 1.13 indicating we are already seeing the PDO contribution maturing.. and yet no response from the SOI . IN 1997 THE PDO REACHED 2.79 but at the height of the 83 ENSO event is was over 3.5!
Now lets get back to the MEI. Jan 1957 it was MINUS .948 BY MAY IT WAS plus .908 , peaking at plus 1.474 in Jan of 1958! So you in any enso event beyond something weak, the MEI and PDO are going to spike. So its not that I dont mean one when I mean the other, I am simply speaking of two cousins in the family that are indicative of what is going on. But because of what is used to calculate them, there are both going to be close in their trends. The biggest problem here is the ATMOSPHERE is not responding in the way that can allow this to develop to its fullest capacity. The warm water around se asia means lower pressures. Lower pressures do not allow the type of slackening of the trades that higher pressures would. That means the warm water can not mature at the top. In addition the MEI chart shows it all.. when there are el ninos after prolonged cold events of the MEI, or the PDO, the enso events are the modikie 3.4 warmer than 1.2 in maturity and come and go.
http://www.esrl.noaa.gov/psd/enso/mei/
The super ninos occur in a much warmer time. 82-83 was 5 years after the PDO flipped. The super nino of the 90s, the mei was almost always warm, Its interesting to note the warm PDO started and then ended to some extent ( the 97-98 super was followed by prolonged cold and the MEI enso events never outdid the cold before them and then after starting in 07) with the super ninos But a look at the PDO shows its VERY CLOSE to the MEI here too
http://en.wikipedia.org/wiki/Pacific_decadal_oscillation#mediaviewer/File:PDO.svg
The point is the PDO and MEI are closely related and the weatherbell.com idea since March, which Joe D aleo is a part of is for the 02/03, 09/10 events to be the most recent close ones. But the family this is coming out of is the 50s-70s, not 80s-90s in our opinion
Joe wrote the definitive paper on the length of warm and cold enso events in warm and cold PDOs discovering there is an almost perfect relationship with the length of stay and strength. The cold PDO have warm enso that average 9 months, cold 21 months, the warm PDO has the warm enso lasting 21 on average, la nina events 9 months
From the temperature anomaly animations, it kind of looks like the intensity of the anomalies have already started to diminish by quite a bit. I’m thinking we won’t get much more push towards El Nino this year.
Cam says:
June 4, 2014 at 3:05 pm
From the temperature anomaly animations, it kind of looks like the intensity of the anomalies have already started to diminish by quite a bit. I’m thinking we won’t get much more push towards El Nino this year.
As Cam notes, the animation makes it look like the warmer water coming to the surface ends in about 1 month. Then temps would stop climbing. Is that a reasonable interpretation?
Why is everyone except us so convinced this is going to be a super El Nino despite the face every official forecast I’ve see has it peaking at ~1.5 when both 1982 and 1998 peaked at 3?
Cam says: “From the temperature anomaly animations, it kind of looks like the intensity of the anomalies have already started to diminish by quite a bit….”
I’m not sure what you’re seeing in the animation. The “evolution” graphs of sea surface temperatures for the equatorial Pacific, and of eastern equatorial Pacific warm water volume and depth-averaged temperature to 300 meters do not show decreases in anomalies.
Regards
MattN says: “Why is everyone except us so convinced this is going to be a super El Nino despite the face every official forecast I’ve see has it peaking at ~1.5 when both 1982 and 1998 peaked at 3?”
I believe they may be relying on the reports from earlier this year, and they have not caught up with the fact that the researchers have cut back on their predictions.
Joseph Bastardi says: “The PDO and MEI are linked closely.”
Agreed. The MEI is an ENSO index, and the PDO reflects the impact of ENSO on the spatial pattern of sea surface temperatures in the extratropical North Pacific.
Cheers.
Hoping for at least normal rainfall in the 2014 – 2015 water year. It is not too much to ask.
I’m far behind in competence than others here (hey, at least I admit it), so take this for what it isn’t worth. Cliff Mass, a meteorology professor at the U of Washington, has written about the coming El Nino. My takeaways are the following:
1. Likely a fairly mild El Nino, not like 1998.
2. We won’t have a truly accurate forecast until mid-summer.
Bob Tisdale, Much thanks for this information. The graphical detail provided in the above post is very useful and informative.
One question: Do you think lunar declination plays an important role in the formation of El Ninos and what might happen next year with the minima?
More power to you! Jen
It is watching history in the making, with someone to give us the insights into the events during, instead of after. A fascinating read. Thanks Bob!
Jennifer Marohasy says: “Do you think lunar declination plays an important role in the formation of El Ninos and what might happen next year with the minima?”
Hi Jennifer. Sorry, I haven’t studied the subject.
Pacific temperature anomalies of +/- 0.5 degrees C over just a few years. Surely that has a lot of effect on overall earth temperature and limits the resolution with which trends can be determined.
As we know, there was a large volcanic eruption around May 30. And according to:
http://cci-reanalyzer.org/DailySummary/index_ds.php
the global temperature anomalies from May 31 to June 4 were, respectively: 0.67, 0.60, 0.55, 0.49 and 0.47. That is a drop of 0.20 in 5 days. Would this have been due to the volcano? And if so, is this an indication of how this volcano could nullify the warming effect of a potential El Nino? Thanks!
Bob, you are eye candy. Having never seen you I have only your graphs to tell me that. And I love your graphs.
And yet we see another infomercial for Bob’s book…
REPLY: And yet, Bob writes here for free, improving knowledge for the benefit of all. I’m inclined to give him a pass on a book promotion.
Other than a complaint, do you have anything to contribute/ – Anthony
Werner, historically we really don’t have much in the way of upper atmospheric info on Volcanic distribution of particulate matter to usable resolution that I can find. Nothing pre-sat era is really applicable.
Volcanic activity has played a role in climate from day one and is a variable of which we have little usable data.