
Guest post by Alec Rawls
Here is the puzzle, as noted by Nigel Calder and others: how can BEST insist that a modicum of additional evidence of late 20th century warming should put skepticism of the CO2-warming theory to rest, while at the same time admitting that they never even tried to examine the possible causes of warming?
Elizabeth Muller’s press statement in support of anti-CO2 alarmism is extreme:
Elizabeth Muller, co-founder and Executive Director of Berkeley Earth, said she hopes the Berkeley Earth findings will help “cool the debate over global warming by addressing many of the valid concerns of the skeptics in a clear and rigorous way.” This will be especially important in the run-up to the COP 17 meeting in Durban, South Africa, later this year, where participants will discuss targets for reducing Greenhouse Gas (GHG)emissions for the next commitment period as well as issues such as financing, technology transfer and cooperative action.
She is strongly implying that BEST’s findings not only support the CO2 theory of late 20th century warming, but justify radical worldwide government action to reduce carbon emissions.
Richard Muller’s statement of ignorance on the cause of the observed warming is equally absolute:
What Berkeley Earth has not done is make an independent assessment of how much of the observed warming is due to human actions.
Contradictory, yes, but also explanatory. Muller et al. must be so ignorant of this climate science subject that they are brand-new to that they are not even aware that the leading competing climate theory, where solar-magnetic activity modulates cloud formation, also predicts and explains late 20th warming. All they know is that the CO2 theory predicts warming, prompting them to see evidence of warming as evidence for that theory.
This is the only logical explanation for Muller vs. Muller, and it would also explain why BEST made such a complete hash of the only part of their data that does have any power to discriminate between CO2-warming and solar-warming.
Opposite temperature predictions for quiet-sun era
If late 20th century warming was mostly caused by the industrial release of atmospheric CO2, then warming should be continuing apace, but if 20th century warming was mostly caused by the 80 year grand maximum of solar activity that waned in the 1990’s and ended in 2005, then planetary temperature (as measured by the heat content of the oceans) should have been falling for several years now. In a less smooth way, surface temperatures would also be passing the peak of the Modern Warm period.
Nature is right now conducting an ideal experiment for determining which theory is right, but on this crucial part of the temperature record—what happened when solar activity waned and then dropped into the cellar—BEST’s presentation is remarkably confused. The sample station analysis that they released shows substantially more post-98 cooling than any of the other land records, while their full data set has recent temperatures going up compared to the other records.
Here is a zoom-in on figure 1 from BEST’s “decadal variations” paper. It shows the most recent temperatures for a sub-sample of temperature stations (“[this] Berkeley Earth data were randomly chosen from 30,964 sites that were not used by the other groups”):

Wow, this sub-sample really favors the sun as the primary driver of climate, certainly compared to the NOAA, GISS and Hadley evidence. The BEST temperatures are equal or above the other temperature records throughout the 80’s and 90’s, then drop precipitously below them over the last ten years, as the sun has gone quiet.
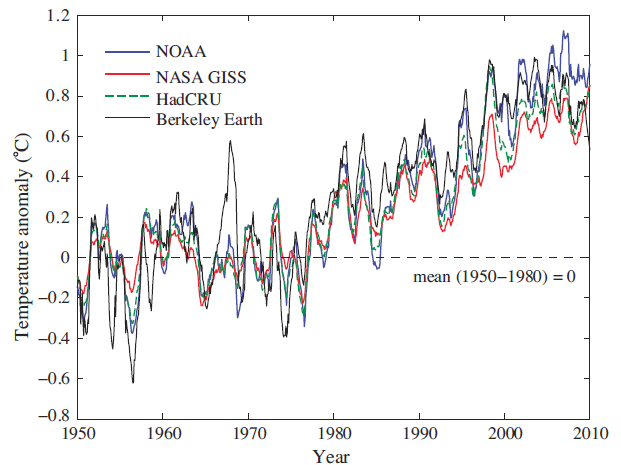
BEST’s full data set tells the opposite story. Here is their 12 month average surface temperature (figure 8 from their “Temperature Averaging Process” paper):

The second part of figure 8 shows the differences. NOAA and GISS both drop off a couple of tenths of a degree relative to BEST after 2000, while Hadley drops off about a half a degree!

Wow, compared to the evidence provided by the other temperature records, BEST’s full sample really favors the CO2 theory over this critical period. Thus on the only part of the temperature record that is probative, BEST displays two strongly contradictory graphs without a word of commentary. That’s a pretty good sign that they are oblivious to the discriminatory power of this part of the record, indicating again that they are not even aware of the GCR-cloud theory and its implications. No wonder they can do such incredibly biased things as calling “the late part of the 20th century,” “the anthropogenic era” (p. 30). Anthropogenic warming is their premise.
BEST evidence is not best evidence
Almost all of the heat capacity of the biosphere is in the oceans. Thus climate change over time means a change in ocean heat content. Land surface temperature is a volatile expression of this global temperature, depending on whether colder or warmer ocean currents are at the surface. That volatility makes surface temperatures an iffy way to track climate change, and today, better evidence is available.
In recent years, ARGO’s automated fleet of temperature sounding devices provides much improved direct measurement of ocean temperature. According to NOAA, data from these floats show ocean heat content for the top 700 meters as close to flat for about 10 years now:

(Bob Tisdale says that NOAA has recently started reporting heat content for the top 2000 meters, but apparently it is still a work in progress, as they don’t display it on their heat content page.)
Ocean heat content can also be measured by sea level, which is determined by the thermal expansion of the oceans, plus net land-ice melt. Here is NOAA’s sea level data, compensated for land-ice melt and variations in salinity. It shows ocean heat content as roughly flat for about the last eight years:

This best evidence indicates that global warming has stopped, which militates against the CO2 theory of late 20th century warming, but the oceans do not show the global cooling that the solar-theory predicts, so it does not clearly favor the cosmic-ray-cloud hypothesis either. The very latest sea level data, however, may finally be telling the tale:

Steve Goddard, September 2011: “The latest sea level numbers are out, and Envisat shows that the two year long decline is continuing, at a rate of 5mm per year.”
That’s actual sea level, not steric sea level. Subtract out the ongoing land-ice melt from our currently warm climate and thermosteric sea level is falling even more rapidly. If cosmic-ray-cloud effects do dominate CO2 effects, we’ll probably have full proof within the next couple of years.
Can BEST actually be unaware of the cosmic-ray-cloud theory, or are they just accepting the CO2-alarmists’ excuses for dismissing solar effects?
Unless Muller is a world-class fruitcake, he can’t have waded into the climate arena without at least being aware of Svensmark’s theory. He must also know that the sun has gone quiet, and his Nobel-physics brain would be able to figure out how this natural experiment provides a test of which theory is right. Yet he might still act as if he is unaware of solar warming theory if he has been convinced by the alarmists’ bogus excuses for why recent warming can’t have been caused by the sun.
Over and over, these folks claim that late 20th century cannot have been caused by the sun because solar activity was not rising over this period. e.g. Rasmus Benestad, 2005:
A further comparison with the monthly sunspot number, cosmic galactic rays and 10.7 cm absolute radio flux since 1950 gives no indication of a systematic trend in the level of solar activity that can explain the most recent global warming.
That reasoning obviously requires an assumption that ocean temperatures had equilibrated to the high level of 20th century solar forcing by 1950. Otherwise the continued high level of solar forcing (the hypothesis under consideration) would cause continued warming until ocean equilibrium was reached. Yet Benestad did not even acknowledge this assumption, never mind make any case for it, and this has been the pattern.
I have written several posts on the alarmists’ excuses for dismissing the solar explanation and how they utterly fail to stand up to scrutiny. But without even going into those details, the more basic point is that the various rationales for dismissing the solar warming hypothesis are theoretical. They are, in effect, part of the CO2 warming theory. Our recently quiet sun offers a test of which theory makes the right prediction. To ignore that test because one already agrees with one of the theories, as BEST seems to be doing, is to put theory over evidence, the opposite of what scientists are supposed to do.
Well, the answer is in this sentence: “He must also know that the sun has gone quiet, and his Nobel-physics brain would be able to figure out how this natural experiment provides a test of which theory is right.”
A Nobel-physics brain does not comprehend experiments or reality. A Nobel-physics brain only comprehends raw mathematics, free of all context and content.
Wasn’t BEST’s original intent just to make the surface stations dataset as clean as possible and leave it to others to use the data? Isn’t it mission-creep to begin speculation before the primary goal is achieved?
Mr. Rawls, you are an uncommonly clear presenter of somewhat complex science. The last paragraph of this article is the best concise statement of the question of global warming AND the best concise statement of the essence of true science I have read in a very long time. Thank you. James J. Hill
http://www.real-science.com/muller-data-proves-skeptic#comments
“Unless Muller is a world-class fruitcake, ……”
I think its too early to rule that out. What is fantastic about BEST is that they’ve simply given us something we’ve already had. A very questionable historical temp record.
But, even Muller’s temp record tells us the same thing the others tell us……
it isn’t warming anymore. And even though the press release says this is proof that the earth is warming, BEST’s own data shows that it isn’t.
http://suyts.wordpress.com/2011/10/28/best-proves-that-the-earth-is-warming/
” He must also know that the sun has gone quiet, and his Nobel-physics brain would be able to figure out how this natural experiment provides a test of which theory is right.”
I respectfully disagree –
doesn’t this only provide a test of which “theory”, or perhaps better “concept” since I don’t believe the CAGW by CO2 idea has reached “theory” level, is more likely to be right while also showing which concept does not appear to match observations?
“…..VALID concerns of the skeptics…..”
It’s a start, I suppose.
Will BEST also issue their support of Gaddafi the way the South Africans did? Maybe that will be part of a quid pro quo for more SA govt. statements in support of climate change NOW actions, or maybe that was pre-arranged as part of the site selection process for the conference.
With what appears to be an ocean cooling cycle in the making is it possible that we will also see a drop in CO2 levels, and if so would we see it globally or would it first show up at certain latitude? If the ocean temp drops 1c what kind of ppm of CO2 is possible?
I really liked using the word “appears” in that sentence I have read it so many times in the last month.
Latitude: Thanks for linking to that detailed plot of the last 10 yrs of the full BEST data. I hadn’t seen that before. Sure doesn’t look like the figure 8 graph from the “analysis” paper that I included in the post. I thought figure 8 was just a more legible version of the full data plot they have on their “Analysis Charts” page, but I guess not.
So their data is actually unambiguously supportive of the solar-warming theory? I’ve got to get out more.
Ever wonder why no international climate meetings are held in winter, other than tropical retreats and southern hemisphere during winter for norther hemisphere? No trend there right…?
Alec Rawls says:
October 28, 2011 at 12:43 pm
Latitude: Thanks for linking to that detailed plot of the last 10 yrs of the full BEST data………..
So their data is actually unambiguously supportive of the solar-warming theory? I’ve got to get out more.
===============================================
Its from WFT….. http://www.woodfortrees.org/plot/best/from:2001.75/plot/best/from:2001.75/trend ……He just added the BEST data as of the 26th. It’s a neat site to go play every once in a while. I’ve got to hand it to him, the way I’m downloading the data, it comes n huge a$$ txt file… and It errors out about 1/2 of the times I open the darn thing, else I would have already done it myself. But, yes, the BEST data tells us everything we’ve already been told. Almost $200,000 of DOE wasted, again.
Thoughtless, deliberate defacement of a perfectly good “fighting kittens” picture. Barbarians.
I also notice (with no study at all) that the 0-700m ocean heat content has gone up a factor of 5 (from 2E22 Joules to 10E22 J) from 1991 to the present, but the NOAA NCEP SST anomaly in 2011 is right on track with the 1991 anomaly. This tells me what I already knew from my Venus/Earth atmospheric temperatures comparison–there is no ocean effect (indeed, no surface effect at all) upon the hydrostatic, equilibrium vertical temperature distribution (in particular, upon the global mean surface temperature). This makes me doubt even the multidecadal ocean oscillations theory of (ocean forcing) “climate” change. It is just the Sun, and only the Sun, because the atmosphere is warmed by absorption of incident solar infrared radiation, not from the surface, as my Venus/Earth comparison clearly shows. Clearly, the Standard Atmosphere rules, and there simply is no climate science worthy of the name.
Jeff D says:
October 28, 2011 at 12:42 pm
is it possible that we will also see a drop in CO2 levels
Not much chance: a drop of 1°C would give a drop of 16 microatm in sea surface CO2 pressure, which gives a steady state with the atmosphere at about 16 ppmv. But as the biosphere acts in opposite way by absorbing less CO2 at lower temperatures, the real drop probably is not more than 8 ppmv/°C (as 800,000 years ice cores show) over longer periods. Thus even a 1°C drop in temperature will halt the increase from 4 ppmv/year human emissions for not more than a few years…
How can any scientist say something like ( Rasmus Benestad, 2005 ):
“A further comparison with the monthly sunspot number, cosmic galactic rays and 10.7 cm absolute radio flux since 1950 gives no indication of a systematic trend in the level of solar activity that can explain the most recent global warming”.
It is like saying that if the milk on the stove warms without me continuously increasing the gas flame I have to look for some mystical explanation. How does such a statement pass peer review? As if I did not know.
Alec Rawls says:
October 28, 2011 at 12:43 pm
I’ve got to get out more.
===============================
….just hang out with us more on Steve’s and James’ blogs………….LOL
James J. Hill says: “Mr. Rawls, you are an uncommonly clear presenter of somewhat complex science. The last paragraph of this article is the best concise statement of the question of global warming AND the best concise statement of the essence of true science I have read in a very long time.”
This and Alec Rawl’s other posts have little basis in science. His hypotheses are based solely on speculation.
I really hate politics but looks like Muller got what he wanted or might be getting. I wish this post could be read as the counter.
http://www.talkradionews.com/news/2011/10/28/house-dems-call-for-hearing-on-climate-change-science.html
Check this out.
Just recently, I said that it sure looks like Muller is not and never was a skeptic, a quote from the first part of the above article:
”
WaPo’s “skeptic” actually has backed global warming for 30 years
October 22, 2011 by Don Surber
The first rule of journalism is “If your mother says she loves you, check it out.” Brad Plumer of the Washington Post overlooked that rule in reporting that an alleged global warming skeptic is now a convert — because the “skeptic” in question — physicist Richard Muller of Berkeley — embraced the theory of man-made global warming 30 years ago. An online search easily disproved his claim of skepticism. He co-authored a book, “Physics For Future Presidents,” that explained climate change among other things. Now he has re-branded himself a former skeptic — the better to sell global warming.”
Note the phrase “the better to sell global warming”, check check this out and you will see GreenGov, a company to make money from global warming, a clear conflict of interest.
The only good news, he is sort of lukewarm in the warming camp, he does not appear to embrace the idea that we should impoverish ourselves to stop the warming. Of course, that fact that this can result in more money for his company doesn’t hurt either. Also, while he may not be a fanatic, those reporting about him are, and will do everything they can to blow up anything that promotes the warming agenda and tears down the “skeptics”. He is also surrounded by those who are fanatics or just along for the ride (AGW as a promoter of socialism, meaning they get to be in charge), and he will be subjected to enormous peer pressure and manipulation.
polistra says:
October 28, 2011 at 11:30 am
“A Nobel-physics brain does not comprehend experiments or reality. A Nobel-physics brain only comprehends raw mathematics, free of all context and content.”
DOE Secretary Steven “White-Paint” Chu is an excellent example.
As some of Almor Goretry’s disciples have stated: global warming is happening but is being concealed by other factors and , therefore, does not appear in the historical temperature record – the potential awaiting the kinetic.
Global warming, climate change and climate chaos are not synonyms for anthropogenic Carbon Dioxide
Dr. Tim Ball published a series of articles on the Canada Free Press that recounts the history of IPCC’s efforts to promote the adverse effects of human caused Carbon Dioxide.
From Part 4: How UN structures were designed to prove human CO2 was causing global warming
By Dr. Tim Ball Wednesday, April 30, 2008
Science creates theories based on assumptions that are then tested by other scientists performing as skeptics. The structure and mandate of the IPCC was in direct contradiction to this scientific method. They set out to prove the theory rather than disprove it. Maurice Strong and his UN committees’ objectives, especially the IPCC made sure the focus was on human caused change and CO2 as the particular culprit. They’d already biased the research by using a very narrow definition of climate change in article 1 of the United Nations Framework Convention on Climate Change (UNFCCC), a treaty produced at that infamous “Earth Summit” in Rio in 1992. Climate Change was defined as “a change of climate which is attributed directly or indirectly to human activity that alters the composition of the global atmosphere and which is in addition to natural climate variability observed over considerable time periods. This makes the human impact the primary purpose of the research. The problem is you cannot determine that unless you know the amount and cause of natural climate change.
From Part 5: Wreaking Havoc on Global Economies
By Dr. Tim Ball Monday, May 5, 2008
How did the IPCC maintain control and convince many, including political leaders they were right and were the authority? Beyond using UN agencies as vehicles they had the challenge of running an apparently open process while keeping total control. This appeared to take several forms.
1. Controlling who participated and who were the lead authors, especially of critical chapters. As Lindzen explains, “IPCC’s emphasis, however, isn’t on getting qualified scientists, but on getting representatives from over 100 countries, said Lindzen. The truth is only a handful of countries do quality climate research. Most of the so-called experts served merely to pad the numbers.”
2. Publishing the political document, the Summary for Policymakers (SPM) before the Technical (Science) Report of Working Group I was issued. Making sure the Technical Report matched the SPM. As Lindzen said, “The IPCC clearly uses the Summary for Policymakers to misrepresent what is in the report, said Lindzen.”
3. It’s difficult to describe scientific information for an essentially non-scientific audience through the media; what one blogger describes as the “Math-Free Zone of Journalism”. Columnist James Kilpatrick says “People who write for a living should never be left alone with mathematics. They are almost bound to mess up.” They are less likely to with the terms used by the IPCC, but it is easier to dramatize. Using non-mathematic terminology in the SPM, exemplified by the labels set out in a table in the third report, such as; Very unlikely (1–10 %) Likely (66–90 %) Very likely (90–99 % ). The percentages are not used in the Technical Report. As one study says, “How the assessment frames the information is determined by the choices and goals of the users.” (link)
4. Including and highlighting studies that appeared to identify a “human signal” while excluding others.
5. Focusing on negative impacts of warming when there are positive effects.
Here is Lindzen’s summary of the IPCC process. “It uses summaries to misrepresent what scientists say; uses language that means different things to scientists and laymen; exploits public ignorance over quantitative matters; exploits what scientists can agree on while ignoring disagreements to support the global warming agenda; and exaggerates scientific accuracy and certainty and the authority of undistinguished scientists.”
From Part 7: The Unholy Alliance that manufactured Global Warming
By Dr. Tim Ball Wednesday, May 21, 2008
Contrary to popular belief politicians do listen. The problem is they usually hear if they think there is a consensus, whether right or wrong, or if the issue can garner votes. Both these situations existed in the claims of global warming. In addition, most politicians don’t understand climate science and were forced to rely on the bureaucrats.
The most notorious was the Hockey Stick (HS) in the IPCC 2001 Third Assessment Report (TAR). Despite its destruction by McIntyre and McKitrick confirmed by the Wegman committee reporting to the National Academy of Sciences, Michael Mann and his associates continue to claim their work was legitimate. Its omission from the 2007 IPCC Report told the real story.
While the Hockey Stick was exposed and rejected it drew attention away from a more insidious piece of ‘human signal’ evidence in the 2001 IPCC (TAR). This was the claim by P.D. Jones, Director of the Climatic Research Unit at the University of East Anglia, that the global average annual temperature increased 0.6°C ± 0.2°C in some 130 years. It was claimed the increase was beyond any natural increase with the strong implication it was caused by humans. The data is simply not adequate to make this conclusion. The first problem is the huge error factor of ± 0.2°C or 66%, which essentially makes the number meaningless. Imagine a political poll saying it was accurate plus or minus 33%. Besides, there are so many problems with the global data many consider it impossible to calculate the global temperature. Some of the problems explain why.
Bob writes:
Is it speculation that the CO2 theory of 20th century warming and the solar theory have opposite predictions for what should happen when the sun goes quiet? It is speculation to note that the sun has dropped into a period of very low activity?
Not that there is anything wrong with speculation (or theory), which generally does come before testing by evidence. But just what speculation is Bob talking about?
Perhaps my theory of how Muller manages to square CO2-alarmism with his admission that he never examined the possible causes of warming? Yes, that’s true. I am speculating that he is ignorant about the cosmic-ray-cloud theory, but this is not actually a scientific question, so perhaps I can be forgiven for simply giving a logical answer, instead of a scientific one.
I wonder what a Tisdale-kitten mash-up would look like?
At about the time Rasmus was trying to discredit the solar activity theory, James Hansen was claiming that Global Warming was “locked in for the next 50 years”. Why? Because even if CO2 levels could be stabilised immediately, the thermal lag from the oceans would ensure that the temperature continued to slowly increase.
You’d think they could have swapped notes…
I had HOPED that BEST might go back to the base data and make sure it was not subject to distortions due to urbanisation.
We know the UHI effect exists.
We know that many stations quite probably have been affected by ever increasing urbanisation, NOT just at the station site, but also in adjacent areas that may affect the temperature at that site..
We know that with the loss of a substantial number of remote rural stations, there is an ever-increasing dependance on the stations in urban areas, thus possibly skewing the data even further
.
But does BEST actually go and have a look…… NOPE !!!
Just relies on the same old data source.. That is NOT research. !!
ALWAYS CHECK YOUR SOURCE DATA FIRST !!
Back to square one, BEST !!
It is irrelevant if a hypothesis is based on speculation, in fact, all hypothesis’s are based on speculation, that is why they are still only called a hypothesis. After you make the hypothesis, you test it, that is the scientific method. We are now testing it, AGW theory says that as CO2 goes up, it will get warmer, solar theory says that as the sun gets quiet, it will get cooler. It is getting cooler according to the BEST data itself.
Your statement “little basis in science” actually means “little basis in settled science”, or science by consensus. Science is not done by consensus, it is done by making a theory, finding a way to make that theory be testable, thus making what is known as a hypothesis, which is a testable theory, testable speculation, and then testing it to see if it stays in the realm of speculation (fails the test) or moves on to the realm of actual tested science fact (passes the test).
Example, my name is Galileo. I have a speculation, I speculate that the earth goes around the sun. The settled science of the day is that the sun goes around the earth, as do the planets, riding on crystal rings. I make it a hypothesis by making one of those newfangled telescope things and actually looking, gathering data, doing an actual observation. Or, we could do it the Tisdale, way, convene an inquisition, accuse this Galileo fellow of “speculation” and not science. Question, in the end, who was proven right? Question, now, which method will you use, will you continue to use the pre scientific method way of “appeal to authority”, or the way of the scientific method, where you speculate, and then find a way to test that speculation? Are you just going to believe what “they” tell you, or are you going to dare to think new thoughts and then dare to actually observe to see if they are true? Are you going to stay a nice little sheep and go right along with the herd to be fleeced, or are you going to dare to actually think for yourself?
I must assume that either you do not understand the scientific method, and what a hypothesis is, or that you do not care, you will tear down anyone who disagrees with what you wish to believe.