
Even with the expected active 2010 North Atlantic hurricane season, which accounts on average for about 1/5 of global annual hurricane output, the rest of the global tropics has been historically quiet. The Western North Pacific this year has seen 8-Typhoons, the fewest in at least 65-years of records. Closer to the US mainland, the Eastern North Pacific off the coast of Mexico has uncorked a grand total of 7 tropical storms of which 3 became hurricanes, the fewest since at least 1970. Global, Northern Hemisphere, and Southern Hemisphere Tropical Cyclone Accumulated Energy (ACE) remain at decades-low levels. With the fantastic dearth of November and December global hurricane activity, it is also observed that the frequency of global hurricanes has continued an inexorable plunge into into a double-dip recession status. With 2010 [possibly but not probably] being the hottest year ever, we will likely see the fewest number of global tropical cyclones observed in at least three-decades…

Post by Ryan Maue: A year ago, I walked into a Tallahassee Borders and snapped an IPhone photo (that’s my thumb) of Al Gore’s new book cover and marveled at the locations of hurricanes in a globally warmed future. The book was released at the tail end of the 2009 Atlantic hurricane season, which uncorked one of the quietest years on record. With Copenhagen, Cancun, and the hottest year ever come and gone, you would think that global climate disruption was spinning up cyclones with reckless abandon. Remember, after Katrina in 2005, scientists published alarming papers linking increases in hurricane activity worldwide to global warming. Fast forward 5-years: the inconvenient truth is that aside from the Atlantic basin, global tropical cyclone or hurricane activity during 2010 has tanked to the lowest levels in decades. So what happened?
Natural variability of the climate, which is coincidentally about as poorly understood and predicted as any anthropogenic effects on it, has returned the global atmosphere-ocean system to a state that favored fewer, less intense, and shorter-duration tropical cyclones (TCs). Each year, 80 to 90 TCs form in the global tropics distributed unequally among the basins of the Pacific, Indian, and Atlantic oceans, in both hemispheres. The dominant mode of global tropical variability is the El Nino Southern Oscillation (ENSO), and it usually determines the genesis location, track, and flavor of the world’s TCs on interannual timescales of 2 to 7 years. The Pacific Decadal Oscillation (PDO) is a longer-time scale mechanism (30-years) that has been linked to a variety of climate phenomena, most notably the Great Climate Shift of 1976. A cold/warm PDO is associated with more La Ninas/El Ninos, as has been observed during the past 60-years. The global historical TC records and ENSO + PDO tell us to a large degree what to expect in a given year with respect to tropical cyclone activity. While 2010 saw a bumper crop of Atlantic storms accurately forecasted by everyone expecting a transition to La Nina (except for that sorta important US landfall #) during the current North Atlantic active period , the Pacific was historically quiet.
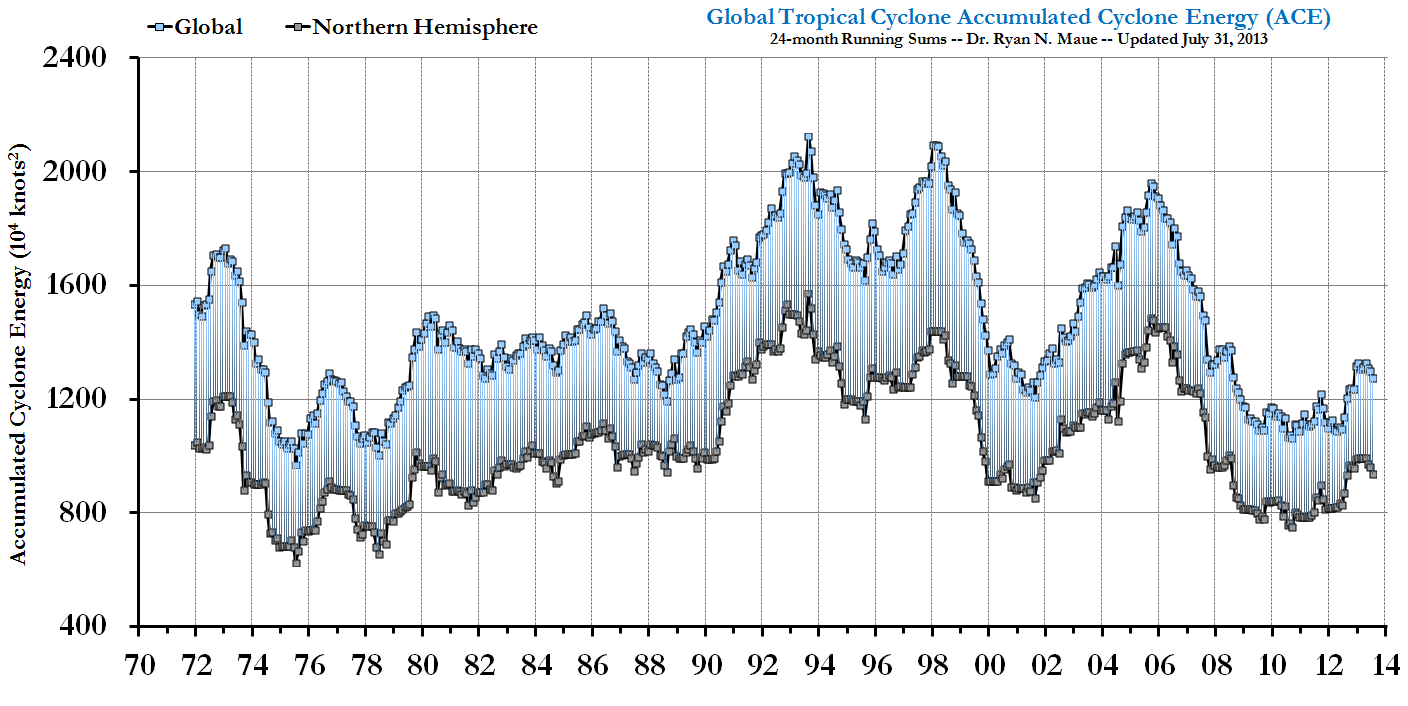
Many readers will recognize the figure above as the trace of Accumulated Cyclone Energy (ACE) which is easily calculated from the historical hurricane records. It’s apparent that considerable swings in activity have occurred during the past 40-years, which is still way-too-short of a time series to say anything meaningful about the acknowledged interdecadal climate mechanisms at play here. Regardless, global ACE during 2010 sunk to lowest levels since 1977. The fantastic dearth of November and December activity globally has pushed the tally lower, and I am beginning to wonder when/if a “recovery” will occur. Is this 5-year lull in overall global TC activity going to continue? While prognosticators are heralding an active Southern Hemisphere TC season ahead, the expected continuation of La Nina will not only continue into a bone-chilling Northern Hemisphere winter, but also depress 2011 Pacific TC activity.
Here’s a new figure that may be rather interesting:

Not only has the ACE plunged to decades lows, but now the frequency/number/count of global tropical storms and hurricanes has followed suit. So during the past few years, we have experienced fewer AND less intense AND shorter duration tropical cyclones globally all at the same time — and while the planet is experiencing the warmest year ever. Here is the 12-month running sum image. During the past 12-months, our Blue Marble has spun up 64 named tropical cyclones, the lowest number on record for any consecutive 12-month period since 1970. The previous low was October 1976-September 1977 with 67 tropical storms, during the so-called Great Climate Shift. The Southern Hemisphere would need to produce at least 25 storms during the next four months to pick that statistic out of the tank.
Bottom line: The 2010 *new* WMO consensus (Knutson et al.) on tropical cyclones and climate change is summarized on Roger Pielke Jr’s blog: “…we cannot at this time conclusively identify anthropogenic signals in past tropical cyclone data.” Thus, it is perhaps best for Al Gore to continue his Photoshop endeavors to move merchandise since Mother Nature is not cooperating.
For those interested in the raw numbers and additional information about global TC activity, my continually updated FSU webpage has plenty of fodder.
This information should be sent to all the Eco-Schools in order that it might be debated, together with other positive aspects, such as CO2 fertilization and the partial greening of the sahara etc.
I’d forgotten about Mr. Gore’s contra-rotating hurricanes…..
Thanks, Ryan. I’ve been waiting for this post.
So, the trend lines in the 24-month Running Sums graph are flat, eh? Perhaps they represent the energy balance ‘set point’ on the global thermostat.
Oh, I liked this turn of phrase, “Natural variability of the climate, which is coincidentally about as poorly understood and predicted as any anthropogenic effects on it, …” Nicely said and it’s an important point.
[ryan: the global ACE is not flat, because of the relative low point during the cold-1970s — Atlantic and Pacific were both anti-tropical cyclone]
Good article. This year has the fewest number of typhoons in the Philippines, only about 12 or less, vs. the average of 20 a year.
So warm years coïncide with low storm activity, ergo global warming -undisputed there has been a warming present since the last 17th century ice age- stabilizes climate. Just phrasing another ridiculous speculative conclusion supported by one isolated observation of a complex system, which I believe is the norm for good climate science? What is really stunning is that such enormous effort is invested in proving outrageous claims wrong.
H.R. says:
December 15, 2010 at 2:10 am
[ryan: the global ACE is not flat, because of the relative low point during the cold-1970s — Atlantic and Pacific were both anti-tropical cyclone]
Ah. I was careless (and half-awake) and was thinking ACE when the last chart is for frequency. I was referring to this line in the caption in last figure. ” The added green lines are linear trends, which serve the useful purpose of delineating the respective time-series mean, since they are flat and parallel. “ That’s frequency over time, not ACE over time. Thanks for taking the time to point out my error.
Dear Editor,
Please correct the orientation of the graphs in this piece. All should be increasing in line with CO2, so the graphs must all be upside-down. I know that this is true, as I have been told it many times and the consensus must be correct, surely?
(Oh, and you had better adjust the numbers as well.)
I love the way ACE is low during the cold ’70s, then rises nicely with warming temps into the 1998 Peak Temperature Year, then wobble downward to a new low as the world warms to “the hottest ever”.
So, warmists, you get to PICK ONE:
1) You temp data is wrong. We’re actually cooling (as ACE and snow indicate).
OR
2) All that hype about more storm damage from heating is just BOGUS.
Think carefully. Don’t rush it. I’m sure you can decide which one to keep….
Great post Dr Maue – I love to see real data well-displayed …
Al Gore too busy making ice cubes to make a coment
I assume that with satellite coverage all storms are now reported and counted but was this the case in 1977?
If not we can surely assume that the level in 1977 was understated because of storms that noone saw or reported. This means that the difference between 2010 and 1977 is even greater than appears.
[Polar orbiting satellites were common, and it is unlikely that many storms were missed globally. The intensity estimates may be more uncertain, but a bias in either direction, high or low is not apparent.]
pesadia says:
December 15, 2010 at 2:06 am
“This information should be sent to all the Eco-Schools in order that it might be debated, together with other positive aspects, such as CO2 fertilization and the partial greening of the sahara etc”.
Better send them this information:
Climate forecasts will have to be thrown in the dustbin
http://notrickszone.com/2010/12/14/little-ice-age-and-expanding-arctic-ice-coming-climate-models-will-have-to-be-thrown-in-the-dustbin/
Expecting the Pavlovian conditioned mainstream media to actually understand science may be a bit of a stretch. They prefer tempertures adjusted by fiat and photo-shopped pictures of flooded coastal cities, not objectively collected data.
I’ve got to believe that temperature differentials are more important than actual heat content. High temps don’t necessarily mean turbulence so if the atmosphere is reaching a steady state temperature wise (like the last ten years ) then it might be expected that there would be fewer major storms. Correct? So if temps start dropping (which I think they will do to what I infer is a 60 year cycle) then we should see the storms kick up again.
A Very Merry Christmas to all fellow climate realists:
http://ourmaninsichuan.wordpress.com/2010/12/15/fenbeagle-chris-the-huhnes-christmas-present/
Thanks Ryan.
It is true that one picture (real data graph) is worth a thousand “peer-reviewed” papers…
I live near the gulf coast and I am very happy with the decrease in the number of storms. But, because of the wind patterns this season, the U. S. was very lucky not to have had a large storm strike the mainland. If a couple of these had hit the east coast around the NY area I doubt that anyone would be talking about a decrease in the number of storms. I for one am keeping my fingers crossed about next year and am still kicking myself for moving here.
slightly O/T but this recently presented by our esteemed Metoffice!
http://www.metoffice.gov.uk/news/releases/archive/2010/tropical-storm-success
As there is less power from the sun (remember Ap index?) there is less power here on earth. CO2 is but a dream, or rather a nightmare (after Cancun).
AGW is being tested in the Earth laboratory. They made predictions and we see virtually no change or the opposite of what they said. How can this be in the ‘hottest’ year on the record? Sooner or later they are going to have to admit they got it wrong. The offensive word ‘denier’ will soon be attributed elswhere with good justification.
Tropical cyclone activity = zilch
Cyclone intensity = dubious
Arctic runaway amplification = after 2007 it should have gone into spiral – zilch
Pacific atolls drowning = most have stayed the same or have grown – zilch
Bangladesh drowning = Bangladesh has gained land over 30 years
We have reached the ‘tipping’ point and we will not have any more cyclones…this is on pace to match the ‘snow will be a thing of the past’….
/sarc off (just in case)…
And all this has happened since Al Gore put a Hurricane on his book cover…Correlation or causation?
Citing 2010 as “warmest year ever,” even in potentiam, parrots Goebbelian propagandists such as GISS/NASA’s Jim “Big Stick” Hansen, ranting ideologues without a grain of common sense, integrity, or even scientific credibility from c. 1996 if not before. For decades now, Hansen and his fellow Luddite sociopaths such as Paul Ehrlich, John Holdren, Keith Farnish, have actively sabotaged global coal, oil, nuclear energy economies in bad faith, under false pretenses. Such “1010” types hate humanity, hate industrial/technological civilization, and they want you dead.
Too bad Wunderground.com would quite likely take this link out of their blog (specifically Dr. Jeff Masters), I’d love to see their take on this…
[ryan: Dr. Masters has an agenda for sure, but he has mentioned the global ACE in his blog before, and, I’m sure if it can be squared with his alarmist rhetoric, then it will be featured again.]
Interesting that NH ACE is consistently about three times that of SH ACE.
There are two things that stand out as major differences between the northern and southern hemispheres. The south pole is covered by a continent and the southern hemisphere has less total land mass.
Are those differences responsible and if so how?
Anyone? Bueller? Anyone?