Global Tropical Cyclone activity is at 33-year lows

Dr. Ryan N. Maue’s 2010 Global Tropical Cyclone Activity Update

Update to include Rush Limbaugh’s discussion on his radio show of this posting …

With the 2010 North Atlantic hurricane season winding down without a United States hurricane landfall, Drudge posted a headline suggesting that the seasonal hurricane forecasters blew it. Indeed, he has written this headline for 4-years in a row now by linking to my Florida State University website.  While the number of storms has been accurately predicted by the soothsayers (including Rush Limbaugh), the lack of impact upon the US mainland has left many wondering:  is this it?

While the North Atlantic sees ~10 storms per year, the annual global total is 80 to 90!  So, how is the rest of the globe doing in terms of tropical cyclone (TC) activity?  Absolutely cratering — and in in the Western North Pacific typhoon basin, at historical lows.  Indeed, with the Earth undergoing Global Climate Disruption, natural climate variability has played the ultimate trump card and left global TC activity at 33-year lows!


Ryan


From my FSU website:

Update:

Current Year-to-Date analysis of Northern Hemisphere and Global Tropical Cyclone Accumulated Cyclone Energy (ACE) AND Power Dissipation Index (PDI) has fallen even further than during the previous 3-years. The global activity is at 33-year lows and at a historical record low where Typhoons form in the Western Pacific.

While the North Atlantic has seen 15 tropical storms / hurricanes of various intensity and duration, the Pacific basin as a whole is at historical lows! In the Western North Pacific stretching from Guam to Japan and the Philippines and China, the current ACE value of 48 is the lowest seen since reliable records became available (1945) and is 78% below normal*. The next lowest was an ACE of 78 in 1998.  The Northern Hemisphere overall (including the North Atlantic) has the lowest ACE since 1977, the year of the Great Climate Shift and flip in the phase of the Pacific Decadal Oscillation.

See figure below for visual evidence of the past 40-years of tropical cyclone activity.


Figure: Year-to-Date (October 7) Accumulated Cyclone Energy (ACE; units: 10^4 knots^2) for the Northern Hemisphere as a whole (top blue time series) and for the combination of the Western North Pacific (WPAC), Eastern Northe Pacific (EPAC), and Northern Indian (NIO) basins (bottom gray time series). The difference between the two lines is therefore the contribution of the North Atlantic hurricane basin. Similar figure for Power Dissipation Index (units: 10^6 knots^3)


…And global tropical cyclone during the past 33-years (Southern Hemisphere cyclone data gets progressively spotty prior to the routine monitoring of the global oceans by geostationary satellites):


Figure: Global and Northern Hemisphere Accumulated Cyclone Energy: 24 month running sum through September 30, 2010. Note that the year indicated represents the value of ACE through the previous 24-months for the Northern Hemisphere (bottom line/gray boxes) and the entire global (top line/light blue boxes). The area in between represents the Southern Hemisphere total ACE.


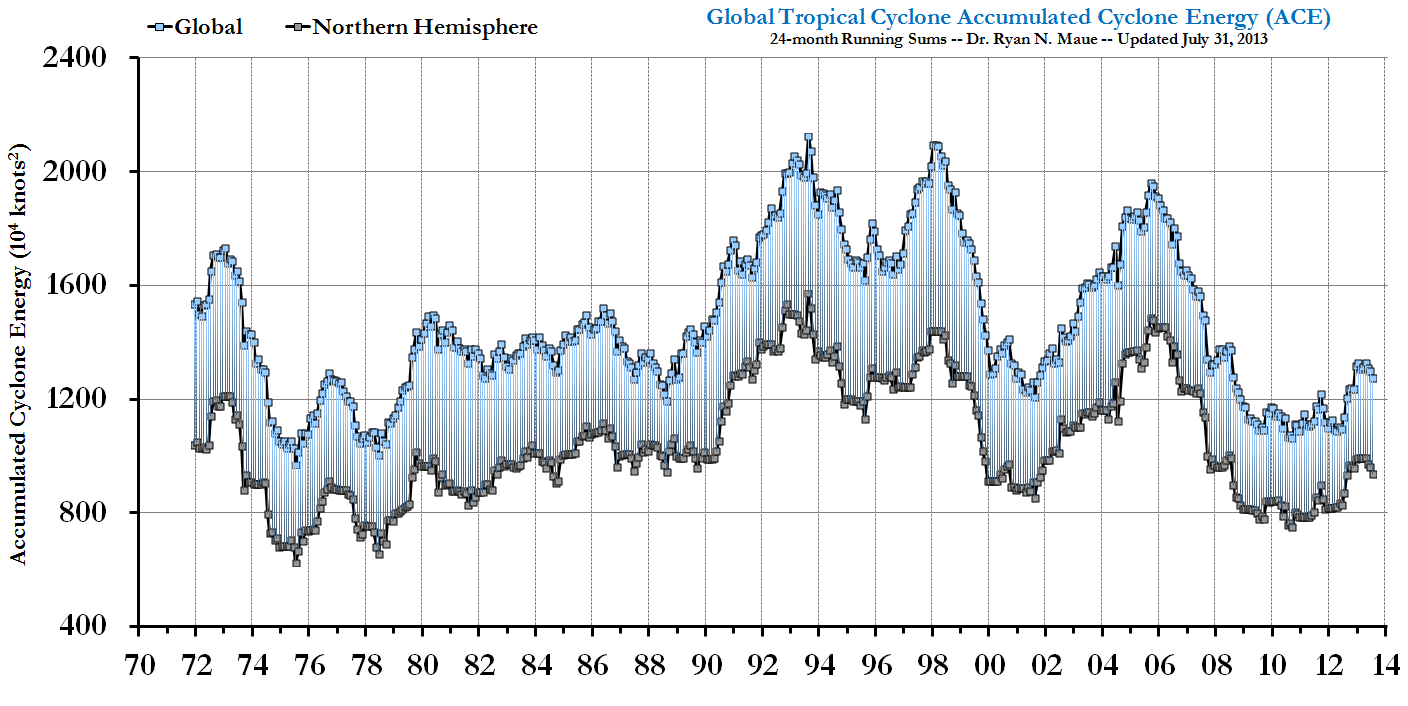
Global TC Activity remains at 33-year lows. — The last 24-months of ACE at 1090 represents a decrease from the previous months and a return to the levels of September 2009…Since Hurricane Katrina (August 2005) and the publication of high-profile papers in Nature and Science, global tropical cyclone ACE has collapsed in half. This continues the now 4-consecutive years global crash in tropical cyclone activity. While the Atlantic on average makes up about 10% of the global, yearly hurricane activity, the other 90% deserves attention and has been significantly depressed since 2007.

Atlantic Hurricane Season of 2010

Otto will soon be undergoing extratropical transition and succumb to the vertical shear which becomes progressively more hostile to hurricane activity in the Atlantic as the season wanes.  The number of storms ranks fairly highly in terms of the historical record — even with the paltry contributions by Bonnie, Gaston, and Nicole.  The ACE to date (October 8 00:00) is 137, which ranks 2010 as the 16th highest since 1950 just behind 2008.  Sorted List

Here is the yearly ACE total figure for the past 61-seasons (note:  no trend)


North Atlantic Accumulated Cyclone Energy based upon the HURDAT best-track archives.


While there are some qualms about the wind speeds prior to the satellite era, it’s clear that some sort of multi-decadal signal is present (i.e. AMO).  If some weak, short-lived storms were missed, then so what, their ACE contribution is inconsequential.  How does this ACE compare to the seasonal forecasts of NOAA, Gray and Klotzbach, and the UK MetOffice?  Not quite there yet.


2010 ACE to date (October 7), expected daily values based upon the 1950-2009 historical records, and various forecasting outfits' prognostications


How skillful or useful are these ACE forecasts?  Well, just based upon the knowledge of a La Nina summer/fall, one would calculate an average ACE of 116 compared to an El Nino average ACE of 68 by simply looking at the Multivariate ENSO Index and the hurricane records from 1950-2009.  Add in knowledge of the so-called North Atlantic active period beginning ~1995 and one could come up with this number rather painlessly.

[La Nina years:  1950, 1954-6, 1962, 1964, 1967, 1970-1, 1973-5, 1988, 1998-9, 2007-8 and El Nino years:  1951, 1957, 1963, 1965, 1972, 1976-7, 1979, 1982-3, 1986-7, 1991-4, 1997, 2002, 2004, 2006, 2009]

Flashback to October 2007: I posted on Steve McIntyre’s Climate Audit the following:


The North Atlantic was not the only ocean seeing quiet tropical cyclone activity. When using the ACE cyclone energy scale, the Northern Hemisphere as a whole is historically inactive. How inactive? One has to go back to 1977 to find lower levels. Even more astounding, 2007 will be the 4th slowest year in the past half-century (since 1958).

The 2007 Atlantic Hurricane season did not meet the hyperactive expectations of the storm pontificators. This is good news, just like it was last year. With the breathless media coverage prior to the 2006 and 2007 seasons predicting catastrophic swarms of hurricanes potentially enhanced by global warming a la Katrina, there is currently plenty of twisting in the wind to explain away the hyperbolic projections. The predominant refrain mentions something about “being lucky” and having “escaped” the storms, and “just wait for next year”.

And suggested we “Bring out the Broom on the 2007 Season“:

With October nearly done circling the drain, I figure it is about time to bring out the broom: Northern Hemisphere tropical cyclone activity is at historically low levels .

In fact, September 2007 suffered the lowest ACE since 1977 ! Even scarier, so far 2006 and 2007 have the lowest October ACE since 1976 and 1977. And, unnaturally, Sept-Oct 2007 is the lowest since 1977.

Yet, the tropical cyclone season was not shaping up to be such a ghastly bust. For about a week in June, NH ACE was exceeding climatology but then bit the proverbial dust until mid-August when a noticeable comeback ensued. It has been downhill since.

Here’s the Drudge Report screen cap as a refresher of the other news going on (with Hillary Clinton picture goodness):  Forecasters Blow It, Again:  ’07 Hurricane Season may rank as most ‘inactive’ in 30 years


Drudge Report Screen Cap October 2007


And, just for fun, additional screen caps from 2008 and 2009.  Indeed, Matt Drudge mixes up the overall global inactivity with the North Atlantic basin alone.  Regardless, the story is now the same for 4-years in a row:  North Atlantic hurricane forecasts hopelessly overblown against a backdrop of plummeting global tropical cyclone activity overall.

So, I guess it is appropriate to begin the 2011 Atlantic season predictions.  I leave it to Rush Limbaugh, who on Thursday’s program uncorked his highly accurate scheme with help from Roy Spencer:  between 0 and 40 storms.

RUSH ARCHIVE:  I’ll make a prediction.  There will be between zero and 40 storms this year, there will be between zero and 40 to become hurricanes, between zero and 40 that become major hurricanes, and between zero and 40 that impact the United States Gulf or East Coasts, and between zero and 40 who wipe out a city. There you have it.  My prediction is going to be more accurate than anybody else’s.  You wait and see.

RUSH:  That’s my prediction for the 2011 hurricane season. The first out, by the way, with my prediction, and probably a prediction made with more confidence than anybody else’s prediction, which won’t come until next spring.  Again, another shining example of being on the cutting edge.  You learn about everything here first.

0 0 votes
Article Rating
73 Comments
Oldest
Newest Most Voted
Inline Feedbacks
View all comments
Northern Exposure
October 8, 2010 1:36 am

Oh, don’t worry… there’ll be an explanation for this from the ‘see-oh-too’ crowd.
Somewhere, somehow, someone said at some point that there would be less storms as global climate disruption grows.
*cough cough*

crosspatch
October 8, 2010 1:43 am

Heh, I actually happened to be listening when he made the initial forecast for this year and that is quite odd because I probably listen to him for about 15 minutes a month and often that 15 minutes is commercials ( I listen when driving and not often driving during his timeslot).
I had to seriously snicker when I heard it, too, and thought to myself “gee, I wonder if Mr. Watts is catching this one”.
I did notice this year many more days than usual when there was absolutely no tropical storm activity anywhere on the planet and wondered if maybe some analog to the sunspot number could be made. Like the number of tropical storms with a number assignment made based on strength. So maybe an invest low would be a 1, a tropical depression could be a 5, a tropical storm a 10, a cat 1 is a 20, cat 2 is a 30, etc. And you add up all those numbers for all the storms on the planet that day and arrive at an “earthspot” number. It might be interesting to see how a number like that graphs against other things.

Tenuc
October 8, 2010 1:44 am

It ain’t over ’till the fat lady sings! 2010 could still have some surprises in store.
Until we have a better understanding about all the mechanisms and their relationships, only a Rush Limbaugh 0-40 has real meaning. Something big is missing from our knowledge about storms.

October 8, 2010 1:50 am

I am still processing data Ryan was so good to point me toward, some of my assumptions were not valid, by spring I should have a much better idea of how next year will be going, [other than “just slower than this year did”.] We shall see next year, meanwhile I still have lots of crow in the freezer to last till then.
Will post updates as I get finished results to base further ideas upon.

Golf Charley
October 8, 2010 2:04 am

It is great to note how global warming is having such a beneficial affect on reducing destructive weather, as predicted so accurately by the IPCC.
Clearly everything stated by the IPCC is factually correct
High fives, or should that be 10:10’s all round

Latimer Alder
October 8, 2010 2:08 am

The observations are clearly incorrect. The models have spoken and the intensity and frequency of cyclones must be increasing.
It must be time to remove this version of nature and replace it with one that works the way we would like it to.
Thanks
Canute (Knut)…by the sea…..England

orkneygal
October 8, 2010 2:41 am

Who is Rush Limbaugh and why does anyone care?

morgo
October 8, 2010 3:14 am

Tenuc don,t be a sucker the fat lady has stopped singing

October 8, 2010 3:16 am

It is interesting to note that, even though this has been a ‘La Nina’ season with supposed low wind shear that goes along with that, there has still been quite a bit of shear which prevented some systems from forming & held down alot of those which did manage to get organized. If I recall correctly, the early season systems were sheared by SubTropical jet-oriented shear & later storms by shear from a southward displaced Polar jet which also helped recurve many storms northward while out in the Atlantic (weak Bermuda High).
Jeff

Bernie McCune
October 8, 2010 3:24 am

If you had another 30 years of data you could easily see a trend in the North Atlantic ACE 61 Season plot. Since that trend is approximately 60 seasons long it is not as easy to see. And the near term trend (next 10 to 20 years) seems to be downward. It is very chaotic over the short term, but of course that is called weather.

FerdinandAkin
October 8, 2010 3:26 am

Just a casual engineering observation of data like the decline in the ACE, I would say the Earth is conserving its heat energy.
Could this be a mechanism where the climatic systems are maintaining stable surface temperature in the face of a cooling trend?

truthsword
October 8, 2010 3:48 am

Why does everyone keep saying the average number of named storms is 10 when it is 14? Do they do the average between 1979 and 1998 or something?

Colin Aldridge
October 8, 2010 3:53 am

As I understand it cyclones/hurricanes significantly cool sea surface temperature. Is a historic low ACE number a big enough effect to significantly increase sea surface temperature or more accuartely create a positive sea surface temperature anomaly? “Lack of Hurricanes contribute to global warming… its worse/ better than we thought”?

DJ Meredith
October 8, 2010 4:03 am

Gloom and doom hurricane predictions may be good fodder for scientific debate, but they’re great for insurance companie’s profit margins. More hurricane alarm equals higher premiums equals higher profits. Just ask the folks in Florida about insurance.
Just ask me about how nicely my AIG stock is doing.

Geoff
October 8, 2010 4:07 am

This is a perfect example why the term “climate disruption” is approporiate.
Climate predictions can be easily disrupted by the changing climate.

Joe Lalonde
October 8, 2010 4:12 am

JoNova is doing a blog on the ARGO not co-operating in giving out it’s data for ocean data.
I guess colder oceans mean less energy stored.

Leon Brozyna
October 8, 2010 4:35 am

As can be seen here:
http://www.weatherstreet.com/hurricane/2010/Hurricane-Atlantic-2010.htm
the average number (1944-2005) of named North Atlantic storms is ~10, exactly as Ryan wrote above.

October 8, 2010 4:37 am

The NA ACE looks much like AMO index, or SST record.
http://i51.tinypic.com/k8epd.jpg
While it looks that warmer Atlantic means more cyclone energy, recent record warm Atlantic did not produce anything special. Recent drop either means that NA is cooling (true) and if we insist it is warming as per models, then there is no relation between ACE and SST.

Robert
October 8, 2010 4:40 am

hmmm, i thought that increased CO2 would yield to increased temps would yield to increased tropical activity…so now we are at a 33 year low. just one more thing, in a long list, that global warming adovcates preach about and hasn’t happened(in fact the opposite of what they preached is true)

October 8, 2010 4:48 am

Wonder if the current local minimum implies that we have another phase-flip in the works, maybe a return to the pre-1976 pattern?

Editor
October 8, 2010 4:51 am

RUSH: That’s my prediction for the 2011 hurricane season. The first out, by the way, with my prediction, and probably a prediction made with more confidence than anybody else’s prediction, which won’t come until next spring.

I believe Klotzbach and Gray will have a first prediction in December. I generally don’t remember it by April when ENSO and other predictors are beginning to firm up.
Two other notes:
1) I’m not pedantic about it, but please consider changing future versions of your first graph to start the Y axis at 0.
2) Someone’s got to put vampire teeth on that photo of Hillary.

Patrick Davis
October 8, 2010 4:57 am

“Robert says:
October 8, 2010 at 4:40 am”
I believe all those “predictions” about worcening storms with increased C02 concentrations were all based on GCM’s.

ShrNfr
October 8, 2010 4:59 am

I seem to remember an article published about a new paper in some weblog devoted to real science and not the tooth fairy that the low UV this year would result in not a lot of hurricanes in the Gulf. http://wattsupwiththat.com/2010/05/05/new-paper-tropical-cyclone-response-to-solar-uv/ Looks like the model has not been refuted by mother nature. On the other hand the model that says more CO2 makes more hurricanes seems to have been refuted in a rather resounding fashion.

hunter
October 8, 2010 5:14 am

This is, of course, as predicted by AGW theory.

October 8, 2010 5:20 am

Joe Lalonde says: “JoNova is doing a blog on the ARGO not co-operating in giving out it’s data for ocean data.”
The author of that post apparently missed the fact that, until July of this year, monthly updates of ARGO data had been publicly available through the “Global Marine Argo Atlas” webpage:
http://www.argo.ucsd.edu/Marine_Atlas.html
They’ve even provided software that allows users to process the data.

LearDog
October 8, 2010 5:34 am

Dr Maue –
Great post – thanks v much! But I believe your credibility as a technical arbiter is taken down a few notches with interspersed references to Drudge and Limbaugh. I’d leave the politics out of it – fun for you perhaps, but your technical message might get caught up in “friendly fire”.
Thanks again ….
[ryanm: since I don’t have ready access to the Washington Post op-ed pages e.g. Dr. Mann, I am appreciative of anyone that wishes to disseminate this excellent science news, rather than doom-and-gloom alarmism]

October 8, 2010 5:37 am

Fools. Everyone knows that global warming makes the weather less predictable. Therefore, every failed prediction proves that global warming is happening. The more inaccurate the predictions from NOAA and the Met Office, the more we can be confident in the theory of global warming. Wake up people!!!
🙂

Bill H
October 8, 2010 6:12 am

as the polar jet increases in size due to the current cooling trend and the equatorial (tropical) jet reduces in size due to the offsetting wind shear it is no surprise the TC is low. the storms do not get enough energy to grow before being ripped apart.
anyone with flying experience knows this…

Bill H
October 8, 2010 6:17 am

as for proving AGW… Nope.. the pattern is easily observed and repeated. a cooling planet is not a wonderful thing. people starve.. but keep burring your heads in the sand and ignore that which is occurring. i understand it doesn’t meet with the warmers mantra.

TonyBerry
October 8, 2010 6:31 am

I was wondering what had happened to all that hand wringing and Killer storms!

truthsword
October 8, 2010 6:50 am

As per average number of named storms, officials have changed the rules to name subtropical storms in 2002 (they get names from regular tropical storm list since)… to get a fair average you must go back and include subtropical storms, as well, back when they recieved numbers or their own names from a seperate list. Oh wait, I bet anyone swallowing the average of “10” never thought about that eh? Really. The average is 14.

Pascvaks
October 8, 2010 6:59 am

Dr Maue
In your work have you come across an indicator that the North Atlantic and North Western Pacific hurricane season not only vary in scale but also vary in storm ‘tracks’ over time? IOW, that the tracks vary from the West and gradualy work their way East over the years, and then move back to the East years later.?
For example, between the years x-x’, the tracks in the Atlantic tend to move primarily in the Gulf; betweey y-y’ they tend to move up Florida’s East Coast; between z-z’ they tend to remain offshore and move up more in the central Atlantic?
Hope you understand what I’m asking;-)

truthsword
October 8, 2010 7:03 am

Or, for averaging named storms after the name change (2002-2009), the only other fair thing to do, you would get an average of 15.

kim
October 8, 2010 7:11 am

When I first ran across RyanM’s graph of ACE about 18 mos ago I used it as a hand around at a believers’ book discussion group, and later asked Chris Mooney when he was going to write ‘Calm World’.
==================
[ryanm: Mooney is too busy with his liberal causes.]

Matt
October 8, 2010 7:12 am

Another take on this. The reason we have cyclones/ hurricanes is due to the energy imbalance created between the warm tropics and the cold polar regions. If there is a decrease in energy differential, then there will be a decrease in the storms necessary to correct this imbalance.
For there to be a decrease in the energy imbalance, then either the “warm” tropics are less warm, the polar regions are less cold, or the transfer mechanism has become disrupted and the energy imbalance is continuing to build at each extreme.
Is my reasoning sound here? Anyone?

kim
October 8, 2010 7:13 am

Two other old gags of mine are asking the same author when he is going to write ‘The Democrats’ War on Science’ and asking David B. Benson when Spencer Weart is going to write ‘The Discovery of Global Cooling’.
===============

Richard Sharpe
October 8, 2010 7:22 am

So, the truth is that the warming is in the pipeline, but all the CO2 that humans have released has clogged up the pipeline. This means that the pressure in the pipeline is building up and one day it will explode. If you don’t send more money so we can investigate the clogging of the environmental pipeline, you’ll be sorry!
Also, we are renaming it: Anthropogenic Climate Disruption, or ACD.
We are also investigating the capacity of cultures for climate disruption. This we are calling Anthropogenic Climate Disruption Capacity, or ACDC.
Soon, we will come out with a paper titled: Back in Black, The role of CO2 in ACDC.

October 8, 2010 7:24 am

It was a balmy 63 degrees at about 90 miles north of Key West this AM … Water temp mid 70s.
We aren’t complaining, but you would think the weathermen are going to have their heads blow off from blowing on every cloud puff that shows up on the satellites … They have gone way past absurd.

Canadian Mike
October 8, 2010 7:51 am

No doubt the lack of hurricane activity is just as much proof of AGW as greater than average hurricane activity would have been. Gotta love these non-falsifiable scientific theories. Heads I win, tails you lose, let’s increase taxes.

Jon
October 8, 2010 7:52 am

If hurricanes are heat pipes that help regulate global temperature by transporting heat from the surface up into the atmosphere, does a decrease in the number of hurricanes this season mean we should expect increased surface temperatures next season?

Dave
October 8, 2010 7:53 am

I predict reversion to the mean will occur at some point. You read it here first.

Vince Causey
October 8, 2010 7:56 am

If the tropical cyclone activity has fallen to an unprecedented low, that itself is a climate change disruption.

JPeden
October 8, 2010 7:58 am

The global activity is at 33-year lows and at a historical record low where Typhoons form in the Western Pacific.
I’ve found that often the truth is the exact opposite of what the Post Normal Scientists and other Progressives say. This “proves” it! Well, at least according to their logic. “Fossil fuel CO2 quells Cyclones! We’ll never die!” – no charge for this one, but my scientists stand ready…

Ben D.
October 8, 2010 8:01 am

In all fairness, since temperatures have not gone up in the last five years, their prediction of more hurricanes with global warming is not really disproved, but the entire theory of global warming since its not warming in last 5 years…now that is different (-:
Seasonal variation or normal variation…I think we will find out in the next couple of years. The way they are trumpeting the warmth of an el nino year makes me think they see the fat lady winding up.

Stephen Wilde
October 8, 2010 8:16 am

“FerdinandAkin says:
October 8, 2010 at 3:26 am
Just a casual engineering observation of data like the decline in the ACE, I would say the Earth is conserving its heat energy.
Could this be a mechanism where the climatic systems are maintaining stable surface temperature in the face of a cooling trend?”
Hi Ferdinand, it sounds suspiciously like you would support me and Joanna Haigh in accepting a reversal of the sign of the solar effect on the stratosphere.
As I said in an earlier thread the quiet sun has sent the polar oscillations way negative to send the jets equatorward. That reduces the spread of the tropical storm regions and gives the storms less space to develop. Even when they do develop they get diverted poleward more quickly and neutered by drier air aloft. Normally that drier air would have been more poleward giving the storms a longer developmental track.
The net effect is indeed to ‘conserve’ energy during the ocean induced cooling spell that we are entering because the quiet sun is resulting in a warmer stratosphere which puts a lid on upward energy transfer from the troposphere by intensifying the inversion at the tropopause.
The real cooling scenario would be negative oceans denying energy to the air at the same time as a more active sun accelerates energy spaceward.
That doesn’t seem to have happened during recorded history so I conclude that coincidentally the solar and oceanic cycles are currently mostly offsetting one another for a relatively stable interglacial climate.
There are short term exceptions but not for long enough to have a serious impact.

lOKKI
October 8, 2010 8:17 am

Hurricane activity down, despite the impact of manmade CO2 on the atmosphere? Disproves the AGW theory? Hah! You all are so naive, believing that the science matters to the AGW crowd.
I can tell you exactly what their story will be, and its so obvious, that you’ll be ashamed that you didn’t predict it yourself.
They’re going to say (and I don’t believe this by the way) that the global economic downturn has caused a decrease in CO2 and therefore a slowing in climate change.
Therefore the lack of hurricanes proves they’re right.
See? Isn’t that obvious? Sad, yes, but it makes a great soundbite.

RR Kampen
October 8, 2010 8:24 am

A little is added as TS Otto just achieved minimal hurricane status. But global activity is remarkably low. The Niña pattern would drop Pacific activity, but not per se to record low levels. Surprising.

Jimbo
October 8, 2010 8:24 am

Tenuc says:
October 8, 2010 at 1:44 am
It ain’t over ’till the fat lady sings! 2010 could still have some surprises in store.

But it’s the hottest ‘year’ on the record. :o)

October 8, 2010 8:26 am

Time to ask the “Prophet” of the Gaia believers what´s in his brand new PPS. All his predictions failed, so it must have been quite a challenge for his assistants to build up some credible scaring scenarios. His energy bills and his carbon footprint keeps on increasing with no income at sight, Chicago carbon exchange broke, no good prospects unless he is funded by stimulous money.
Really, water levels surrounding him are rising.

October 8, 2010 8:31 am

It seems that “Climate Disruption” will be disrupted too. Bad luck guys!, better take your surfboards and go to the beach; though now you are too old for that….anyway some mexican pot will make it more endurable.

Tommy
October 8, 2010 8:55 am

The global storm system is down for maintenance.
We apologize for the climate disruption.
— Thor’s technical service team

[ryanm: it’s a travesty we can’t find those missing cyclones]

Eric Anderson
October 8, 2010 9:02 am

Sheesh, talk about blowing my stereotype . . .
Ryan Maue puts out some of the most careful cyclone information of anyone, and I had imagined an old, skinny nerd in a lab coat, but now it turns he is a young dude and a surfer who has obviously spent a fair amount of time in the weight room (or perhaps with P90X?).
I seem to recall one of the Team members was hoping to get Watts or McIntyre into a back alley so they could beat them up. I doubt they would ever say the same about Dr. Maue — I’m guessing he could take them. 🙂
[ryanm: Eric, I lift weights and play basketball. Tho, I am not as dedicated as Joe Bastardi, who has competed and won amateur bodybuilding contests. Please, don’t sell Steve McIntyre short in the sports department. He is an accomplished squash player. ]

Gary Hladik
October 8, 2010 9:27 am

Ben D. says (October 8, 2010 at 8:01 am): “In all fairness, since temperatures have not gone up in the last five years, their prediction of more hurricanes with global warming is not really disproved…”
Except that 2010 is supposed to be “The hottest year EVAH!!!”
(sigh) It’s a wonder the CAGW true believers’ heads don’t explode.

Fred
October 8, 2010 9:34 am

Well this research is obviously flawed and just wrong.
Al Gore and the rest of the Warmistas told us that Hurricanes would get bigger and more happen more often.
And Al & his Warmistas are sooooooooo smart and have always been 100% correct in their predictions that we just have to believe them.
So who you gonna believe?

kim
October 8, 2010 9:55 am

I need a new grid–StormBusters.
==============

Editor
October 8, 2010 10:50 am

Ryan, you really gotta get with the program. Everyone knows that global warming is going to result in more and fiercer storms.

Bill H
October 8, 2010 11:48 am

Matt says:
October 8, 2010 at 7:12 am
Another take on this. The reason we have cyclones/ hurricanes is due to the energy imbalance created between the warm tropics and the cold polar regions. If there is a decrease in energy differential, then there will be a decrease in the storms necessary to correct this imbalance.
For there to be a decrease in the energy imbalance, then either the “warm” tropics are less warm, the polar regions are less cold, or the transfer mechanism has become disrupted and the energy imbalance is continuing to build at each extreme.
Is my reasoning sound here? Anyone?
>>>>>>>>>>>>>>>>>>>>>>>>>>>>>>>>>>>>>>
You are pretty close to it..
Solar output (secondary- solar wind, magnetism) affect the system more than many admit. were at a very low state in these areas which allows cooling in high latitudes (thinness of the atmosphere allows heat escape). this increases the heat imbalance that the world systems must try to equalize.
this is why the polar jet has tripled in size while the wind shear on the tropical jet reduces the flow causing it to slow and decrease in size. Tropical Cyclones are significantly reduced due to wind shear. they form but before they can gain size and power the polar jet tears them apart.
Cooling surface temps also play a roll. but you gat a good grasp.

mike sphar
October 8, 2010 11:54 am

2010 has been the year of the named storms wimps, but I remember several days and nights waiting for Igor to quit moving in my direction and it was an intense several days.

Tenuc
October 8, 2010 12:54 pm

Stephen Wilde says:
October 8, 2010 at 8:16 am
“…The real cooling scenario would be negative oceans denying energy to the air at the same time as a more active sun accelerates energy spaceward.
That doesn’t seem to have happened during recorded history so I conclude that coincidentally the solar and oceanic cycles are currently mostly offsetting one another for a relatively stable interglacial climate…”

I think your right, Steve. Climate behaves like a driven penulum with the sun providing the energy, the oceans providing the buffering and the atmosphere providing a variable transport system/sun parasol.
“…There are short term exceptions, but not for long enough to have a serious impact.”
Agreed, normally the systems do work together to produce the pleasantly warm interglacial climate we are enjoying at the moment, but because of the deterministic chaos inherent in the system they occasionally fail to provide enough correction and a rapid slide towards the cold-phase climate attractor ensues.
Should the current low levels of solar activity continue for another couple of decades, then I start worrying that things are going to get very serious.

Olen
October 8, 2010 12:58 pm

In the late 1940 or early 1950s, I am not sure, central Illinois was hit by cyclones over several years. And then it stopped. There was not one claim in our small town that anyone in the town had caused the cyclones. However, if they had thought of it any self respecting Illinois politician would have figured out a way to tax. They can’t tax past events, can they.

GregorL
October 8, 2010 1:10 pm

Back in 1995-96, I was a graduate student at FSU, and published (as lead author) a paper in the 1997 Monthly Weather Review that sought to identify the likelihood of LANDFALL of tropical cyclones within a particular zone. While I now consider the statistics and methods that I used to be a bit naive (more on that below), the point that I did make in that paper still stands – seasonal tropical cyclone forecasts have little value if they relate poorly to actual landfall probabilities.
Why do I consider the statistics and methods I used naive? There is no teacher quite like experience, especially when my livelihood depends upon having to be right. When I left the meteorological world early in 2000 to go into finance, it was not long until I felt completely unprepared for my new vocation, as forecasting in finance proved to be brutal. For starters, even when the models are correct, the signal-to-noise ratio is close to parity. Moreover, being correct in forecasting can eventually change the behavior of the forecasted markets enough to cause the original models to cease being correct.
What I came to later realize is that with one exception, I was more prepared than what I had first thought when I made the switch to the finance world. While doing statistical (or dynamical) forecasting in the meteorological/climate world has a different set of problems, they are nevertheless comparable in difficulty: chaotic behavior, poorly sampled data with short run histories, incompletely understood physics, and at time poor signal-to-noise ratios. I was thus comfortable with facing challenging mathematical modeling.
So what was I not prepared for? Pressure to be right. With the exception of short-range weather forecasting, the meteorological/climate world lacks a very important mechanism to improve forecasting – immediate feedback/accountability as to whether or not forecasting methodology is correct. An obvious example of this is the complete lack of attention given to how poorly past warming projections have performed going forward. As another example, and on a more personal level, I don’t know how well the forecasts from our 1997 publication have done – that should be inexcusable, especially for those supported by public funding.
If I ever got a chance, I would one day like to write a guest post for WUWT discussing a closely related issue, namely, that essentially the entire problem of suspect/poor science underlying much of AGW research is a result of wrong incentives. The current incentives strongly reward alarmism in that it has often equaled future funding. Imagine how quickly modeling would be refined and changed if instead future funding/rewards/penalties depended upon being right.

Chuck
October 8, 2010 1:29 pm

Moby Dick kept the storms out at sea, less a few that hit Mexico and southern Texas.
Didn’t seem to have too much fortitude.
Appreciate the rain though.
So Rush is now the authority on hurricane seasons.
I must have missed that show.

Jimash
October 8, 2010 1:45 pm

well.. and extreme low is still an extreme eh ?
They can never be wrong.

jakers
October 8, 2010 2:25 pm

“Regardless, the story is now the same for 4-years in a row: North Atlantic hurricane forecasts hopelessly overblown ”
Wait… # of named storms is within NOAA’s range, and the ACE is just barely below. So, ?
BTW, too bad you brought all the politics into it.
[ryanm: landfalls = 0, ACE way too high. Forecasts failed in 2006, 2007, 2008, and 2009 … Politics — too bad?]

frederik wisse
October 8, 2010 2:54 pm

Zero was the number of hurricanes going ashore in the united states up to now . Zero was my forecast of hurricanes hitting th united states as i stated in a couple of blogs a few months ago . What were the numbers forecasted by the socalled professionals ?
What is the difference between them and me ? I am living a life totally without fear and i am trying to evade all prejudism . Just take a close look at what is happening and be prepared to watch reality unfold . What was reality ? In the midatlantic already from the beginning of 2010 sea surface temperatures were falling and this could be verified day in day out by taking a close look at the reporting . Also the african heat was pushed far more in the direction of russia than into the atlantic ocean . Any non prejudiced observer could notice this . Well what does it mean declaring 2010 the hottest year on record long before the year is over ? Total prejudism !!!
These people are creating fear and are living in fear . Some of them are so strong believers that they will commit suicide because the situation is so hopeless , something a famous very sensible dutch actor did a couple of days ago . What a poor life and what poverty are they trying to spread in our society . Stop giving these fools any money and we may experience more happiness and wealth and is not this all we are looking for ?

sky
October 8, 2010 4:32 pm

GregorL says:
October 8, 2010 at 1:10 pm
“…the meteorological/climate world lacks a very important mechanism to improve forecasting – immediate feedback/accountability as to whether or not forecasting methodology is correct. ”
How very true, especially in the hubris-afflicted academic milieu. I have proposed earlier on WUWT that failed public predictions should incur penalties in pay and prospects for tenure. Chance of that happening–less than that of a hurricane crossing the equator in January.
[ryanm: crossing the equator, no — but forming very close to it — with twin cyclones on both sides — yes: see Typhoon Vamei: link]

Henry chance
October 8, 2010 7:00 pm

Rush forecasted the Obama economy much more specifically and accurately than the forecasts conjured up by the top soothsayers from the royal Palace. Why do they pay economists to be so wrong?
[ryanm: the same academics and technocrats who try economic central planning also want to do ecological central planning. Perhaps they could follow the old Soviet model and employ 5-year plans?]

Eric Anderson
October 8, 2010 7:15 pm

Dr. Maue, FWIW, one of the things I very much appreciate about most of your posts is the lack of non-scientific content or jabs at the warmists — you typically show an objectivity that demonstrates you are above the fray, and with that comes added trust. I can’t fault you for wanting to get in a few licks, but I agree with some of the other commenters that we see plenty of battling back and forth on other threads and other sites, and there may be refreshing value in your position in remaining cooly scientific.
Again, just a suggestion, FWIW . . .
[ryanm: thanks for the suggestions. as a graduate student, i had to focus completely on research obviously to get my dissertation finished. I am not about policy advocacy as many alarmist climate scientists have clearly adopted as their raison d’etre. On the other hand, I am very aware of how the political winds blow and believe that ALL viewpoints should be embraced in the arena of ideas — where the correct and best science will/should win out. There is a considerable appetite for reporting and analysis of science and its associated politics that does not always conform to the typical, tired, liberal orthodoxy infecting our current media.]

H.R.
October 8, 2010 7:31 pm

Robert Graham says:
October 8, 2010 at 5:37 am
“Fools. Everyone knows that global warming makes the weather less predictable. Therefore, every failed prediction proves that global warming is happening. The more inaccurate the predictions from NOAA and the Met Office, the more we can be confident in the theory of global warming. Wake up people!!!”
So… when you’re wrong, you’re right and when you’re right, you’re right? Brilliant!

October 8, 2010 7:49 pm

Who knows? Maybe The Goreacle is right and global warming will cause more hurricanes?
We’ll just have to wait until the globe actually does start warming to find out.
[ryanm: no, the current consensus is that a warming world will see less storms, but their collective intensity will increase about 2-8%.]

Editor
October 8, 2010 10:11 pm

I notice that NHC’s 5-day forecast map for Otto shows it heading NE in a straight line to 43N 28W, then turning SE to 40N 20W. A sci-fi scenario… has any extra-tropical remnant ever turned back south enough to get caught in the westward flow off the coast of Africa again, and done a round trip? Would that system get a second name, or would it keep the first name?
[ryanm: the waters are only 20-22 C where Otto will end up doing its loop. eventually, when it’s convection disappears, it will likely be dissipated by the midlatitude vertical shear. if it did survive and regenerate, it would keep its name]

Sam Lau
October 8, 2010 11:22 pm

As I have said before, few people here talked NorthWest Pacific (NWP), and many simply do not know that NWP is the home and engine of tropical cyclones(TCs, in NWP we call them typhoons). Let me clarify something, an “average” year since 1945 gives 33TCs in NWP, and NWP contribution to worldwide ACE is near half, so anyone who miss NWP in talking TCs’ activity are not considering the whole picture.
The trouble this year in NWP is fourfold, the number, the strength, the location of formation, and the track, in short, everything which could gone wrong this year has indeed goes wrong.
Easy thing first, as said before an ‘average’ year in NWP sees 33 TCs formation, and for this moment in an ‘average’ year, we should have seen lower to mid-twenty TCs formed in NWP. You guess what? Up to this moment in this year, we have only seen 14 of them lived and dead. Strength is another issue, we have only seen 5 TCs reaching Hurricane force and the ‘norm’ is 18 in a year. Both easily seen problem ensure an ACE breaking the record low. Notice that in NWP, TCs tends to be stronger in El Nino years and the year following that, thanks to the vast warmer ocean in the Eastern half of the basin.
And then something more interesting, the formation and the track of TCs. As for NWP, the relation between ENSO and the formation as well as track are more or less known, in the year following El Nino, the formation and the track are more prominently on the eastern half of NWP, and for La Nina, the formation and track are much more focused in the western side of the basin. ( ref : http://www.weather.gov.hk/publica/reprint/r220.pdf http://www.weather.gov.hk/publica/reprint/r545.pdf http://www.weather.gov.hk/publica/reprint/r675.pdf )
This year, the year following El Nino, out of the 14TCs that are formed, ONLY ONE of them is formed in the eastern half of NWP, and eight of them, which is more than half, have simply ended their live in the South China Sea, which is practically the Westernmost quarter of the basin. There is not a sense of El Nino throughout the TC season, in short, everthing goes wrong. The exact reason for this years’ condition is not known, but suspected to be something deal with PDO.

Pascvaks
October 10, 2010 7:37 am

Ref – Sam Lau says:
October 8, 2010 at 11:22 pm
Great info! Thanks for posting and the links you gave.