Readers may recall a story on WUWT from April titled: Solar Dynamics Observatory – STUNNING first images and movies
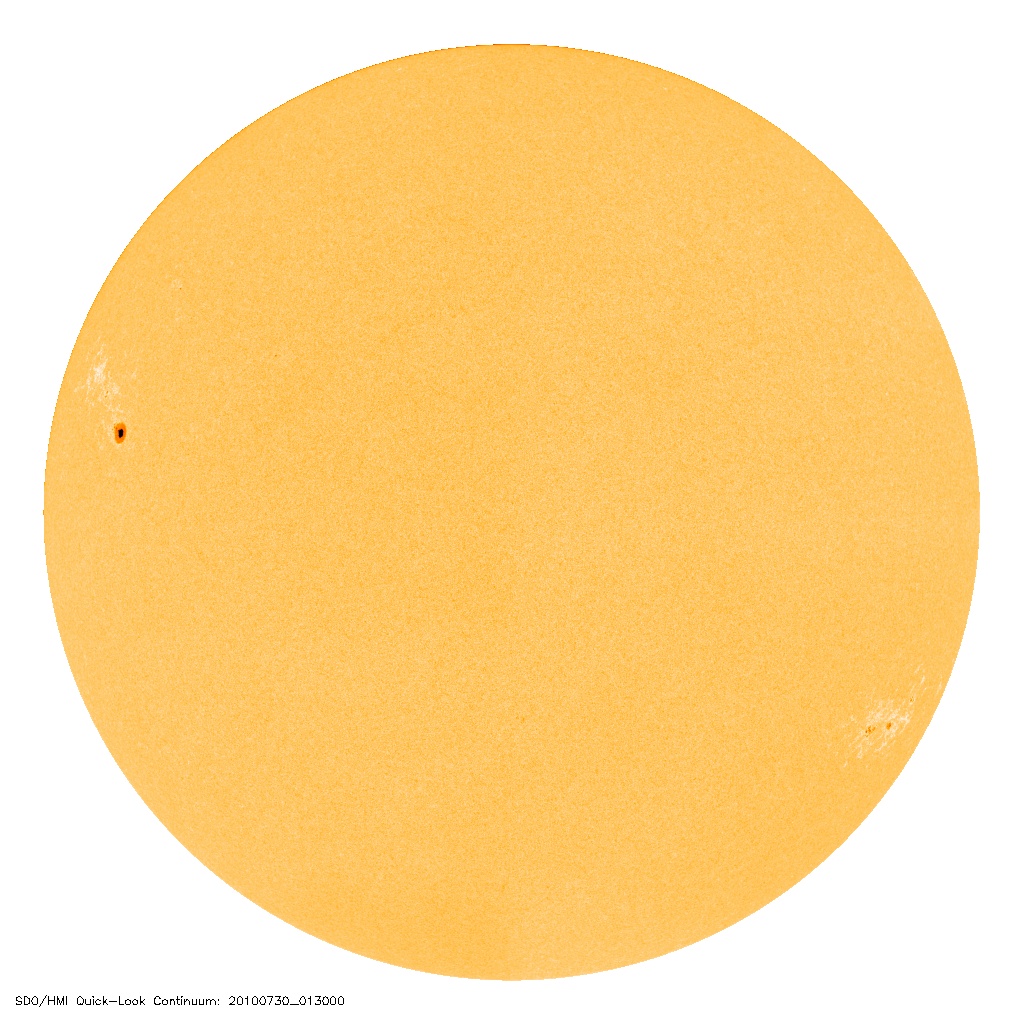
Now, SDO imagery of the sun is online. This week spaceweather.com has started using SDO sunspot imagery in place of the familiar SOHO MDI image on their left sidebar. See all resolutions: 4096, 1024, 256 The upside of the 4096 pixel image is that the detail is striking, the downside is that even tiny sunspecks are now visible in exquisite detail.

The real question now is; what will this new detail do to sunspot counts. As we saw in August 2008, when SIDC retroactively counted a sunspeck to snatch away a spotless month, will the SDO now be the new speckometer? Older telescopes and projection methods would never have seen the sunspecks we see today.
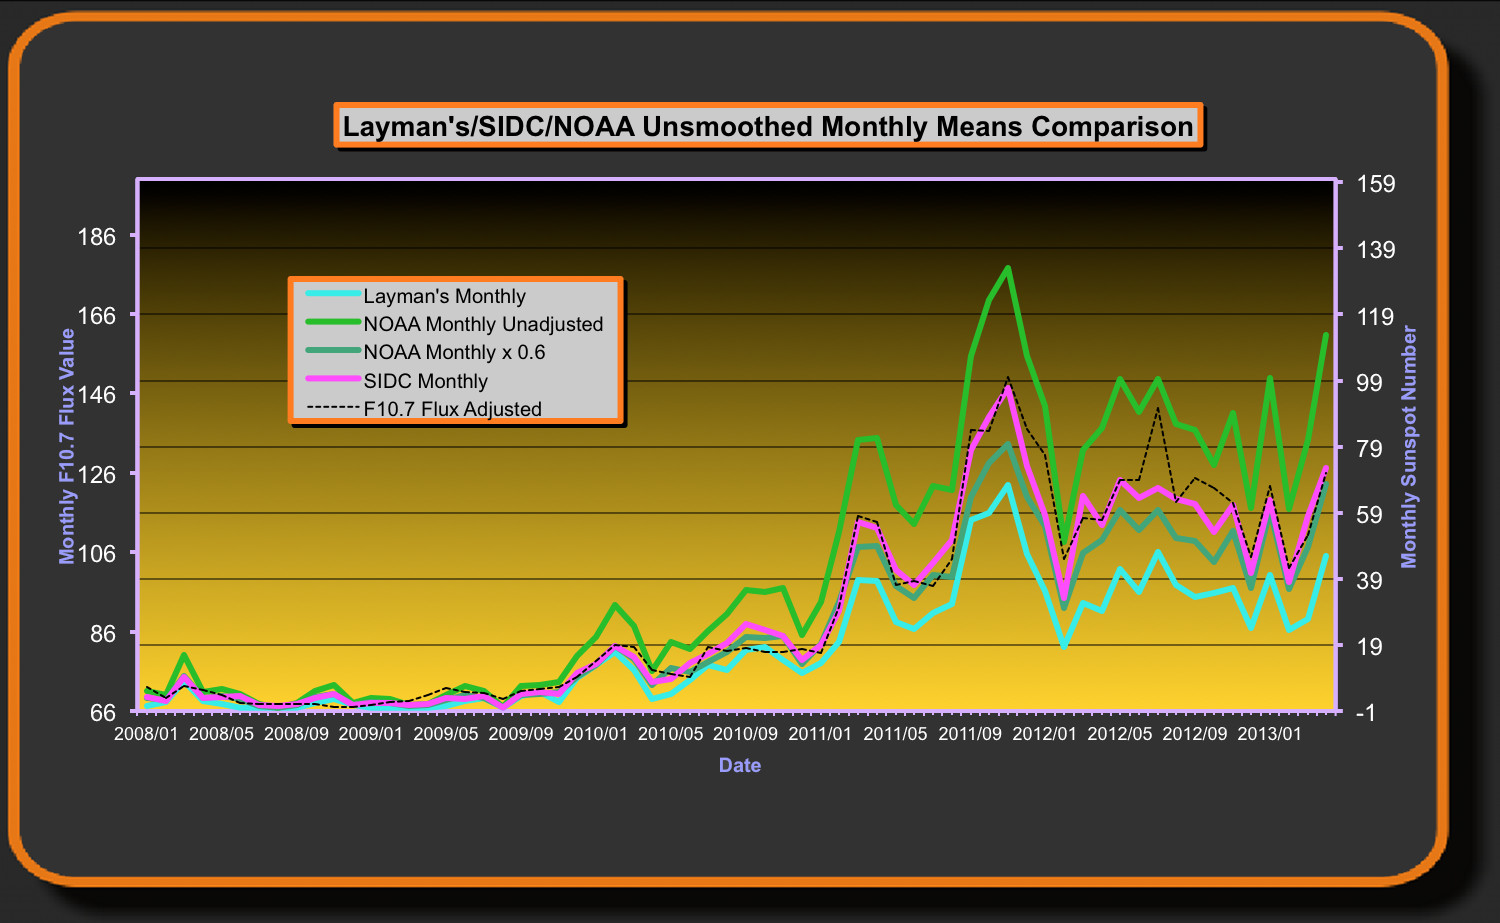
As we see with Geoff Sharp’s Layman’s Sunspot Count, both SIDC and NOAA’s counts are higher than the layman’s count. Now with SDO imagery, will even more miniscule sunspecks widen the gap between them? See the graph below comparing SIDC, NOAA, and LSC:
From Geoff Sharp’s website, here’s how the new Layman’s count works:
THE LAYMAN’S COUNT METHOD & HISTORY
There has been a lot of comments recently about the tiny specks that have been counted as sunspots. A tiny speck can get a daily count of 11 which severely skews the record. Also I have noticed on the SIDC record some days where the Sun is completely blank but the records show a sunspot count. NOAA is another magnitude higher than the SIDC, NOAA using a different method not meant to compare with the historical count. During times of high speck count we need a new standard to record sunspots that gives us a realistic measure of today’s activity verses the last Grand Minimum.
Robert Bateman a very motivated amateur solar enthusiast and myself started a thread at www.solarcycle24.com (which has unfortunately developed into an anti Landscheidt, Pro AGW forum) and soon devised a plan to come up with a reliable standard. We would use the existing SOHO 1024 x 1024 Continuum images and measure the pixels involved in a Sunspot. Initially it had to be determined what a standard sunspot should represent in size and density, to try and represent a minimum counter like Wolf may have done 200 years ago. After some deliberation and advise from Robert who also dabbles in Astronomy with his own equipment, we came up with a minimum standard.

To be counted, a sunspot or group must have 23 pixels which have a reading in the green channel of 0-70 for at least 24 hours.
All pixels in a digital image have a RGB reading which split out into separate Red, Blue, Green channels and can be easily measured and counted in one action using a freeware graphics program called GIMP.
So the standard was set, which now enabled us to go back over the records and weed out the offending specks and blank days.
The official Layman’s Sunspot Count is compared against the SIDC record which is considered conservative when compared with other institutions involved. Basically we use the same sunspot number as SIDC but replace them with zero on days that don’t make the grade. When the SIDC count is made up of two or more areas and if any of the area’s do not make the Layman’s Count, the overall SIDC daily count will be reduced by the areas that fail. Spots that count 23 pixels and over before midnight and then continue on to pass the 24 hour rule will take the SIDC value of that day. Existing Spots that have made the grade but measure less than 23 pixels at midnight are not counted on the next day.
===================================================
Unless solar science comes up with a way to deal with the advances in technology and properly merge it into the older human-optical record, the sunspot record will start looking like the surface temperature record, with upwards trends due to adjustments (or lack thereof).
I think Sharp and Bateman are on to something, and if you’ll provide me a graphic that isn’t drop shadowed onto a dark background, I’ll add it to the upcoming WUWT solar page with a link to yours. – Anthony
I totally agree. It’s a sad mark on “Science” when even something so ridiculously obvious has to be pointed out.
Being a male, I understand the need to play with one’s new toys, and the SDO is definitely a stunning new toy! But if someone wants to compare today with 100 years ago, that someone HAS to use the same methodology as was used 100 years ago. Otherwise they are comparing apples to brass.
By the way, that first image is a breathtaking close-up of the little speck I see on my desktop live sun watching gadget…
Rather than arbitrarily define a sunspot, would it not be more useful to plot the entire area covered by all sunspots and aggregate the total for comparison?
Fair enough. But label the smaller, formerly invisible spots as a class. Like A and B spots with the latter the size that could have been seen by pre year 2000 methodology.
This issue is similar to the ‘averages’ used for many other measurements. Eg:
NSIDC Arctic Sea Ice Extent – 15% or greater use 1979 – 2000 average
University of Bremen Arctic Sea Ice Extent – 15% or greater use 1972 – 2008 average
NANSEN Artic ROOS- Sea ice extent 15% or greater use 1979 – 2006 average
Wouldn’t you think that the global issue of AGW requires global standards so that the apple and orange users could speak to each other.
We need a Douglas Adams babel fish – urgently
CodeTech says:
July 30, 2010 at 5:53 pm
But if someone wants to compare today with 100 years ago, that someone HAS to use the same methodology as was used 100 years ago. Otherwise they are comparing apples to brass.
—-
Yup.
Like hurricanes.
Now they name every two clouds that are on speaking terms, even if only for a minute.
Now if they could just blame the sunspot increase on AGW….
I understand the goal with this and don’t disagree, but spots are only one indicator of solar activity/cycles. I hope that the general fascination with spots is not detracting from other studies of old sol, which may yield a better understanding of what is quite likely the most complex object in our entire system.
Well if the science world can demote Pluto to “minor planet” and “plutoid” status as not a capital P Planet, then science should also demote all these minor specks as well and not call them spots. I propose calling them Motes, but thats the scifi nut in me.
Like peering into a fractal, how far do you want to go? It only takes precision.
Someone needs to check which method correlates best with other measures of solar magnetic and radiative activity such as the 10.7 cm radiation. The best correlative measure should be the new standard.
Yet for time series over the decades/centuries, the old method must also be preserved, as only it can be valid for new/old comparisons.
KW
Frankly I’m a bit stunned that this even has to be discussed. As a person of minimal education, I’ve always thought that science was about very precise specifications and descriptions.
I would have assumed that a methodology something along the lines of a spot is big enough to be seen with the old method and a speck can be seen with the new method would have been an automatic part of the process. So a recording would be something along the lines of, on XYZ date there was A number of spots and B number of specks.
What’s going on now amounts to nothing more than silly word games.
Q When is an Apple not an Apple
A When it is a fruit
I’m not impressed that we can count 13 spots where Wolf would have counted three. We have always known the detail was there so why be surprised that we can now see it with ultra-precise instruments? What about SDO version 9, a sunspot at the intersection of most grains? The real question is whether science, with all of its glorious increase in knowledge, is able to hang on to the long term data intact without destroying what it has taken mankind centuries to meticulously accumulate. That is the real question. Will the great egos allow?
Geoff Sharp’s Landscheidt.org is a must-visit site. It offer a nice graphical comparison chart of SC5 (1798), SC14 (1902) and SC24 (2008) sunspot counts. Currently, SC24 numbers are tracking just under the SC5 count. SC5 marked the beginning of the Dalton Minimum (1790 -1830) and much colder global temperatures.
I wholeheartedly agree that it should be done.
Even if it’s just for fun.
—
Are these “sunspecks” truly indicative of solar output?
The reason why sunspot counts have been relied upon for decades is that they have correlated with good reliability to activity within the sun. It would seem that these hitherto-too-small-to-see “sunspecks” might not similarly serve, and therefore counting them yields information of no significant importance.
—
At least we have the layman’s count so we can still do direct comparison. (Thank you Geoff)
Yes there are other parameters like the F10.7 flux that are better indicators however we have had actual and not proxy measurements of sunspots for hundreds of years (1610) The first record of sunspots dates to around 800 BC in China.
The sunspot record will need to be correlated with tree ring data to clear up these issues and discrepancies once and for all.
Don’t ever send NOAA off to the produce section — they keep having a problem with apples and oranges.
SDO is a mixed blessing. It’s great for capturing ever greater detail and for allowing scientists to better see what’s happening with the sun. So it’s great that they’ll be able to detect ever more sunspot details, as well as many more sun spots. However, don’t confuse that great knowledge as a valid tool with which to compare older records of the sun. They’re already impressing themselves in the field of terrestrial events by comparing the number of tropical storms/hurricanes they can find with satellites today with pre-satellite era records.
Credibility problems?
I wonder why …
Tom Fuller says:
July 30, 2010 at 5:58 pm
Rather than arbitrarily define a sunspot, would it not be more useful to plot the entire area covered by all sunspots and aggregate the total for comparison?
No, because with increasing technology, one is grabbing spots below the area standards that define them.
What Geoff started is to bring area measurements to bear on the subject.
His results solve the technology advantage. All one has to do is to filter by area to get what Wolf was seeing in his days.
That is the numerical side.
Image-wise, there is this:
http://www.robertb.darkhorizons.org/DeepSolarMin2.htm
and further analysis of how technology ruins the spot count is here:
http://www.robertb.darkhorizons.org/DeepSolarMin5.htm
On that page, 1/3 the way down, is a series of clips of sunspots.
What I did was take SOHO MDI Continuum, take the Luminence channnel, reduce to 512×512 , and adjust the contrast to match what I can project with a 70mm F/10 refractor on paper.
In image processing parlance this is known as binning. The specks and weak spot disappear, as they do in real life.
No matter which way you do it, whether by Geoff’s area method, or downsizing SOHO & SDO images, the spot count is reduced to what Wolf would have seen.
Here is a case example of how counting faint spots can wreck a SSN, but do little to an area measurement:
http://fenyi.sci.klte.hu/DPD/2009/20091230/20091230_11039.html
We’ll start with the upper data, and take the total corrected area for group # 11039 and divide it by 15:
138/15 = 9.2 your Sunspot #.
Next, we’ll go to the breakdown of the group, count the main spots as 10, and add 14 for the number of spots.
10 + 14 = 24. The DSD list from swpc/noaa give 15 for Dec 30, 2009.
SIDC gives the # as 12.
4 different results. Confusing, isn’t it?
Now you begin to see what Geoff and I were up to.
Set a resolution size for detection, filter by area, and let the results land where they will.
Now, I have nothing against SDO. Otherwise, I wouldn’t be doing things like this:
http://www.robertb.darkhorizons.org/SDO_latestLg.jpg
Extreme UV Sun w/ spots and faculae, with all the neat filaments, coronal holes and what-not.
mikelorrey says:
July 30, 2010 at 6:55 pm
> …, then science should also demote all these minor specks as well and not call them spots. I propose calling them Motes, but thats the scifi nut in me.
Okay, but only if we measure the area of the motes in nivens.
To be fair the SIDC observatories use equipment with similar magnification to what Wolf used in the 19th century. NOAA from my knowledge uses different magnification but maybe someone could confirm that. What has changed is the way the spots are counted, Wolf who reconstructed the Dalton Minimum values did not count specks, these days we do with NOAA not making an allowance and the SIDC discounting by multiplying by 0 .6. I think the .6 discount does not work when the speck ratio increases in times as we see today.
Also along the way the count has increased over time and as Leif states in his paper is at least 22% higher than the 19th century methods, the Layman’s Count attempts to redress these issues and bring the modern count back close to how Wolf would have calculated.
Wolf’s formula gives extra weight to a sunspot group that just happens to align it quite closely to the F10.7 Flux values. Wolf was a fan of using sunspot area but doing so does not give a good indication of overall solar activity but does show a better record of the actual spot activity, it depends on what you want to measure. I have started a new area measurement that is factored by the magnetic strength that may be of interest to some.
http://www.landscheidt.info/?q=node/185
Thanks Anthony for the promotion, I can provide a graph for WUWT with a white background outside of the orange boarder, which graph/s are you interested in?
That was a rhetorical question right? Of course the team and co. will use the never before observable pin pricks in the count.
Geoff:
The SDO images that Anthony links to, Red Channel gives the umbra, Blue Channel gives the Whole Spot, and Green Channel gives both.