By Joseph D’Aleo, CCM, ICECAP
May has been frigid slowing the planting and emergence of the summer crops in Canada. Late freezes and even snows are still occurring regularly and can be expected the rest of the month.

See larger image here.
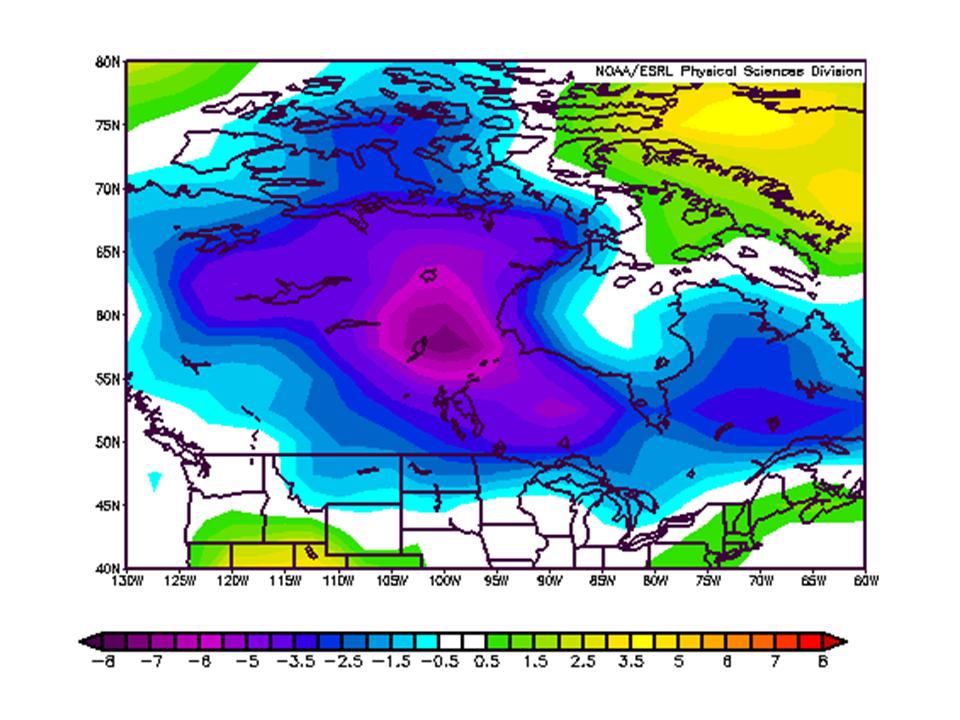
The chart above shows the May 2009 temperature anomaly through May 24th. Parts of central Canada (Churchill, Manitoba) are running 16 degrees F below normal for the month through the 26th (map ends 24th). Every day this month has seen lows below freezing in Churchill and only 6 out of the first 26 days days had highs edge above freezing. The forecast the rest of the month is for more cold with even some snow today in Churchill and again this weekend perhaps further south.
Hudson Bay remains mostly frozen though most of the seasonal melting occurs in June and July most years.
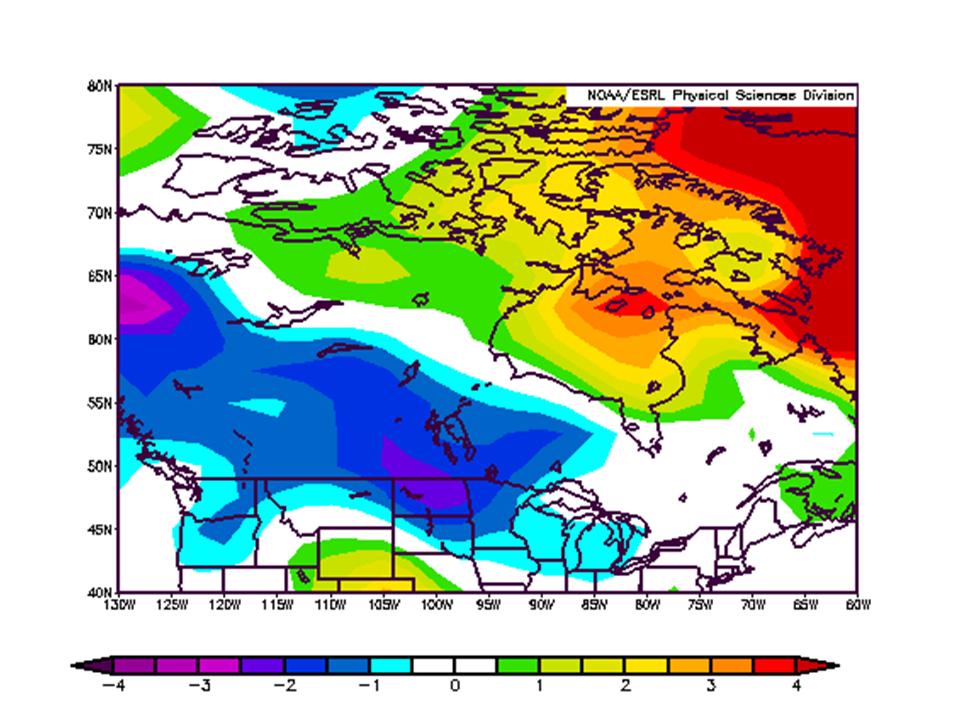
Parts of the south central region were also cold in April averaging 3-5 F below normal. The winter (December to March) was a cold one for southwest and central Canada but warmer in the far northeast.


See larger image here.
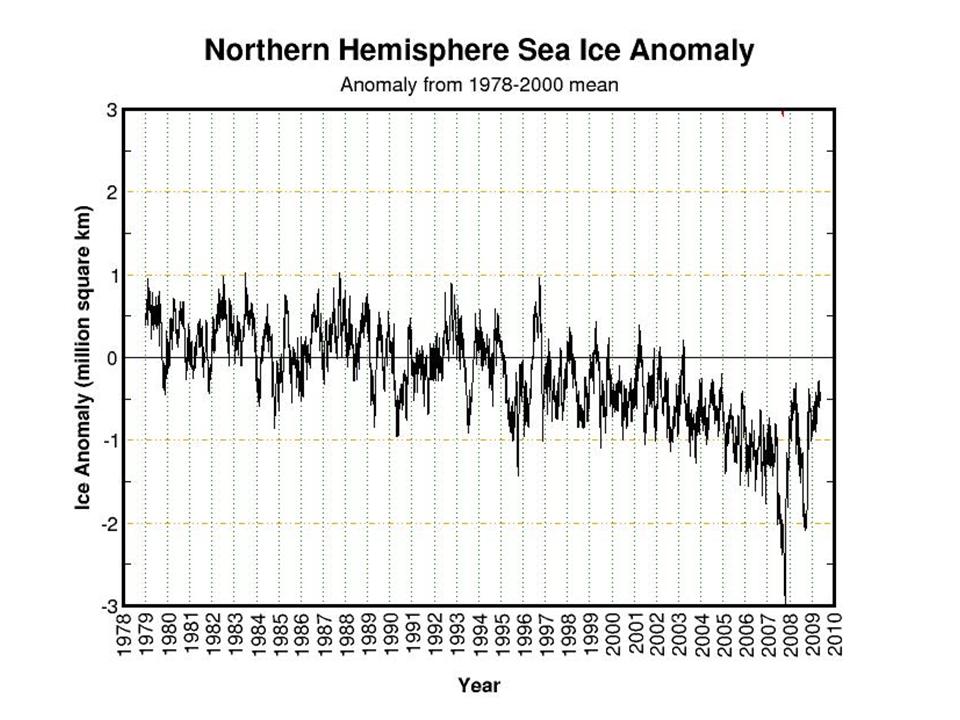
Meanwhile the arctic ice remains higher this data for any year this decade in a virtual tie with 2004.

See larger image here.
Given the polar stratospheric aerosols from Mt Redoubt, and a colder Atlantic and a continued cold Pacific, the recovery from the minimum of 2007 should continue this season.
The global data bases have large gaps in Canada, Africa, South America. So they will not reflect this in their global May anomalies as well as the satellites that see the entire surface – land and ocean excluding high latitude polar.
See pdf here.
May has been frigid slowing the planting and emergence of the summer crops in Canada. Late freezes and even snows are still occurring regularly and can be expected the rest of the month.

See larger image here.
The chart above shows the May 2009 temperature anomaly through May 24th. Parts of central Canada (Churchill, Manitoba) are running 16 degrees F below normal for the month through the 26th (map ends 24th). Every day this month has seen lows below freezing in Churchill and only 6 out of the first 26 days days had highs edge above freezing. The forecast the rest of the month is for more cold with even some snow today in Churchill and again this weekend perhaps further south.
Hudson Bay remains mostly frozen though most of the seasonal melting occurs in June and July most years.
Parts of the south central region were also cold in April averaging 3-5 F below normal. The winter (December to March) was a cold one for southwest and central Canada but warmer in the far northeast.

See larger image here.
Meanwhile the arctic ice remains higher this data for any year this decade in a virtual tie with 2004.

See larger image here.
Given the polar stratospheric aerosols from Mt Redoubt, and a colder Atlantic and a continued cold Pacific, the recovery from the minimum of 2007 should continue this season.
The global data bases have large gaps in Canada, Africa, South America. So they will not reflect this in their global May anomalies as well as the satellites that see the entire surface – land and ocean excluding high latitude polar.
See pdf here. H/T Climate Depot and Andy for the heads up
Canada Has a Frigid May after a Cold Winter By Joseph D’Aleo
May has been frigid slowing the planting and emergence of the summer crops in Canada. Late freezes and even snows are still occurring regularly and can be expected the rest of the month.
See larger image here.
The chart above shows the May 2009 temperature anomaly through May 24th. Parts of central Canada (Churchill, Manitoba) are running 16 degrees F below normal for the month through the 26th (map ends 24th). Every day this month has seen lows below freezing in Churchill and only 6 out of the first 26 days days had highs edge above freezing. The forecast the rest of the month is for more cold with even some snow today in Churchill and again this weekend perhaps further south.
Hudson Bay remains mostly frozen though most of the seasonal melting occurs in June and July most years.
Parts of the south central region were also cold in April averaging 3-5 F below normal. The winter (December to March) was a cold one for southwest and central Canada but warmer in the far northeast.
See larger image here.
Meanwhile the arctic ice remains higher this data for any year this decade in a virtual tie with 2004.
See larger image here.
Given the polar stratospheric aerosols from Mt Redoubt, and a colder Atlantic and a continued cold Pacific, the recovery from the minimum of 2007 should continue this season.
The global data bases have large gaps in Canada, Africa, South America. So they will not reflect this in their global May anomalies as well as the satellites that see the entire surface – land and ocean excluding high latitude polar.
See pdf here. H/T Climate Depot and Andy for the heads up.
.Discover more from Watts Up With That?
Subscribe to get the latest posts sent to your email.
Nobody wants to punch Al Gore in the **** more than me, but there seems to be as much positive anomaly on these maps as negative.
Clear evidence that there is no such thing as climate change.
Why are we the “deniers” and “skeptics” ?
I think we should start using the “natural cycle deniers” tag on AGW supporters…
It’s all in the jet stream. It continues its loop de loop as it circles the NH. That cold air normally restricted to the Fall, Winter, Spring, and Summer Arctic in El Nino years, is being channeled southward by the loops. Canada is now part of the new Arctic circle and will stay that way till the jet stream straightens out and stops all this loopyness. Airline companies don’t much like the loopy jet stream. They much prefer the straight and narrow West to East flow, in other words, the fuel saving flight path.
Pamela,
Perhaps you could shed some additional light on the jet stream. I have always understood that the jet stream was the result of the convergence of warm air masses from the south and cold air masses from the north. Which ever air mass is stronger in a particular area will push the boundry more north or south rather than the jet stream itself “pulling” on the air masses. Thanks.
I’m wondering—was there confirmation on the cold record broken in Edmonton by -12C? I didn’t catch if there was. I may have overlooked the report.
http://wattsupwiththat.com/2009/03/15/edmonton-canada-bests-march-10th-record-low-by-12-degrees-columnist-questions-climate-situation/
Robert (18:21:51) said :
Nobody wants to punch Al Gore in the **** more than me, but there seems to be as much positive anomaly on these maps as negative.
GRANTED. The worrisome thing, however, is that Greenland and Scandanavia are not the “breadbaskets” (to use the old Social Studies word) that are Manitoba, Saskatchewan and the southern reaches of Alberta.
Combined with a late start to the planting season across the Northern Plans of the USA, my guess is Buy Wheat Futures.
PS Suggest a contest for a four-letter word meaning “where I’d like to punch Al Gore”. My submission: “boys”.
I had read that what the sun is doing shows up first at the poles. I had also read that there is no evidence for that hypothesis. The sun has been quiet for 2 years and both North and South pole ice are in a growing trend. Correlation is not causation–I KNOW.
But is is possible this cold in Canada is connected to the quiet sun and not just from the -PDO and the jet stream?
mkurbo (18:53:09) :
I have thought things along those lines too mkurbo.
hareynolds (19:26:42) :
A debate in broad day light with Václav Klaus or Richard Lindzen might make Al Gore feel like he’s being troubled in those “boys”.
Coldest winter in the UK in 30 or more years. Record lows/snow in Canada and the USA. Arctic ice almost back to 1979 “norm”. Snow in Saudi, China and first snow in Iran in 100 years. Cold summer in Australia. Autumn bypassed, winter arrives in New Zealand. SH ski season in Australia starts 5 weeks early…
http://www.skiinfo.com/News-104-en.jhtml?a=137762
This stinks of a trend, albeit as short one, to me.
hareynolds (19:26:42) :
PS Suggest a contest for a four-letter word meaning “where I’d like to punch Al Gore”. My submission: “boys”.
My suggestion is cods.
I’m wondering how much effect Mt. Redoubt’s eruption has in the Northern hemisphere. Perhaps it’s too soon to see the effect but this coming fall and winter could be worse for Canada and the Northern hemisphere.
Tom in Florida, the following link is one of the better explanations of the jet stream behavior. During El Nino, the jet stream is further south, blows west to east in a rather straight pattern (with some camel back-like large waves extending northward, and can be quite strong, bringing warm air to Canada. Therefore extreme weather events occur in more southern latitudes. Nonetheless, jets can travel an El Nino jet stream almost as the crow flies.
During La Nina, the jet stream aims for the Rockies and then travels in a looping pattern east-northeast towards the great lakes. The loops are so severe that the primary flow is north to south, not south to north as is the case in the more southern position. Extreme weather events occur in northern latitudes and force Arctic cold blasts into the states. Jets literally are forced to jump from one loop to another, significantly decreasing gas mileage and fuel costs.
So what comes first, jet stream movement or PDO changes. The most immediate cause is likely PDO changes. Which leads to jet stream changes. Going further back, PDO changes are most likely caused by trade wind (Coriolis affect) changes. And that is as far as I can go without further study.
http://www.weatherexplained.com/Vol-1/El-Ni-o-La-Ni-a.html
Tom in Florida, may I suggest the reading of Marcel Leroux’s books “Dynamic analysis of weather and climate”?
Hardly hard science — just casual observations — but I am here in southern Alberta and spring is LATE! Period. Poplar trees still not fully leafed out … Maydays bloomed about two weeks late this year….we got snowed on twice two weeks ago on a spring camping trip. See here…yucko..
http://members.shaw.ca/ocl3/campout.jpg
Tulips have just finished blooming here.
I have yet to check the data for where I live, but assuming it to be a couple of degrees below 1970-2000 average.
The days start getting shorter in 3½ weeks. ☺
Take a look at the prevailing direction of cold air into Canada in the May jet stream animation. Notice the number of times the arrows are demonstrating cold Arctic blasts swooping South into our neighbor to the North.
http://squall.sfsu.edu/scripts/nhemjet_archloop.html
You have to set the parameters for 2009, May, 20 days, 6 hr, and then hit “build animation”.
The chart above shows the May 2009 temperature anomaly through May 24th. Parts of central Canada (Churchill, Manitoba) are running 16 degrees F below normal for the month through the 26th (map ends 24th).
Fear not. GHCN will catch those outliers and correct them.
Pamela: What about the WPO? Doesn’t that play a big hand in calling those shots?
evanmjones, just for giggles I googled WPO. Actually, this may be what you mean. The World Presidents’ Organization may indeed call the shots. Or the World Packaging Organization.
“Alaska’s Hubbard Glacier is advancing at the rate of seven feet per day!”
http://www.freerepublic.com/focus/news/2249100/posts
“”Clive (20:12:46) : Poplar trees still not fully leafed out … Maydays bloomed about two weeks late this year””
I’m wondering if this is natures reaction to the quiet sun. Or some much larger mechanism also.
Sounds familiar, what David Archibald was saying would be happening, though a tad bit advanced on schedule.
Pamela: Oops. NPO. The Aleutian-Edmonton pressure differential.