by Dr. Alan Welch FBIS FRAS
(WARNING – this paper contains images of 5-year projections in sea levels that some readers may find disturbing.)
The next 5 years may be a good opportunity to judge how the “global” sea level rises are changing, especially with respect to the perceived “accelerations”. The terms “global” and “accelerations” are in quotes to infer that that these terms may not be totally appropriate. The satellite coverage is only 95% and the “accelerations” may be caused by the methodology used and not a true physical attribute.
The two papers by Nerem et al have had a major influence about sea level rises. The paper, Nerem et al (2018), introduced the concept of an “acceleration” stemming from the fitting of a quadratic curve. This paper has had over 1500 citations and has greatly influenced the media and frightened all the kids from Boca Chica to Timbuctoo. The second paper, Nerem et al (2022), stated that the “acceleration coefficient becomes stable after 2017”, this being shown in figure 0 below of the paper which reproduces their figure 2.

Figure 0
Contact was made with one of the co-authors, (B. D H), saying that the graph was a very interesting presentation and that it would be informative to keep it up-dated. No reply was received, no update has been seen and no other form of this graph has appeared anywhere else except, I think, in my various papers on WUWT.
Before proceeding a small diversion. I asked the new kid on the block, AI, two questions. The AI used was Google AI.
Question 1
I have 25 years of sea level data to which I fit a quadratic curve. That curve is then extrapolated for another 80 years. Is this acceptable?
AI answered“In general, this approach is highly discouraged. Extrapolating a quadratic curve fitted to just 25 years of data over an 80-year period is statistically problematic, as sea level rise is highly complex and not strictly governed by a simple mathematical parabola.”
Question 2 (Almost the same as question 1 except replacing me with Nerem et al).
In their 2018 paper Nerem et al used 25 years of sea level data to which they fitted a quadratic curve. That curve was then extrapolated for another 80 years. Is this acceptable?
AI answered (although AI seems to have now donned rose tinted glasses) “The quadratic extrapolation used in the 2018 Nerem et al. paper is considered scientifically acceptable as a descriptive diagnostic to detect current acceleration, but it is not intended to be a definitive physical projection of future sea levels.
While fitting a curve to 25 years and extending it for 80 is often criticized in statistics, the authors used it primarily as a ““thought experiment”” to demonstrate that observed satellite data is already tracking with high-end climate models.”
My updated graph based on the NASA data for the end of May 2026, showing how “acceleration” changed with time, is reproduced below (figure 1).

Figure 1
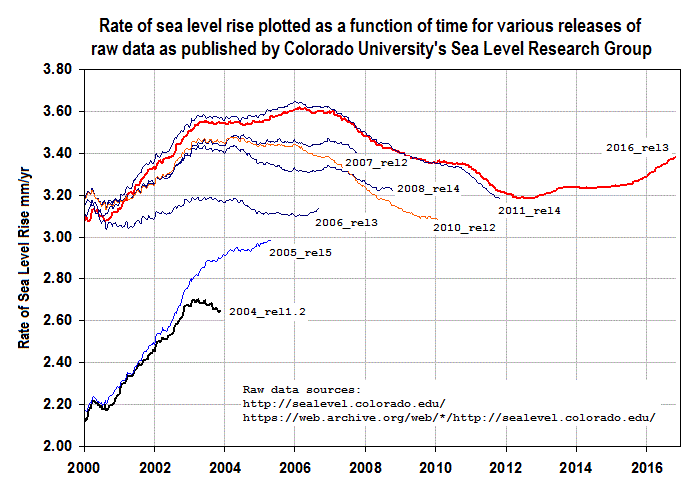
It should be noted that the historic NASA data (as well as the historic University of Colorado data) have changed many times since 2018. The 5-year projections use the NASA data for December 2025 which was slightly different as shown in the “acceleration” plot below (figure 2). The topic of changes in the data over the last 8 years will be addressed in a separate paper. The historic data sets are not readily available, but having retained most of this data it can revisited or reanalysed at any stage. The differences between the December 2025 and May 2026 NASA data have pulled the “accelerations” between 2018 and 2025 generally back up towards the 0.08 mm/year2, which may be just coincidental, but from 2025 there is still a change to a rapidly decreasing “acceleration” values, which in May 2026 are now already below 0.06 mm/year2 as can be seen in Figure 1.

Figure 2
It can be seen that the “acceleration” remains basically constant over 2017 to 2022 then starts to drop and after the beginning of 2025 starts to drop more rapidly. The “red” line is a theoretical line based on the sea levels varying about the best straight line fit in a sinusoidal manner with a period of 29 years. This red curve continues over the next 15 years decaying to near zero values commensurate with those seen in long term Tidal Gauges.
To extend the data to cover the years 2026 to 2030 the following steps were taken.
- Use the annual variation through 2025 to generate data for each subsequent year. Due to the small changes during 2025 this generates quite a small increase over the 5 years, and this is deemed to be too low to be meaningful.
- Add an extra 2 mm rise per year each year this being deemed a lower bound (data set 1).
- Add an extra 3 mm rise per year each year this being deemed an upper bound (data set 2).
- To each of the above add a large El Niño set of data based on a rise of 10 mm over 2027 and a following decrease over 2028 (data sets 3 and 4).
The definition of data sets 1 and 2 as lower and upper bounds is only used to give a pair of data sets that are in the right ballpark. Plots of the data are shown below (figures 3 to 6).

Figure 3

Figure 4

Figure 5

Figure 6
The slopes of the best fit straight line for the December 2025 and the 4 simulated data sets were obtained and are listed below.
December 2025 3.09 mm/year
Data set 1 3.07 mm/year Lower Band
Data set 2 3.12 mm/year Upper Band
Data set 3 3.10 mm/year Lower Band plus El Niño
Data set 4 3.15 mm/year Upper Band plus El Niño
The slope for December 2025 falls between data sets 1 and 2 with the slopes involving an El Niño being both higher. The slopes at this period are only increasing at about 0.02mm/year so the simulated data sets are considered to be reasonable or even slightly high.
The “accelerations” for all 4 cases were calculated between 2012 (when the NASA data started to give less erratic values) and 2031and are shown below in figures 7 to 10.

Figure 7

Figure 8

Figure 9

Figure 10
The “accelerations” fall to values of approximately 0.025, 0.035, 0.030 and 0.040 mm/year2.
This assumes there are no major changes to the historic data. Judged on these plots the long term “acceleration” will reach about 0.0 mm/year2 by2040. although in reality the decay may be more asymptotic to about 0.01mm/year2 in line with tidal gauge data. The sea level curve created by an acceleration of 0.01mm/year2 can also be matched by long term (1000 year) sinusoidal variation as has been shown in my paper “Does the Global Sea-Level rise have a Sinusoidal variation. An Investigation using Tidal Gauge Data. Part 1 – Preliminary Analysis”, published on WUWT as https://wattsupwiththat.com/2025/12/02/does-the-global-sea-level-rise-have-a-sinusoidal-variation/
The conclusion reached is that generally the “acceleration” will continue to fall over the next 10 to 15 years or will reach values commensurate with the Tidal Gauge estimates.
Appendix – Most of the analyses and graphs have involved the perceived “accelerations”. Figure 11 shows the variation of the slope as calculated over the period from 1993 to the year indicated. The 3 curves show the slopes calculated using the actual data, a quadratic variation and a sinusoidal variation. It can be seen that the sinusoidal curve matches the actual data more closely adding more evidence negating the use of a quadratic curve and the associated “acceleration”. The quadratic variation is basically a straight line, whereas the sinusoidal variation shows the drop to about 2008, a climb up to an inflection point at about 2017 at which stage the growth in the curve begins to slow down.

Figure 11
Mission Statement – Being an 88-year OAP a 5-year projection seems overly ambitious, but I hope to make 2031 to see how right (or wrong) I have been.
# # #