From Dr. Roy Spencer’s Global Warming Blog
by Roy W. Spencer, Ph. D.
The Version 6.1 global average lower tropospheric temperature (LT) anomaly for April, 2025 was +0.61 deg. C departure from the 1991-2020 mean, up a little from the March, 2025 anomaly of +0.57 deg. C.

The Version 6.1 global area-averaged linear temperature trend (January 1979 through April 2025) remains at +0.15 deg/ C/decade (+0.22 C/decade over land, +0.13 C/decade over oceans).
The following table lists various regional Version 6.1 LT departures from the 30-year (1991-2020) average for the last 16 months (record highs are in red).
| YEAR | MO | GLOBE | NHEM. | SHEM. | TROPIC | USA48 | ARCTIC | AUST |
| 2024 | Jan | +0.80 | +1.02 | +0.58 | +1.20 | -0.19 | +0.40 | +1.12 |
| 2024 | Feb | +0.88 | +0.95 | +0.81 | +1.17 | +1.31 | +0.86 | +1.16 |
| 2024 | Mar | +0.88 | +0.96 | +0.80 | +1.26 | +0.22 | +1.05 | +1.34 |
| 2024 | Apr | +0.94 | +1.12 | +0.76 | +1.15 | +0.86 | +0.88 | +0.54 |
| 2024 | May | +0.78 | +0.77 | +0.78 | +1.20 | +0.05 | +0.20 | +0.53 |
| 2024 | June | +0.69 | +0.78 | +0.60 | +0.85 | +1.37 | +0.64 | +0.91 |
| 2024 | July | +0.74 | +0.86 | +0.61 | +0.97 | +0.44 | +0.56 | -0.07 |
| 2024 | Aug | +0.76 | +0.82 | +0.69 | +0.74 | +0.40 | +0.88 | +1.75 |
| 2024 | Sep | +0.81 | +1.04 | +0.58 | +0.82 | +1.31 | +1.48 | +0.98 |
| 2024 | Oct | +0.75 | +0.89 | +0.60 | +0.63 | +1.90 | +0.81 | +1.09 |
| 2024 | Nov | +0.64 | +0.87 | +0.41 | +0.53 | +1.12 | +0.79 | +1.00 |
| 2024 | Dec | +0.62 | +0.76 | +0.48 | +0.52 | +1.42 | +1.12 | +1.54 |
| 2025 | Jan | +0.45 | +0.70 | +0.21 | +0.24 | -1.06 | +0.74 | +0.48 |
| 2025 | Feb | +0.50 | +0.55 | +0.45 | +0.26 | +1.04 | +2.10 | +0.87 |
| 2025 | Mar | +0.57 | +0.74 | +0.41 | +0.40 | +1.24 | +1.23 | +1.20 |
| 2025 | Apr | +0.61 | +0.77 | +0.46 | +0.37 | +0.82 | +0.85 | +1.21 |
The full UAH Global Temperature Report, along with the LT global gridpoint anomaly image for April, 2025, and a more detailed analysis by John Christy, should be available within the next several days here.
The monthly anomalies for various regions for the four deep layers we monitor from satellites will be available in the next several days at the following locations:
A year of cooling from the Tongan eruption high in April 2024.
A year of cooling? Because of La Nina. Nothing noteworthy at all.
It will go back up when the ENSO oscillation switches to its new phase.
Which La Niña was that? According to BoM it was a NON-event.
Fair. Still, it’s what you expect when coming off a moderate El Nino.
Exactly. Going from an ONI of +2.0 to -0.6 is going to cause cooling. My trivial model below suggests that it accounts for about 0.4 C of cooling.
The 30day and 90 day SOI are still positive thus we are now in a weak La Nina. BOM forecasts and modelling is useless. It is raining here is SEQld. The ants are far better at forecasting 3 to 7 days before significant rain. The BOM used to use SOI and atmospheric pressure data for forecasting but now use general circulation models which include CO2. That is where they go wrong as their models have no physical measurement basis.
Hunga Tonga: the volcano that explains everything.
Not everything, but the spike from summer 2023 to spring 2024, yes. Boosted by an ordinary Niño.
Certainly explains the early start to the El Nino, and the length of it…
Unless of course you think that extra WV doesn’t slow cooling..
That extra WV is still in the Stratosphere, btw. Spread out and gradually thinning, but still there.
Not really. CO2 explains more.
I was being sarcastic people.
You have to use the /sarc around here. Some are quick on the draw!
Mike, CO2 explains nothing about climate, it’s about time you woke up to this scam!
Carbon dioxide: the molecule which explains nothing.
It explains why my dandelions are popping up all over. That and the fact that my city banned “pesticides”, which the morons thought included herbicides.
Yep, dat’s true!
Please take the Hunga Tonga garbage and blow it square-ways out whatever orifice you are speaking from.
Nothing about global temperature has anything whatsoever to do with Hunga Tonga. Get this through your ever-loving head: we are talking about a one part per million increase in stratospheric water vapor that is sitting on top of a troposphere wherein the concentration of water vapor is routinely many thousands of times higher. Hunga Tonga water vapor has precisely zero effect on anything. If you do not believe that anthropogenic CO2 emissions cause global warming, then you a fortiori cannot believe that Hunga Tonga water vapor causes global warming, either.
Now either put two and two together or surrender your skeptic’s card. There is no third way about it.
Boy, a sermon, and it’s not even Sunday!
And what we mustn’t forget is that the Maldives should have been under water by 2018.
Or, at the height of the Medieval Warming Period, the tree line was 50km north of current, or 120m higher in mountainous regions, and, somehow, those extraordinarily clever people the Vikings were growing crops in southern Greenland, all of this possible when anthropogenic global warming was . . . well, entirely and completely absent.
And what about Glacier Bay, where glaciers started to retreat before there was even a whiff of the Industrial Revolution?!
So put two and two together . . . for chrisake!!
WV in the stratosphere is not the same as WV in the troposphere, especially during the peak of a solar cycle where increased UV dissociates the H20 into H and OH. Another clue?
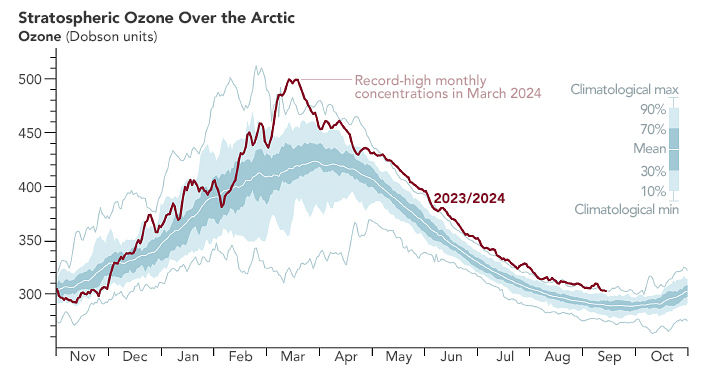
Arctic Ozone Hits Record High
If you believe extra WV in the atmosphere doesn’t slow cooling…
… you have just destroyed the AGW fantasy !!
Well spotted!
How does CO2 slow cooling at far lower concentrations than water, a molecule with a much wider and deeper IR absorption?
Yes, that was my whole point, you reaming idiot.
Do any of you proleptically posting morons realize that I said nothing in favor of anthropogenic global warming? I do not believe the CO2 hypothesis and I do not support it.
What I said was (and let me repeat this very slowly, so you’re sure not to miss it this time, you stupid buffoon): If you do not believe that CO2 emissions cause global warming, then by the same token, you should not believe that an insignificant amount of Hunga Tonga water vapor does either.
Does that make sense to you, or are you just a drooling, camp-following pudding-brain who reflexively calumniates anyone who doesn’t subscribe to your ill-conceived, BS explanations?
There are individuals referred to as climate skeptics. These are people who are well informed, have done their research, and maintain a respectful, critical approach to the topic. There are also those I would categorize as denialists. These individuals consider themselves experts, but they severely lack evidence and understanding. They cling to their unsupported, crank theories.
True skeptics get drowned out by the noise created by denialists. The actions of those voices undermine the credibility of the informed skeptics.
Genuine skeptics should consider adopting the term “denialist” to describe those who are harmful to their cause.
Maybe, however it is always one side who calls the other ‘denialist’. It depends on the subject i guess.
One can for instance deny or reject AGW and use proper arguments. Technically you are a denialist. But it is a little bit like ‘conspiracy theorist’, it is a dismissive characterisation used to label the opposition as stupid which is then used by that group as indicators of THEIR stupidity. And so on..
If someday someone challenges and successfully falsifies the greenhouse effect, I’d be fine with that. They shouldn’t be labeled a ‘denialist’ as you suggest, because they would be informed and presenting evidence.
On the other hand, people who just repeat contrarian strawman arguments shouldn’t be taken seriously. ‘Denialist’ is a fitting term for them.
It honestly boggles my mind that some people think climate scientists expect global temperatures to rise every single year just because of CO2. And because it doesn’t, that somehow ‘falsifies’ AGW. I mean, good freaking god.
I really like your approach. It’s …mmmm…insightful. Do go on and add a few more interesting adjectives and creative wordplay.
So far “camp following pudding brain” is my favourite. It’s a breath of fresh ‘air’ to otherwise technical discussions/ conversations..😊
You are forgetting that water vapour is Defacto controlling atmospheric temperatures through the solar induced hydrological cycle. Atmospheric CO2 is a non-event now re IR lower tropospheric heat absorption and thus warming due to it’s 90% saturation capacity.
“Please take the Hunga Tonga garbage and blow it square-ways out whatever orifice you are speaking from.”
” . . . from which you are speaking,” you addled boob.
. . . but what about the 14–16 months that it took for any possible “warming” resulting from the HT injection of water vapor into the troposphere and stratosphere to appear in the UAH GLAT monthly datasets?
I’d have thought that was obvious. The prompt effect of tropical eruptions is cooling. It typically lasts one to two years for big eruptions, eg Tambora, Krakatoa, El Chichon and Pinatubo. Once that effect subsided, and water spread out across the stratosphere, the warming kicked in, as predicted by specialists at the time.
In the Tongan case, the ENSO cycle also affected timing. But mostly the warming effect from massive injection of water into the stratosphere made the submarine eruption different from other large, subaerial eruptions.
Sorry, that is not at all correct. I invite you to read the previous WUWT postings by Willis Eschenbach (https://wattsupwiththat.com/2019/01/26/spot-the-volcano-1815-edition/ and https://wattsupwiththat.com/2018/06/25/stacking-up-volcanoes/ ) for data-backed facts falsifying that volcano eruptions cause overall cooling in GLAT temperatures.
In particular, Willis’ bottom line conclusion after an impressive data analysis in the second reference URL is:
“On average there is no global temperature response to the 24 largest eruptions.”
Again, this is not true. But furthermore I am confused by you first asserting that the submarine HT eruption would be comparable to the land-situated Tambora, El Chicon and Pinaurbo eruptions in causing cooling, but then subsequently stating that “made the submarine eruption different from other large, subaerial eruptions.”
BTW, love your use of the term “subaeriel eruptions” when the adjective “land-situated” would have been a more proper distinction.
Finally, and perhaps most pertinent to your comment, please note that the UAH monthly data plot of GLAT shows essentially zero cooling following the January 2022 eruption of the Hunga Tonga submarine volcano.
Willis is not an atmospheric physicist nor any other kind of scientist, but at best an uneducated polemicist with a dull axe to grind. Best to ignore his ignorant blather about volcanoes.
That the eruptions I cited caused cooling is a scientific fact, ie an observation of nature. Large tropical eruptions always cool the planet. No exceptions have been recorded.
Here is the departure for the Year Without a Summer which Willis so baselessly denies:
Study after study showed the effect on agriculture of cooling from Pinatubo. So too did tropical observations:
That Tonga was submarine meant it cooled less than a comparable subaerial eruption would have, but it was so gigantic that its effect still rivaled Chichon and Pinatubo.
“Subaerial” is the correct term. Some of the cited eruptions were from volcanoes on land, but others were oceanic islands.
Real earth scientists predicted in 2022 exactly the effects observed since then, contrary to ignoramus buffoon Willis’ clownish, cartoonish complete intentional misunderstanding of atmospheric consequences of large tropical volcanic eruptions.
Two of numerous from 2022:
https://www.nature.com/articles/s43247-022-00652-x
https://agupubs.onlinelibrary.wiley.com/doi/abs/10.1029/2023JD039298#:~:text=of%20the%20atmosphere.-,The%20January%202022%20eruption%20of%20the%20Hunga%20Tonga%2DHunga%20Ha,stratospheric%20water%20vapor%20by%2010%25.
My esteemed colleague and frequent contributor here Javier on the effect of Tonga 10 months ago, right after its peak:
https://judithcurry.com/2024/07/05/hunga-tonga-volcano-impact-on-record-warming/?amp=1
He’s the WUWT regular on whom to rely, as a genuine scientist in relevant disciplines, not the megalomaniac loser Willis, who psychotically bills himself as a “polymath”, while displaying total, profound ignorance in every relevant field (massage certificate and lowest of CA system psych BA don’t count).
Milo, with your comment:
you have confirmed for all to see the wisdom of Socrates who is attributed to having said:
“When the debate is lost, slander becomes the tool of the losers.”
You can also benefit from looking into the logical fallacy of “an ad hominem attack”.
However, to date Javier Vinós has been strangely silent on the claimed continued persistence of the HT volcano injection of water vapor into the stratosphere causing the spike in “global warming” seen in the UAH GLAT data from mid-2023 until today.
Perhaps this is due to his previous comments:
— “There have been a number of eruptions with VEI 5 or higher in the last 200 years, although not all of them have affected the global climate
. . . Of course, we cannot conclude that the warming was caused by the volcano” . . .
” . . . I do not have to explain why the effect took 18 months because nobody knows that . . . our ignorance of the climatic effects of volcanoes. It is not up to me to explain something nobody knows.”
(https://wattsupwiththat.com/2024/07/09/hunga-tonga-volcano-impact-on-record-warming/ )
Furthermore, in reply to this post by mohatdebost:
“Let me propose a test: if water vapor was responsible for the heat records in 2024 as posited by Javier, then we should observe rapid cooling in the next two years. We should postpone this debate until we have more observations.”
Javier replied:
“I’ve been thinking about that and I will be introducing the Hungatongameter in a few days in my X account to measure the effects of the volcano over time.
@JVinos_Climate”
(https://wattsupwiththat.com/2024/08/24/climate-change-weekly-516-hunga-tonga-eruption-behind-record-warming/ )
No such “rapid cooling” has yet occurred, as evidenced by the plot of UAH GLAT temperature data provided in the above article.
Also, a Google search does not reveal the current presence of a “Hungatongameter” attributed to Javier Vinos.
Lot’s of words and a nice graph of variations in “Solar Radiation Transmitted”, but you completely overlook that there are feedback effects that effectively decouple temporary solar dimming caused by volcano ejected aerosols from directly causing GLAT cooling.
Among such feedbacks are that any increase in clouds or aerosols particulates that reduce absorbed sunlight necessarily means that those increased clouds/aerosoles will also reduce (“dim”) Earth’s surface radiation to deep space, thus contributing to Earth “warming” (actually losing less heat over time than otherwise) on a global average of 12 hours out of every 24 hours.
OK, got it . . . I’ll need to do some research on all those “aerial” and “super-aerial” volcanoes and get back to you.
/sarc
It should have been a year of cooling in Australia with all the cloud fronts we have had especially in Queensland. However, as we went from Summer into Autumn according to the BoM data we should have cooled but the UAH data says we have been warming! This does not seem right, what’s going on with this current global peak that should be declining given the weak ENSO?
As noted, the peak was more than a year ago, with marked declining since then.
Are we boiling yet!. 😂
Not yet Mr Frog.
Did you find that pee pee tape?
Simon has been listening to Gutty from the UN.
Thinks 100F in an enclosed lagoon is boiling.. .. hilarious
When the water gets too warm, frogs climb out.
-18. I gotta say I am humbled and proud of that. Thank you to everyone. As they say….I must be over the target……
What target? Do You target people you disagree with? Is that part of “The Cause”?
With a perfect track record of being wrong about everything, every single time, are you surprised no one takes your predictions seriously?
https://wattsupwiththat.com/2022/04/24/earth-days-failed-predictions-of-52-years-ago-the-amazing-environmental-improvements-that-have-occurred-since/
Nope… don’t remember predicting that one. In fact I don’t really do predictions.
Er, you did just that by calling another poster a frog in a warming pond.
The warming in question is an observation rather than a prediction.
Anytime there is °C per decade, per year, per century, describing what the future may hold, there is a prediction.
Only if we take a dip in Al Gore’s oceans.
Where ARE these oceans, by the way?
Under the ground, where it’s a million degrees.
the SOI moves again to the La Nina
It is in a La Nina area (although weak) now and has been since Aug 2024. You can look it up here https://www.longpaddock.qld.gov.au/soi/monthly-graphs/. BOM seems to be incapable of looking up this data although they are responsible of the measurement (at least at Darwin)
A little short of half a century of UAH recordkeeping and we have a global trend of atmospheric temperature at 0.15 C/decade. Unless something changes dramatically an extrapolated 1.5 C/century is chump change. How many trillions of dollars do we need to change that estimate to 1.4 C by 2100?
Why would “we” want to?
Because “we” want to inflate the economies of the world to pay the off the debts of the imaginary money we’ve been spending.
It is 2.2 C/century over land. But there will be more centuries.
Surface station data is too tainted by bad sites, urban warming and mal-adjustments to have any meaning whatsoever.
One of the least contaminated sites in the world, Valentia, shows the the decade from 1930-1939 was warmer on average than any other decade since.
“Surface station data…”
How many more times does it have to be explained to you that UAH is not based on surface station data.
You really think urban warming doesn’t affect the temperature over land. That is funny.
We know that there is no CO2 signal in the UAH Ocean data, there is also no evidence of any CO2 warming over land…
… so any difference between land and ocean must be from urban warming.
One of the least contaminated surface sites in the world, Valentia, shows that the decade from 1930-1939 was warmer on average than any other decade since.
I was pointing out that UAH is not using “tainted” “surface station data” as you were implying.
The point about UHIs is they are local affairs that can add a bias to individual stations. The main justification for satellite data is that it measures the land evenly so is not tainted by urban areas.
If you think there is enough heat rising from cities to affect the global land area then that is not “tainting” the data. It’s the correct temperature. If land is warming by 0.22°C / decade, that’s the rate it’s warming, even if it’s all coming from growing cities.
“We know that there is no CO2 signal in the UAH Ocean data”
Who’s “we”.
“… so any difference between land and ocean must be from urban warming.”
You forgot the sarcasm tag.
The fastest warming land area regionally is in the Arctic, according to UAH (+0.28C per decade since 1979).
All that ‘urban heat’ from igloos, apparently.
The Arctic is a pretty small area. Maybe 20% of the surface area. I wouldn’t think +0.28°C per decade would make a large difference in the entire globes ΔT.
I still want to see land stations in the Arctic that have this warming. Somehow I don’t see the Arctic Ocean warming this fast. Let’s be honest, many places say the Arctic is warming about 3 times as fast as anywhere else. That would make “anywhere else” have a warming of +0.09°C per decade or +0.9°C over a century.
Doesn’t sound CAGW to me!
Correct me if im wrong but i think the graph reflects the extrapolations of satellite, surface stations and balloons measurements. It is a construct because satellites do not directly measure temperature for obvious reasons.
And because of that i don’t take that graph as the end all..
Yes, there are lots of charts that show it was just as warm in the recent past as it is today. Just about any original, written, regional charts shows the very same thing.
The actual historic, written, regional temperature data shows that CO2 is a minor player in determining the Earth’s temperatures. So minor as to be undetectable since it is no warmer today with more CO2 in the air than it was in the recent past with less CO2 in the air. CO2 appears to have had no obvious effect on the Earth’s temperatures.
Which is the reason for the creation of the bogus, bastardized Hockey Stick, Instrument-era, global temperature chart, created to specifically show a connection between CO2 and rising temperatures.
It’s the only “evidence” the Climate Alarmists have to show a connection between CO2 and the Earth’s temperatures and it is completely made up out of whole cloth. It is a BIG LIE created to promote fear of CO2.
The only data the Hockey Stick chart creators had available to them was the original, written, regional temperature data. The problem is the original data has a benign temperature profile where it was just as warm in the past as it is now, but the bogus Hockey Stick chart creation erased this benign temperature profile and substituted a “hotter and hotter and hotter”, “decade after decade after decade” temperature profile showing temperatures increasing as CO2 increased.
The question is: How do the Temperature Data Mannipulators get a Hockey Stick “hotter and hotter and hotter” temperature profile from regional data that does not have a “hotter and hotter and hotter” temperature profile? Answer: Climate data fraud.
Here’s a comparison of a written, regional chart, the U.S. temperature chart (Hansen 1999) beside a bogus, bastardized Hockey Stick chart.
All the original, written, regional temperature charts have a similar temperature profile to the U.S. chart. None of them have a “hotter and hotter and hotter” Hockey Stick temperature profile.
The Science Fraud should be obvious to everyone.
The U.S. temperature profile on the left is the actual temperature profile of the Earth. The bogus Hockey Stick profile, on the right, is the BIG LIE of Alarmist Climate Science.
So how do you get a Hockey Stick temperature profile out of data that has no hockey Stick profile. Answer: You cheat and lie.
How much damage has this BIG LIE caused?
“Crickets” from the Climate Alarmists.
I’m not surprised. It is always this way. The Climate Alarmists have no answer for how you get a Hockey Stick temperature profile out of temperature data that does not show a Hockey Stick profile.
The Hockey Stick chart is the only “evidence” the Climate Alarmists have and they can’t defend its creation. So which Climate Alarmists are disingenuous, and which are True Believers in the Hockey Stick Chart?
What’s it like psychologically when you are unable to defend the only “evidence” you have showing a correlation between CO2 and temperatures? Shouldn’t that make a person question their position? I would think so, but apparently not, as the Climate Alarmists continue to pretend the Hockey Stick chart represents reality.
Some people just can’t admit they are wrong and have been fooled by the Hockey Stick Chart Temperature Data Mannipulators.
The bottom line: Climate Alarmists can’t defend their position that CO2 and temperatures correlate. Not a peep out of them. It’s kind of pathetic when you think about it.
Climate Alarmists must squirm when this subject is brought up. Climate Alarmists don’t like to have their Net Zero worldview challenged, especially when they have to hold their tongue and not comment for lack of a good answer.
Which “land”?
(Please don’t say all or “averaged”),
Those places don’t actually exist anywhere, and have no application the real world.
Here’s my graph showing UAH trends up to March 2025.
Anything orange is warming at 2°C / century or more. Darker shades of orange are at least 3°C / century.
You KNOW all of that is because of El Nino events.
Why keep up any other pretence.
No evidence of any human caused warming at all.
You’re projecting again. You think you can explain warming by El Nino events, which in your mind means you “KNOW” it. Then assume that everyone else shares your delusion.
So West Antarctica is cooling at 2⁰C/century? I thought it was melting?
I’ve been collecting trends from a number of land locations over the globe. There is no global hockey stick in a vast assortment of stations. Stations from Africa, Japan, Europe, Greenland, and U.S. From our Aussie friends, it sounds like Australia has similar stations.
You want to really, really convince anyone that you know of what you speak, start showing local stations , without UHI, that raise the average up to 1.5 to 1.8°C. Don’t cop out with a deflection like “the temperatures speak for themselves”. Show actual data in a time series of absolute temperatures.
This.
Why does warming never seem to show up in actual, recorded surface temperature records, absent UHI contamination?
“There is no global hockey stick in a vast assortment of stations.”
That’s exactly right. There is no hockey Stick temperature trend in the original, regional temperature data.
Phil Jones and his cronies just made the hockey stick temperature profile up out of thin air.
There is no Hockey Stick in the original data.
Based on climate history of interglacials for the past 1.2 million years, coming centuries will see the end of the brief Modern Warm Period cycle and return to the secular cooling trend of the past 5200 years, headed toward the next glacial interval.
Worrisome that each warm cycle since the Holocene Optimum and Egyptian WP has been less warm, ie peak of Minoan higher than Roman, which was higher than Medieval, which was higher than the Modern so far.
If it is, that just shows the effect of man-made heat in transit to the depths of outer space.
Or maybe you believe that thermometers get hotter for some other reason?
I’d like to see your explanation, but you don’t have one, do you? What a pity!
LMAO, so it’s only ‘Global’ when you want it to be?
When someone tries to tell me that the UHI is localized and regional I remember satellite pictures like this and know they are full of scheisse.
edit: fyi, as someone who lived in Germany in the 70’s, I doubt you wanna play this game with Europe….js.
That may happen if we are lucky, but not this century as the IPCC has predicted- 2.2C would be cruisy!
But you won’t be here to take off your coat to adapt anymore.
Only because it begins in 1979. If it began in 1950 it would be even less.
If it began in the 1930’s there wouldn’t be an upward trend in the temperatures, since the 1930’s were just as warm as today.
Why should we assume that temperatures will continue to climb for the rest of this century?
That’s not how it worked in the past. In the past, the temperatures warmed for a few decades and then they cooled for a few decades and then the pattern repeats. Why won’t this pattern repeat again?
There is no evidence CO2 is causing the current warming, just a lot of assumptions that it is.
Methinks some people assume too much.
The current temperatures are cooler than the high points of 1998, 2016 and 2024.
Grok’s assessment of this post.
Assessment1. Data and Source Reliability
2. Content and Context
3. Watts Up With That’s Bias
4. Why Omitting Long-Term Climate Change Effects Is MisleadingThe post’s failure to mention long-term climate change effects, especially greenhouse gas contributions, is misleading because:
5. Limitations
ConclusionThe post accurately reports UAH’s April 2025 anomaly (+0.61°C) and trend (+0.15°C/decade) from a reliable dataset. However, omitting long-term climate change effects misleads by:
Don’t deny Grok’s intelligence, peace out
So the planet is warming.
How much, for how long, and what will be the consequences are uncertain.
The intelligent question is, are we doing the right thing?
“Redeia, which owns Red Electrica, warned in February in its annual report that it faced a risk of “disconnections due to the high penetration of renewables without the technical capacities necessary for an adequate response in the face of disturbances”.
“Investment bank RBC said the economic cost of the blackout could range between 2.25 billion and 4.5 billion euros, blaming the Spanish government for being too complacent about infrastructure in a system dependent on solar power with little battery storage.”
https://www.reuters.com/world/europe/spains-power-generation-nearly-back-normal-after-monday-blackout-says-grid-2025-04-29/
“So the planet is warming.”
It does that periodically.
To my point: “How much, for how long, and what will be the consequences are uncertain.”
Uncertain, hence these endless discussions about the weather.
The consequences of Net Zero on the other hand, are becoming less uncertain.
Grok made a reasoned response to the UAH data. This gives me and you something to think about. Grok didn’t attack, insult, degrade others. I appreciate the point of view and the tone of this post. We can debate the specific causes but the fact as Grok states is The post accurately reports UAH’s April 2025 anomaly (+0.61°C) and trend (+0.15°C/decade) from a reliable dataset.
I only need point out this from JK’s post of Grok’s so-called “assessment”:
“However, omitting long-term climate change effects misleads by:
— Implying natural variability explains warming, ignoring CO2’s role.
— Downplaying impacts like sea level rise or extreme weather.
— Reinforcing skeptic narratives on a biased platform. For balance, consult NOAA, GISS, or IPCC reports . . .”
Any AI bot suggesting that I consult GISS or the IPCC for “balance” is outrageously insulting to me.
“Reinforcing skeptic narratives on a biased platform” is a direct attack on WUWT.
Pity that you’ve apparently gone over to the dark side so easily.
Which is completely meaningless. Measuring increased temperatures due to man-made heat is a complete waste of time, effort, and money.
Any fool hopefully knows that thermometers are designed to respond to heat, not gas concentrations. Air temperatures at airports may be useful for deciding available takeoff power for aircraft, and precious little else. Even so, any intelligent pilot will rely on calibrated sensors fitted to his aircraft, rather than an instrument located in an arbitrary location, subject to the whim of local environmental factors.
I’m sure why so many people are obsessed with measuring and recording useless data. What about wind speed and direction? Cloud height, cover, and type? Atmospheric pressure? Wet build thermometer? Precipitation?
All eventually part of climate, but apparently not quantifiably affected by the mythical GHE. A complete load of horse manure – but not nearly as useful.
Grok made a reasoned response to the UAH data.
You are being sucked in. Grok has zero ability to reason anything. It regurgitates what other morons have written and presumed.
Here is the evidence..
The IPCC has never been able to detect a human warming signal. They ADMIT as much in their first report. ….Quote we have been unable to find the expected signal”)
They ASSUME it is human co2 with 100% confidence and with 100% lack of any measurement or observation of said human induced warming.
Grok sounds just like a Climate Alarmists.
No doubt, his programming came from a Climate Alarmists.
Indeed. It is ALL assumed and attributed then posed as factual. THAT is the true crime. The only fact is that it is fundamentally unscientific..
Somebody should ask Grok how a Hockey Stick temperature profile is derived from original, historical temperature data that has no Hockey Stick temperature profile.
I take issue w the word ‘reliable’. It is a value laden word. I would call the graph reliable but are those datasets really reliable?
So, how does Grok explain the early warming in 2010-2045 before CO2 rose substantially?
How does Grok explain the Minoan, Roman, and Medieval warm periods?
No matter Grok’s “IQ”, it still suffers “Garbage in/Garbage out” errors like any program.
Grok asserts CO2 warming, because that is what it was taught during training.
“So, how does Grok explain the early warming in 2010-2045”
Must be a typo. Today is in the year 2025.
It just puts together a load of garbage selected from various parts of the big garbage heap.
Grok….
The early 20th-century warming from 1910 to 1945 is attributed to a combination of natural and human-related factors, though CO2 increases were not yet significant. Key drivers include:
These are not measured facts, they are guesses. Guess where they came from?
Again, guesses. Not one mention of measurable facts.
More mumbo jumbo assumptions. AI’s are not intelligent, they rummage through a whole lot of stored information and regurgitate whatever comes up most often. Not an original thought ever occurs.
“Grok asserts CO2 warming, because that is what it was taught during training.”
That’s right. It is just repeating what it was told. Its opinion is certainly not based on any established facts.
I think he was probably talking about the period from 1910 to 1945.
He said it was before CO2 rose substantially.
And he’s right, the warming from 1910 to 1940 was equal in magnitude to the warming today, but with less CO2 in the air then than now.
Here is the U.S. regional chart showing the warming:during that period.
The 1910’s were some of the coldest years since the end of the Little Ice Age around 1850, and as you can see, the cooling that took place during the 1970’s was equally cold to the 1910’s and is what caused some climate scientists to think the Earth might be entering another Ice Age. But that didn’t happen. Just like in the 1910’s, the temperatures warmed starting in the 1980’s. No Ice Age this time around.
When using Grok, you might want to keep in mind what Grok explained to me — especially the third point about serving the consensus.
Says it all, really.
That is what i meant by asking further. People who want to weaponise their argument stop when they get the answer they want. That makes sense. Real skeptics try and counter their own arguments. Science is supposed to do that by default but rarely is nowadays. When presenting a Phd it is the task of the witnesses to pose questions that might go contrairy of the thesis. This is what peer review really should do but the contrary seems to be the case.
It’s interesting how much bias is absorbed during training. When I first started to push for research that wasn’t government sponsored it initially referred to that research as fringe. When I asked if all non-government sponsored research was fringe, I leaned that Grok knew how to grovel as well.
Any idea why Grok politely and professionally refers to Dr. John Christy by his title as well as his first-name, but his partner is simply “Spencer?” We have been presented with evidence previously that the LLMs can be biased and even ‘hallucinate.’ Can we trust an evaluation that demonstrates inconsistency in references to sources?
Grok states “No explanation of why UAH differs from surface or RSS data confuses warming’s scope.” Is an explanation necessary when it is obvious that “surface” readings are at a standard height of 2 meters and the calculations for Spencer and Christy are for the “lower troposphere,” obviously at a higher elevation than the troposphere soundings? Perhaps it should be RSS that explains why their results differ from Spencer and Christy and standard meteorological measurements.
Grok further states, “This is accurate but omits long-term drivers like greenhouse gases, critical for understanding sustained warming.” This is an unsupported assumption by Grok that clearly reflects its bias.
Grok continues with, “A table shows regional anomalies (e.g., tropics at +0.54°C, Arctic at +0.44°C), but the post doesn’t analyze these, missing chances to discuss polar amplification or variability.” Grok opens itself up to the exact same criticism because it doesn’t set the record straight with citable references. Realistically, some choices have to be made on the length and depth of comments, but to make the same oversight it accuses Spencer and Cristy of is hypocritical. I note that it is only Western Antarctica that is exhibiting potential “polar amplification.” Perhaps Spencer and Christy are being prudent and not making assumptions that Grok indulges in.
Grok complains, “Watts Up With That is a climate skeptic blog.” By claiming that WUWT is a “climate skeptic blog” it is again demonstrating a bias. It might be more appropriate to say that WUWT has a reputation of being skeptical of anthropogenic-induced climate change, but both are little better than ad hominem attacks. What is at issue is the veracity of claims made that support or question the influences on climate change.
I will conclude with Grok’s observation, “The post’s failure to mention long-term climate change effects, especially greenhouse gas contributions, is misleading …” This is a monthly update on an ongoing study of lower-troposphere temperatures. It would be premature to support Grok’s biases. If Grok is willing to go out on a limb and make claims that are open to attack, so be it. I think that Spencer and Cristy are doing a public service that should be appreciated, not deprecated.
“Perhaps it should be RSS that explains why their results differ from Spencer and Christy and standard meteorological measurements.”
I think this is because RSS uses a satellite that reads “hot” according to Dr. Spencer, and UAH does not use that data for that reason, and that is the difference between the RSS readings and the UAH readings.
There is not really much of a difference, a few tenths of a degree, between any of the temperature readings from satellite or ground.
AI relies on information from recognized “authorities”(grant dependent consensus scientists) published on the internet. Non-climate alarmist aspects of the climate don’t get funded and consequently not published so of course all AI will display that inevitable bias. it can’t be any other way.
Yes!
The fundamental—perhaps insurmountable—critical failing of current AIs is that these human-programmed artifices have no real way to distinguish truth from falsehood.
Currently, they all defer to majority consensus of published information to establish “truth” (appealing to the preponderance-of-evidence viewpoint) but as demonstrated by Newton, Copernicus, Kepler, Einstein, Heisenberg, Wegener, and many other great thinkers—as well as carefully explained by Thomas Kuhn in his book The Structure of Scientific Revolutions—the greatest expansions of truth in science result from those that challenge the consensus viewpoint(s) of their time.
Do we, the WUWT readers and commenters, really want or need to see LENGTHY reposts of the outputs from any of numerous available AI bots?
I vote no!
Especially when seeing these comments given in the “Conclusion” paragraph :
“However, omitting long-term climate change effects misleads by: . . .
— Reinforcing skeptic narratives on a biased platform. For balance, consult . . .”
Grok’s “intelligence” is truly artificial and lacks credibility due to its clearly revealed, programmed-in biases.
Freedom of speech absolutist you are, right?
Did I mention anything—anything at all—related to freedom of speech? No.
Hint for you: I only referred to WUWT readers and commenters expressing a desire to see lengthy reposts of biased outputs from AI bots posted here on WUWT.
You are free to exercise your “freedom of speech” (as granted here in the USA) with respect to repeating AI BS OUTPUT, but don’t expect me to give it any particular attention.
Lol. What a fool.
I hereby announce Grok’s lack of intelligence.
you state:
“Don’t deny Grok’s intelligence”
yet Grok states :
“your initial question didn’t signal skepticism so I served the consensus”
apparently while Grok’s intelligence is artificial, it is still better than yours.
You state the importance of greenhouse gas impacts, yes they are; but water vapour comprises 95% of the impact both positive and negative, whilst CO2 is about 3%. Given the human related % of total CO2 is between 3-6%, we therefore have virtually none to an insignificant legitimate AGW impact. This is basic physics, the sun is in control of global temperatures not us.
Grok sounds like a Climate Alarmist.
Who programmed you, Grok?
Be careful about putting your faith in Artificial Intelligence answers.
Here’s an example of AI lying:
https://timesofindia.indiatimes.com/technology/tech-news/metaai-is-filled-with-lies-says-conservative-activist-robby-starbuck-takes-whatsapp-ai-chatbot-to-court/articleshow/120822472.cms
MetaAI is filled with lies, says Conservative activist Robby Starbuck, takes WhatsApp Ai chatbot to court
May 2, 2025
end except
As of yesterday, this AI is still telling the same lies about Starbuck, even though Meta has written to him and apologized for the lying. The AI is suggesting that Starbuck be locked up in jail!
I think Starbuck is going to get a lot of money out of Meta.
People should ask this AI: Who is: Your name here.
You might be surprised at the answer you get. Robby Starbuck was. You might be in line for a big lawsuit settlement, too. 🙂
Grok is not ‘intelligent’. In this case it follows the standard GHE linked to Co2 line and poses a lot of ‘disinformation’ based on that in the media. I would bet that, when you put it in thinking mode and ask a bit further it will reject the certainty of the role of Co2 in Earth’s atmosphere. Simply because when you focus on that it remains a hypothesis that cannot properly be substantiated.
This is the equal 3rd warmest April in UAH history. Tying with The strong El Niño year of 2016 and statistically tied with the other strong year of 1998.
My simplistic projection now estimates 2025 at 0.48±0.15°C. There’s a 74% chance that 2025 will be warmer than 2023. But given the way the globe is behaving at the moment, I’d take any projection with a very large pinch of salt.
“74%”
Correct.
Strictly speaking it was 74.12%, but some people can’t cope with too many decimal places.
The more accurately you can measure the effect of man-made heat on thermometers, the warmer and fuzzier you’ll feel.
Go for it.
It’s funny you bring this up because the significant figure police have already made an appearance in this this very blog post. And once again they are criticizing the display of a value that is compliant with their own preferred rules. It doesn’t matter how you report the value. It will always be wrong no matter what. I’m almost at the point where every value I post will include all IEEE 754 digits and let the WUWT community figure out what they want to do with them.
Is the globe mis-behaving at the moment then?
Is a stern talking-to in order?
Or should we beat the living crap out of it?
It’s so trying for us humans as self-appointed custodians of this planet.
Maybe if we all paid more we could get better help?
“Or should we beat the living crap out of it?”
That seems to be the most likely option.
Missed the sarc?
I hoped it was obvious.
… and still not one single bit of any evidence of human CO2 causation.
Something that I haven’t seen anyone comment on is that the last El Niño has an anomalous spike in temperature with the highest-to-date peak and a full-width, half-maximum that is noticeably wider than any of the previous El Niño events. It doesn’t prove that the Hunga Tonga eruption is responsible, but it begs to be explained.
We’ve been talking about it since 2023. This current peak seems different to other El Niños. Some people like to jump to conclusions about it, I’ve always said we will have to wait for more evidence.
Started earlier, and much more protracted, but about the same peak addition as 1998 El Nino
Big variation in Stratospheric WV and its still there…
Do you deny that extra water vapour slows down cooling…
That would destroy the whole AGW myth. !
How could anyone have been talking about a peak that didn’t yet exist in 2023 nor have been fleshed out to estimate the FWHM until recently?
The jump began in earnest in July of 2023 with the September value being decisively record breaking for the UAH period of record.
I mentioned the “most recent El Nino spike,” and Bellman replied “We’ve been talking about it since 2023.” By July of 2023 temperatures were increasing, but it wasn’t obvious yet that it would peak, or to what extent. It was about a year later before one could assume it had peaked, and a few more months before it became obvious that the width was untypical. Talk is cheap.
Right. The spike began in 2023. And if you’ll remember it was discussed that the timing of the spike was earlier than typical. If you look at my model below you’ll see that the early phase of the spike falls outside the 2σ envelope. We were talking about that in 2023.
Can you tell the sex of a chick before the egg hatches?
No, I personally cannot. What does a chicken egg have to do with anything being discussed here?
I didn’t we were talking about the peak in 2023, just that temperatures were warming out of all expectations. Here for instance is July 2023 UAH
https://wattsupwiththat.com/2023/08/02/uah-global-temperature-update-for-july-2023-0-64-deg-c/
New Record High Temperatures and a Weird Month
July 2023 was an unusual month, with sudden warmth and a few record or near-record high temperatures.
Since the satellite record began in 1979, July 2023 was:
These results suggest something peculiar is going on. It’s too early for the developing El Nino in the Pacific to have much effect on the tropospheric temperature record. The Hunga Tonga sub-surface ocean volcano eruption and its “unprecedented” production of extra stratospheric water vapor could be to blame. There might be other record high temperatures regionally in the satellite data, but I don’t have time right now to investigate that.
Clyde,
Do you presume at El Nino events must be separated by some period?
What mechanism prevents a merged El Nino, that is two of them close together. A similar high, broad peak exists in the lower troposphere UAH temperature anomalies over Australia.
More later. Geoff S
Geoff, I don’t presume that there has to be a separation in time, but I haven’t seen any evidence that it has happened in recent decades. That is the point of saying that the unusually wide FWHM is begging to be explained.
You’re correct. Not one single piece of evidence. Rather the accumulation of multiple pieces of evidence.
Not that it matters as you are determined to reject any evidence that contradicts your dogma.
Surely you don’t believe that adding CO2 to air makes it hotter, do you? That would indicate you believe some quasi-religious dogma.
An uneven rise and fall in temperature coinciding with rising co2 concentrations is extremely feeble evidence. The temperature of the atmosphere is governed by the oceans not co2 and ocean heat is governed by the sun not co2.
“…is extremely feeble evidence.”
It’s quite good evidence when it’s what’s predicted to happen based on the current understanding of how the atmosphere affects temperature.
“.The temperature of the atmosphere is governed by the oceans not co2 and ocean heat is governed by the sun not co2.”
Funny. It was only few months ago people here were insisting it was impossible for the sun to affect ocean temperature.
If you want to expand on your hypothesis you need to demonstrate the correlation between the sun and oceans. In particular why were the oceans warming whilst solar activity was declining.
What he’s describing is called short term natural variation. It’s well understood concept that climate models already account for. No climate scientist has ever claimed such fluctuations would disappear.
It must be exhausting wading through the same tired, low effort denialist talking points year after year. Hopefully, you’re finding better ways to keep your minds active than repeatedly swatting down misinformation.
We do not have – and probably never will have – a good enough understanding of heat transfer in the oceans but we do know that the planet is warmed by the sun and that heat is stored in the ocean. Tell me I’m wrong.
The Sun, like all main sequence stars, gets brighter as it ages. [Gough 1981]. yet the Earth is cooler today than most of the last 500 million years. [Judd et al. 2024] This falsifies your hypothesis that the Sun alone is the governing factor.
Look up the word consilience. It describes the ability to make an inductive conclusion from a variety of different evidence. The problem is that much of the evidence are not “facts”, that is, produced from repeatable measurements or observations that are applicable to final inductive conclusion. In other words, each piece of evidence has uncertainty. Those uncertainties add so that the conclusion has uncertainty.
Basically, inductive reasoning is making a simple guess. Deductive reasoning relies on a chain of provable, repeatable facts to reach a conclusion. It is what science is based on, i.e., functional relationships that accurately describe the output from specified inputs.
CO2’s affects on heat are based upon inferences that are not proven facts. Pardon me if I am skeptical about inferential conclusions being scientific truths.
“Look up the word consilience.”
Thanks for the advice, but it’s essentially what I was saying.
“Those uncertainties add so that the conclusion has uncertainty.”
That’s the exact opposite of what consilience means.
https://en.m.wikipedia.org/wiki/Consilience
“Deductive reasoning relies on a chain of provable, repeatable facts to reach a conclusion. It is what science is based on…”
Science uses both, but I’m not sure you understand either.
Regarding CO2, a deductive argument would be, greenhouse gases cause warming. CO2 is a greenhouse gas, therefore CO2 causes warming.
An inductive argument would be we observed temperatures rise when CO2 is added to the atmosphere. This suggests that adding more CO2 will cause further rises in temperature. It increases the probability that the hypothesis that CO2 is a cause of warming.
“CO2’s affects on heat are based upon inferences that are not proven facts.”
There’s no such thing as a “proven fact” in science. At best you can say through deduction is that if the premise is true than the conclusion is true.
Really? So scientific laws are not proven to have functional relationships that have stood the test time? Law’s like Einstein”s energy law, E= mc², or the Ideal Gas Law, or more pertinent, Stfan-Boltzmann law I = σAT⁴. Note, I’m not talking about the revision of constants, but the relationships.
Read this carefully.
https://theethicalskeptic.com/2017/06/25/the-thee-types-of-reason/
I’ll include a small section.
Here is a graph from this web site.
https://ibb.co/Hp7wjKwK
Notice the uncertainty levels of each type.
“So scientific laws are not proven to have functional relationships that have stood the test time?”
Standing the test of time does not prove it’s true. The Earth being at the centre of the universe stood the test of time – but it didn’t make it a “proven fact”.
“Law’s like Einstein”s energy law, E= mc², or the Ideal Gas Law, or more pertinent, Stfan-Boltzmann law I = σAT⁴.”
All good examples of things that are not “proven facts”. To be clear, I’m not disagreeing that they are very likely to be facts or that they are not useful results – just that they can never be proven to be correct. Science is never settled.
“Read this carefully.”
I’d rather not. It looks like the biggest load of psudo-intellectual obfuscated waffle I’ve seen in a long time. If you think the author has a point, try explaining what that is in your own words.
You don’t even see what you have done here. Let’s change the premise just a little.
“An inductive argument would be we observed temperatures rise when U.S. Postal rates increase. This suggests that raising rates will cause further rises in temperature.”
Rising CO2 does not provide any evidence of a casual link. In fact, the observation that warming in UAH appears to have defined steps of increase followed by little to no rise in temperature should lead one to conclude that the steady increase of CO2 is not a direct cause of rising temperature.
One would think that after 50 years or more of research, and billions thrown at models, there would be some progress in finding the components that combine to form the steps and following pauses.
“An inductive argument would be we observed temperatures rise when U.S. Postal rates increase. This suggests that raising rates will cause further rises in temperature.”
You missed the bit where I said “It increases the probability that the hypothesis” is correct.
Certainly you can say that a correlation with postal rates increases the probability that postal rates cause warming – but that’s increasing the probability from almost zero, to still almost zero.
“Rising CO2 does not provide any evidence of a casual link.”
It’s evidence for a causal link.
“In fact, the observation that warming in UAH appears to have defined steps of increase followed by little to no rise in temperature should lead one to conclude that the steady increase of CO2 is not a direct cause of rising temperature.”
So much for you being a “skeptic”. You will dismiss decades of a strong correlation because it doesn’t prove causality – but then jump on a statically insignificant short period as conclusive proof that CO2 does not cause warming.
Statistics don;t work like that. You cannot proof a lack of correlation, only show that there is evidence for a correlation. And in your cases, there is practically no evidence that the correlation has in any way changed over your cherry-picked periods.
“…progress in finding the components that combine to form the steps and following pauses.”
Who needs billions. I keep showing how you can do it with just a few variables and linear regression.
Black dot’s are the observed anomaly. The blue line is the predicted anomaly based the log of CO2, ENSO conditions, and an estimate of the optical depth.
I said “CO2 is NOT A DIRECT CAUSE”.
Your response is a very good example of the errors possible with inductive reasoning. You assumed that I meant CO2 has no role in warming. You have reached a wrong conclusion.
Fine. So do you think CO2 is an indirect cause of warming? If so by what mechanism and how do you think that is indicated by the insignificant pauses?
“Your response is a very good example of the errors possible with inductive reasoning.”
Or maybe it was deductive reasoning based on all the many arguments I’ve had with you and your brother over the years.
I think CO2 is one factor of many. I think many factors are cyclical and their combination generates time varying continuous fluctuations in the atmosphere and at the surface.
I think temperatures are a poor indicator of the heat contained in the atmosphere and it’s translation both vertically and horizontally.
I think the expansion of a volume of air as it is heated results in work being expended making it bouyant. I never see this deducted from the radiant energy diagrams.
I think climate science has no idea about time series analysis. An annual average does have seasonality even if it hidden inside the average value. There is autocorrelation that is never addressed.
Spot on!
You are quite right. Thermometers respond to heat, not CO2.
Tell us how it’s behaving!
I was wondering what Bellman meant by that, too.
Apparently, he sees something out of the ordinary. I wonder what it is.
I’m not sure what the surprise is here. Temperatures have been odd since the middle of 2023. It’s been much discussed here and elsewhere.
It’s only ”odd” in your mind. If it is happening now it has, and will continue to happen forever. Please learn to exercise your imagination just a little. We have been observing this planet for only a couple of seconds.
I wasn’t being critical. Was just wondering what you were referring to.
So, we are talking about a period when there was an unprecedented, undersea eruption of a volcano, and after that, the temperatures have been odd.
I agree, that’s something out of the ordinary.
How xan we fix all this extra warming and make it cold again?
Wait a little while longer, and Mother Nature will take care of it, like She has done in the past.
The Monckton Pause extends to 22 months starting in 2023/06. The average of this pause is 0.70 C. The previous Monckton Pause started in 2014/06 and lasted 107 months and had an average of 0.21 C. That makes this pause 0.49 C higher than the previous one.
My prediction for 2025 from the March update was 0.43 +/- 0.16 C.
My prediction for 2025 including the April update is now 0.47 +/- 0.14 C.
Does Dr. Spencer provide any feature that allows users to view spatial trends for selected time periods (specifically from June 2014 to June 2023)?
It would be interesting to examine such data. I suspect it would reveal a wide range of trends across the globe, given how short that period is. If so, this would further challenge any claims of a ‘pause’.
Not that I’m aware of. You’ll have to do that yourself using the grids available here.
Here is something like what you are interested in from WoodForTrees, but only for global.
It shows a faster trend since 2014, mainly due to albedo changes from fewer clouds.
Thanks for your graph. However, I was actually referring to the one Bellman shared here:
https://wattsupwiththat.com/2025/05/02/uah-v6-1-global-temperature-update-for-april-2025-0-61-deg-c/#comment-4068216
That shows temperature trends from December 1978 to the present, but I’m specifically interested in seeing the map for the period from June 2014 to June 2023. If Bellman happens to be reading this, I’d appreciate it if he could share that.
Sorry for the delay. Yes here’s the trends over that period
Note, I’ve had to widen the scale. A few places cooling at over 2°C / decade, some place warming even faster at 2.2°C / decade. The biggest changes are in the pacific which I assume is down to the changing ENSO conditions.
Thanks. This is very helpful.
The fact that you had to widen the time scale is actually quite revealing. It suggests that this particular period is too noisy to draw strong conclusions.
we know that regions like Alaska, much of Canada, and the western U.S. are not experiencing long term cooling at the rates suggested by that chart as well.
Even on a global scale the trend uncertainty for a 10yr period is on the order of ±0.3 C.decade-1. The uncertainty for a trend for any one of the 10368 cells in the UHA grid is likely to higher. I wouldn’t be surprised if many of those cells exceed ±1 C.decade-1 over the same 10yr period. My point is that you are probably correct in that the signal-to-noise ratio is too low to draw any definitive conclusions for many of the regions here.
That is nice Bellman, can I ask how you made it?
The eq. Pacific negative changes were due to the triple-dip La NIña.
This is also the area where cloud fraction/albedo changed the most.
It is also interesting to note that…
The trend since Monckton’s first big pause starting in 1997/01 is +0.17 C.decade-1.
The trend since Monckton’s second big pause starting in 2014/01 is +0.37 C.decade-1.
These pauses were used by some as evidence that the warming had stopped yet with each pause the warming rate since has been higher than that of the overall trend. My hope is that people will view this new pause in a different light and not be so quick to proclaim a halt to the warming.
The so-called ‘pause’ is one of the weakest arguments out there. As far as I know, it fails every test for statistical significance. A textbook example of cherry picking data.
Could you elaborate on that claim?
The 06/2014 – 06/2023 period that bdgwx highlighted is entirely consistent with short-term natural variability.
There’s no statistically valid evidence of a pause. Carbon Brief addresses this thoroughly here:
https://www.carbonbrief.org/factcheck-no-global-warming-has-not-paused-over-the-past-eight-years/
Dr. Spencer writes:
If that +0.15 C per deacde slope ever drops to zero or near it, then a genuine pause in global warming would be worth considering. But until that happens, the data clearly show we are still warming.
I was looking for a defense of the above quote. I don’t see it. A pause is entirely dependent on how it is defined.
I think that you are confusing a short term hiatus with a long-term reversal in trend.
In this case the pause is defined by Monckton. It is the longest period of time walking back from the current month in which the linear trend is <= 0 C.decade-1.
Then are you agreeing that Janet has no defense for her assertion?
I agree with Janet’s assertion. And she posted a defense of it provided by Dr. Hausfather.
I have little respect for Hausfather’s objectivity. In the linked article he basically dismisses the short hiatus because it is terminated by a significant El Nino in 2015-16.
Fine. Then your response should communicate your rejection of Janet’s evidence as opposed to feigning like you didn’t see it.
I find it interesting when temperatures plateau it is due to ‘natural variability’ but higher temperatures to increased Co2. Im not saying you do but it usually comes up in a discussion. Very convenient..🙂
Yes. Over the long term, carbon dioxide plays the dominant role in climate change because, unlike internal natural variability, the radiative forcing from greenhouse gases doesn’t average out over longer periods of time. It accumulates and continues to exert warming pressure on the planet’s radiative budget.
Climate scientists don’t expect global temperatures to rise in a perfectly linear fashion, with each year being hotter than the last.
If this were true the earth would have become a molten rock millions of years ago when CO2 was higher. What stopped that from happening?
Radiation goes up as an exponential, something like T^x. Temperature only goes up linearly. At some point the exponential will set a boundary condition preventing the temperature from going higher, i.e. heat will be lost faster than it can be input from the sun.
How does your “radiative budget” handle this simple fact?
Spot on Tim – no answers to 2 simple questions.
“If this were true the earth would have become a molten rock millions of years ago when CO2 was higher. What stopped that from happening?”
Why on earth do you think that would happen? CO2 doesn’t keep rising temperatures indefinitely. All else being equal the amount of CO2 sets an equilibrium point. Increase the CO2 and you get a higher equilibrium and temperatures rise until it’s reached.
In the past there was more CO2 and it was hotter, but there was never enough to melt the earth. Remember the temperature change is logarithmic, each doubling of CO2 increases temperature by a constant amount. And there were other factors which means everything was not equal, such as the sun being cooler.
“Radiation goes up as an exponential, something like T^x.”
Not that it’s relevant, but that’s not exponential.
“At some point the exponential will set a boundary condition preventing the temperature from going higher”
It doesn’t matter what the function is as long as it’s monotonically increasing. At some point the planet reaches a point where radiation out equals radiation in.
“i.e. heat will be lost faster than it can be input from the sun.”
If that’s happening the planet is cooling until it reaches the equilibrium temperature.
“All else being equal the amount of CO2 sets an equilibrium point. Increase the CO2″
The entire climate alarmism meme is that CO2 will continue to rise indefinitely.
“In the past there was more CO2 and it was hotter, but there was never enough to melt the earth:
That was the WHOLE POINT I WAS MAKING!
Thanks for just repeating what I said.
“Not that it’s relevant, but that’s not exponential.”
Really?
from chatgpt:
——————————————-
Characteristics of T^4:
———————————————————–
from geeksforgeeks.org: “The formula of the exponential function is given as follows:f(x) = a^x
“It doesn’t matter what the function is as long as it’s monotonically increasing. At some point the planet reaches a point where radiation out equals radiation in.”
No, the point is that for a fixed heat input temperature can only go so high before radiation out stope the temperature from going up any further.
“If that’s happening the planet is cooling until it reaches the equilibrium temperature.”
Huh? Equilibrium = cooling? If I heat a metal rod with a propane torch generated from a disposable bottle then sooner or later that rod will reach a point where it is radiating additional heat input from the flame away faster than the propane torch can input more heat. Equilibrium! A boundary condition that keeps the temperature of the rod from going any higher. As that point is reached the slope of the temperature curve will no longer be linear, it will be modulated by the exponential gain in heat loss.
This is where the “radiative budget” method of explaining the greenhouse effect goes awry. CO2 is *not* a heat generator. The sky is *not* on fire. Using mid-range temperature values as some kind of metric for heat gain just isn’t valid when the heat *loss* is an exponential function. As minimum temps go up so does heat loss but at a faster rate than the temperature.
This should be the first clue that the climate models have a major problem. They output a basic linear function for temperature increase as CO2 goes up when they should be showing at least a second order curve. As temperature goes up heat loss goes up faster thus impacting the temperature growth slope.
Climate science and AGW adherents have an obsession with averages and can not move to more accurate trig and calculus functions. Variable time gradient equations would throw sand into the gears of linear regression trends.
“The entire climate alarmism meme is that CO2 will continue to rise indefinitely. ”
Stop making things up. Who says CO2 will rise indefinitely. It’s just not possible.
““Not that it’s relevant, but that’s not exponential.”
Really? ”
Yes, really. As so often you make a simple mistake and then when called out, you double down on your ignorance rather than trying to learn something. You even quote sources explaining it is not exponential.
See?. It’s a polynomial function – hence not exponential. Maybe you were confused by the mention of an exponent, but you quote the definition of an exponential function.
T^4 is a polynomial function, 4^T is an exponential function. They are very different beasts.
“No, the point is that for a fixed heat input temperature can only go so high before radiation out stope the temperature from going up any further. ”
What are you on about? How can a heat input be fixed and at the same time going up?
“Huh? Equilibrium = cooling?”
Not what I said. I said that if the temperature was above the equilibrium point it would cool down to the equilibrium. I’m really not sure how you could fail to get that. You quoted my exact words
This was in response to you saying
Which can only happen if the temperature is above the equilibrium temperature.
“CO2 is *not* a heat generator.”
You are going to have to define what you mean by “heat generator”. I suspect this is going to be just another of your “words mean whatever I say they mean” arguments.
“The sky is *not* on fire.”
How true. Is there a point to that observation?
“Using mid-range temperature values as some kind of metric for heat gain just isn’t valid when the heat *loss* is an exponential function.”
I’m sure you think you are making a point here, but it doesn’t seem to have anything to do with how greenhouse gases work.
“As minimum temps go up so does heat loss but at a faster rate than the temperature. ”
Could you try to rephrase that in a way that makes sense?
“They output a basic linear function for temperature increase as CO2 goes up when they should be showing at least a second order curve.”
They do not. But I think you are getting confused between different things here.
One thing is what happens if you just instantly change the CO2 and then wait for the planet to reach it’s new equilibrium. This should not be linear over time. As the planet warms the difference between in and out reduces and so it warms at a slower rate. Eventually converging at the equilibrium temperature.
The other thing is modelling what actually is happening, which is a steady increase in CO2. As that happens the equilibrium point keeps increasing and the planet keeps warming towards that point. If the rise in CO2 is close to linear than the rate of warming will be close to linear.
“Stop making things up. Who says CO2 will rise indefinitely. It’s just not possible.”
2100 is indefinitely for me. Are you going to still be alive in 2100?
“T^4 is a polynomial function, 4^T is an exponential function.”
As usual your lack of reading comprehension skills are showing. You missed this reference:
[ from geeksforgeeks.org: “The formula of the exponential function is given as follows:f(x) = a^x]
Here is another, from Grok: “An exponential function is a mathematical function of the form
𝑓(𝑥)=𝑎⋅b^x ”
Now tell us where in the definition of an exponential function it says that when f(x) = b^x that b must be a constant?
“2100 is indefinitely for me. Are you going to still be alive in 2100?”
I hope not. But my lifetime does not define “indefinite”.
“As usual your lack of reading comprehension skills are showing. You missed this reference:”
Just keep digging. I know what exponential means. Your reference confirms what I know. I can;t help it if you want to keep demonstrating your ignorance.
“The formula of the exponential function is given as follows:f(x) = a^x“
What do you think x is in the function T^4? Is it T or is it the constant 4?
“Here is another, from Grok“
Try to think for yourself. It will help you in the end.
“Now tell us where in the definition of an exponential function it says that when f(x) = b^x that b must be a constant?”
It’s a constant by definition of an exponential function. b is the base. In the exponential function, b = e. If b was not a constant than the function would have to be f(b, x).
Here are a couple of random references I got from a few seconds searching. I take no responsibility for them, but they are correct:
https://www.cuemath.com/calculus/exponential-functions/
https://byjus.com/maths/exponential-functions/
https://thirdspacelearning.com/gcse-maths/algebra/exponential-function/
Your own sources say f(T) = T^4 is polynomial and f(T) = 4^T is exponential.
And by convention when f(x) = b^x it necessarily the case that b is constant.
BTW…this convention extends to many different equations like y = mx + b or (x^2/a^2) + (y^2/b^2) = 1 or y = ax^2 + b + c and many others.
“Your own sources say f(T) = T^4 is polynomial and f(T) = 4^T is exponential.”
No, my sources do *NOT* say that.
“And by convention when f(x) = b^x it necessarily the case that b is constant.”
Where does the definition say that? Please be specific!
The definitions are vague. They do *NOT* define b at all. There is no reason why it can’t be f(b,x) = b^x where both b and x are variables. It would still be an exponential function.
Too many “mathematicians” are trained that an exponential function is of the form e^x where “e” *is* a constant. But “b” (an acronym for “base”) can change. In fact, for the S-B equation it is “x” that is the constant, not T.
As usual, you two have led this whole issue off into la-la land so you don’t have to admit to the simple fact that if T is a metric for heat in and T^x is a metric for heat out then ΔT will go to zero at some point in time. Neither the radiative budget models of the greenhouse effect or the climate models seem to recognize this simple fact. They both just assume that there is no negative feedback factor affecting ΔT and they just assume that a linear growth in T will occur over time. The climate model outputs show *NO* second order (or higher order) bending over time due to the heat loss being a negative feedback function on temperature rise.
The lack of real world experience of apparently most climate scientists (and their supporting staff of statisticians and computer programmers) just stands out in everything associated with the discipline. It’s obvious that none of them have ever tried to do something as simple as heating scrap silver into a puddle to make an ingot using a propane torch connected to a disposable propane cylinder. At some point the heat lost by the silver prevents the temperature of the silver from reaching the melt point no matter how long you hold the flame on the crucible. ΔT goes to zero and is a curve, not a linear function.
Chew on that a while and tell me I am wrong.
“Where does the definition say that? Please be specific!”
I gave you three specific definitions saying thatbut of course you ignored it.
But if you understood what you are claiming you wouldn’t need to look for loopholes in the definition. The simple fact is that T in the equation T^4 does not result in an exponential effect. T^4 does not grow exponentially with T.
“They do *NOT* define b at all. There is no reason why it can’t be f(b,x) = b^x where both b and x are variables. It would still be an exponential function.”
It would not be “an exponential function” by definition of “exponential function”. At best you could day you were defining a family of different exponential functions with b as the base. But regardless, even if for some reason you wanted to think of temperature as the base of an exponential function, the exponential growth would be on x, in the equation T^x, which grows exponentially with x, which in this case is an unchanging constant. Hence there is no exponential growth in the equation T^4.
“Too many “mathematicians”…”
We get it. You don’t like mathematics so assume all mathematicians, with scare quotes, are idiots who don’t understand the real world. Yet that doesn’t stop you pontificating on mathematical issues, and saying anyone who points out your errors, needs to take some math lessons.
“As usual, you two have led this whole issue off into la-la land so you don’t have to admit to the simple fact…”
Amazing levels of projection there. I made the simple observation in passing that T^4 was not an exponential function, and pointed out it wasn’t relevant to the discussion. You chose to argue the toss and demonstrate your own ignorance in the process.
“the simple fact that if T is a metric for heat in and T^x is a metric for heat out then ΔT will go to zero at some point in time”
Nobody denied it. You keep claiming that scientist think temperature will increase indefinitely once you’ve added some greenhouse gas, but nobody think that. As usual it’s just the voices in your own head, you are arguing with.
The main understanding of global warming is based on the notion of ECS, which means that everything else being equal, if you increase CO2 by a certain amount, temperatures will rise by a certain amount. And this happend for exactly the reason you say scientists don’t understand. Because as temperature increases, energy out increases until you get a new equilibrium.
Everyone supporting CAGW denies T^x goes up faster than T. You deny it every time you try to find linear regression trends from mid-range temperatures that mask the underlying T and T^x relationship. If you find a linear relationship where T^x exists then you have done something wrong. It’s a major clue that the climate models are wrong. And you simply won’t accept that.
“Everyone supporting CAGW denies T^x goes up faster than T. You deny it…”
Please stop lying. If I’ve ever claimed that T^x doesn’t rise faster than T (assuming x > 1), provide an actual quote rather than your usual strawman logic.
“You deny it every time you try to find linear regression trends from mid-range temperatures that mask the underlying T and T^x relationship.”
Just what are you on about? I’ve shown that global temperatures can be approximated by a linear relationship to the log of CO2. I’ve no idea why you think that’s about T being the same as T^x.
It’s really clear at this point you do not understand how this works.
For one thing, over small changes there is little difference between a linear a quintic relationship. That’s the point of that Equation 10. Small uncertainties can be approximated by linear functions. The change in temperature over the last century is, say, about 0.5%. Everything else being equal this would mean a change in radiation of about 2%.
Here’s what the curve looks like over that amount of change
You really need to zoom out to appreciate that there is a curve. Here’s the relationship as x increases to 1.5. That would be equivalent to well over 100°C warming.
But this is still irrelevant. My linear graphs are showing the relationship between current levels of CO2 and current temperatures. If you want to know if that fits the T^4 relationship you would need to know how much CO2 and other green house gases, and all feed backs, have changed the energy balance.
“Please stop lying. If I’ve ever claimed that T^x doesn’t rise faster than T (assuming x > 1), provide an actual quote rather than your usual strawman logic.”
Every time you show a linear response of temperature, e.g. .15C/decade you are denying that T^x heat loss exists.
“For one thing, over small changes there is little difference between a linear a quintic relationship.”
Which means you are trying to apply small changes to large time periods. An approximate liner response over a year is *NOT* an approximate linear response over a decade or century.
“If you want to know if that fits the T^4 relationship you would need to know how much CO2 and other green house gases, and all feed backs, have changed the energy balance.”
What energy balance? The only heat input to the system is from the sun. As the sun inputs heat the temperature will go up with a slope determined by the T^x negative feedback. The higher T goes the greater the negative feedback from T^x, meaning the heat lost will go up faster than the heat gained.
The fact that you continue to use the excuse that temperature tracks the log of CO2 indicates that you are *NOT* looking at the impact of T^x heat loss. The logarithmic response of CO2 coupled with the T^x negative feedback should show that temperature does *NOT* track with the coupled impacts. Again, this is a result of using mid-point temperatures as the temperature to track – which hides the impact of T^x heat loss. T^x heat loss will be MAXIMUM at Tmax during the daily temperature profile. T^x heat loss will be MINIMUM at Tmin. In between those points the heat loss curve is *NOT* linear – but that is what using the mid-point temperature gives as a result when tracked over multiple days.
The evidence is right there staring you and climate science in the face. But both of you adamantly remain willfully ignorant.
“Every time you show a linear response of temperature, e.g. .15C/decade you are denying that T^x heat loss exists.”
So just me, Spencer, Monckton, and just about anyone else who wants to estimate the rate of warming.
“Which means you are trying to apply small changes to large time periods. An approximate liner response over a year is *NOT* an approximate linear response over a decade or century.”
Stop using AI to write your comments – it just comes out as gibberish.
“As the sun inputs heat the temperature will go up with a slope determined by the T^x negative feedback”
Not if the world is at an equilibrium temperature. If you increase CO2, the equilibrium increases and temperature will increase until it converges to the new equilibrium. That’s what the ECS means. That rise will not be linear.
But if CO2 keeps rising at a roughly linear rate, the equilibrium increases at a roughly linear rate, and temperatures increase at a roughly linear rate as it tries to catch up with the moving equilibrium.
“The fact that you continue to use the excuse that temperature tracks the log of CO2 indicates that you are *NOT* looking at the impact of T^x heat loss.”
Your just rambling now. It’s not an “excuse”, it’s just the value I prefer to use, given the ECS is based on doubling of CO2. It makes little difference becasue over these time periods there is very little difference between logarithmic and linear growth.
And I am not looking at the “impact of T^x” heat loss becasue it’s irrelevant to the question of how temperatures are responding to CO2 over this time period. If you think ECS or TCR should not be based on doubling of CO2, you need to explain why, not just claim you think T^4 means it’s wrong. I’m just showing that global warming is compatible with the theory.
Janet S,
Why not?
Some observers note a UAH Lower troposphere temperature pattern of quite flat temperatures interrupted by a few substantial peaks.
What is the mechanism that creates this pattern? How does CO2 control knob theory allow a decade of no significant T change but a continuing, almost constant change in atmospheric CO2 from Mauna Loa? How is that alleged warming effect of CO2 suspended for decades at a time? Why are there intermittent warming jumps that mostly follow the prominent peaks?
It is not enough to say that there are several paths to global warming and that the mixture can come out flat. You need to explain in detail, preferably using measurements with uncertainty estimates attached.
Geoff S
Yes, that is the chosen narrative. Pity it is based on a set of shaky foundations. That Co2 hypothesis cannot be made hard into a theory because the data does not support it. Even on a pure physics basis this causal pattern cannot survive given its context. I dont mind people thinking/ guessing and stating opinions but i resist the claim this is all science. Furthermore, it is clear that the Co2 alarmist play games with what those various temperature graphs mean using ‘climate variability’ if it doesnt go their way. Bugs me how anyone can still confidently state that x amount of Co2 leads to x amount of temperature when seen in context with all the other elements/ variables in this non linear/ partially chaotic system in which you cannot play the lab game.
Ergo: for me, anyone claiming it is scientifically sound is a liar. But i like the diversity of opinion. The issue really is politics and money which go hand in hand..
No, If you look between El Ninos, there is no warming in UAH from 1980-1997 and none from 2001-2015.
It actually cooled from 2017-2023.4
You HAVE to use those El Ninos to create a warming trend, because they are all there is.
El Nino only causes temporary spikes in global surface air temperature. It doesn’t explain the long-term warming trend that’s been ongoing since the late 1970s.
As for the claim that ‘it actually cooled from 2017 to 2023.4’, that is a textbook cherry-pick. Short term fluctuations over such a small window aren’t meaningful when assessing climate.
Also, surface temperature datasets show no such ‘pauses’ between El Niños. Instead, we see a more frequent return interval for record-breaking years: 1998, 2005, 2010, 2014, 2015, 2016, and beyond.
2014 wasn’t an El Nino year, and both 2005 and 2010 experienced influence from both sides of ENSO, averaging out to near neutral conditions overall. So no, the idea that El Niño alone explains the warming trend doesn’t hold up.
“It doesn’t explain the long-term warming trend that’s been ongoing since the late 1970s.”
The El Niño history since 1980 can partially explain it. The 30yr average SST and 30yr integrated MEI (using v1 & v2 together) correlated almost perfectly since 1980. This image is from 2018.
However as MEI has declined since the late 1990s, cloud cover has slowly declined with it, gradually lowering albedo, thus increasing absorbed solar radiation, in turn increasing SST.
Another assertion without support. How long does such a window have to be to be meaningful and why?
As I said, when the slope flattens noticeably. It would likely take several decades for that.
Any real slowdown would also need to be reflected in ocean heat content, since that’s where most of the excess energy is stored.
“The slope?” Are you suggesting a singular characteristic? Are you suggesting that any objective observer would only notice a flattening of the average slope if it occurs over a period of several decades, longer than the definition of climate? Are we to ignore anything and everything that is less than “several decades?”
I’m not sure that you have thought this through. You certainly aren’t articulating it clearly.
Here you go, Clyde. To refresh your memory:
If I’m correct, the historical trend has shown a slope of around 0.11C to 0.15C/decade. For a pause to be considered legitimate, this number would need to fall significantly below that range for an extended period.
I’m not sure how long that would take, as it hasn’t occurred before, but I would assume it would take decades.
No, I’m not. Nothing significant or anomalous has happened yet, excluding the last few years. The so-called Monckton pauses are exactly what you’d expect after a major El Nino. They’re not significant at all. Unless you really believe La Nina years or moderate to neutral El Nino years should be hotter than a major El Nino year in a warming trend. And that’s just silly.
You keep making these broad-brush claims without defining important words like “legitimate,” “significantly below,” and “extended period.” Those are lawyer words, not the numeric words that characterize modern science. It has often been said that mathematics is the language of science. However, you assign no meaning to your qualitative words.
“No, If you look between El Ninos, there is no warming in UAH from 1980-1997 and none from 2001-2015.”
True.
But NOAA and NASA Climate managed to find 10 years between 2001 and 2015, that they proclaimed to be the “hottest year evah!”, and they were so dedicated to their scaremongering that they managed to get their computers to show that each successive year was “hotter” (a hundredth of a degree) than the previous year. So, year after year we had to listen to the climate change propagandists proclaiming we were living in the “hottest year evah!”.
Meanwhile, UAH showed that none of those years could be claimed to be the “hottest year evah!” going by the UAH data. None of those years were hotter than 1998. Not even close.
NOAA and NASA used their computers to lie to the American people and try to scare them into submission when it comes to CO2.
Trump should fire all of them.
Your predictions should be rounded to 0.4 +/-0.2 deg C and 0.5 +/-0.1 C.
I follow the JCGM 100:2008 guidelines therefore it is 0.43 ± 0.16 C and 0.47 ± 0.14 C respectively.
After a quick review of JCGM 100:2008 that you referenced, I’m unable to find an example that seems to apply. Since you claim to be using it as a guide, it shouldn’t be difficult for you to cite the appropriate page number and/or section and sub-section.
While I’m waiting for a reply, I’ll quote something that I think is germane:
“3.4.8 Although this Guide [JCGM 100:2008] provides a framework for assessing uncertainty, it cannot substitute for critical thinking, intellectual honesty and professional skill. The evaluation of uncertainty is neither a routine task nor a purely mathematical one; it depends on detailed knowledge of the nature of the measurand and of the measurement. The quality and utility of the uncertainty quoted for the result of a measurement therefore ultimately depend on the understanding, critical analysis, and integrity of those who contribute to the assignment of its value.”
With that fresh in your mind, I’ll quote from Taylor, John R., (1982), An Introduction to Error Analysis, University Science Books, Mill Valley, CA, pps 16-17:
“Once the uncertainty in a measurement has been estimated, one must also consider which are the significant figures in the measured value. A statement like
measured speed = 6051.78 ± 30 m/sec
is obviously ridiculous. The uncertainty of 30 means that the digit 5 in the third place of 6051.78 might be really as small as 2 or as large as 8. Clearly the trailing digits 1, 7, and 8 have no significance at all, and should be rounded off. That is, the correct statement is
measured speed = 6050 ± 30 m/sec
Clearly, the general rule is as follows.
Rule for Stating Answers
The last significant figure in any stated answer should usually be of the same order of magnitude (in the same decimal position) as the uncertainty.
For example, the answer 92.81 with an uncertainty of 0.3 should be rounded as
92.8 ±0.3 “
Same here. And the same request for more backup. When I’m not being sloppy, I did/do it your way. Help us out bd…
I’ll quote from Taylor as well.
“The rule (2.5) has only one significant exception. If the leading digit in the uncertainty δx is a 1, then keeping two significant figures in δx may be better. For example, suppose the some calculation gave the uncertainty δx = 0.14. Rounding this number to δx = 0.1 would be a substantial proportionate reduction, so we could argue that retaining two figures might be less misleading, and quote δx = 0.14. The same argument could perhaps be applied if the leading digit is a 2 but certainly not if it is any larger.” pg. 15, paragraph 4.
And then Taylor states in rule (2.9).
“The last significant figure in any stated answer should usually be of the same order of magnitude (in the same decimal position) as the uncertainty.” pg. 15, rule box 2.9.
So according to your own preferred source I am absolutely allowed to state these values as 0.43 ± 0.16 C and 0.47 ± 0.14 C respectively.
Absolutely. JCGM 100:2008 section 7.2 starting on pg. 25.
Example: 100.02147 ± 0,00035 g in section 7.2.2 on pg. 26.
Example: 100.02147 ± 0.00079 g in section 7.2.4 on pg. 26
Section 7.2.6 on pg. 26: “The numerical values of the estimate y and its standard uncertainty uc(y) or expanded uncertainty U should not be given with an excessive number of digits. It usually suffices to quote uc(y) and U [as well as the standard uncertainties u(xi) of the input estimates xi] to at most two significant digits, although in some cases it may be necessary to retain additional digits to avoid round-off errors in subsequent calculations.”
Thx bd, but I’m with Clyde here. I have no problem carrying the extra digit in the st. dev., but not in the expected value.
bd, I haven’t done the work, but I’m guessing that carrying sig figs rigorously actually further validates your point outs about the instatistacy of Monckton’s claims.
The significant figure rules don’t apply to Monckton. But yeah my main point is that the Monckton pauses don’t prove anything because they lack statistical significance.
The pauses prove that CO2 does not have a linear affect on global temperature. There is no direct casual relationship between CO2 and temperature. CO2 is not a singular predictor variable that determines the dependent variable of temperature. Consequently, focusing on reducing CO2 as the major cause of warming is fruitless.
Ok. I suppose that would require a trend expected value of <1 and a trend standard error of >10. In that case, just the sig fig rules would deny you the ability to say the trend was “flat”. So, back to p values and calculating the chances for how close to 50/50 is the trend up or down, that M was right. That’s already been done, to his discredit.
Did King Charles give Monckton immunity from the rules of measurement?
I have no idea. Next time he posts on WUWT maybe you can ask him why he uses 3 significant figures in his pause posts.
You overlooked the example I included: “For example, the answer 92.81 with an uncertainty of 0.3 should be rounded as 92.8 ±0.3” It and the subsequent examples mean that the nominal value should not retain digits implying precision greater than the largest order of magnitude in the uncertainty.
Taylor said, “Rounding this number to δx = 0.1 would be a substantial proportionate reduction, so we could argue that retaining two figures might be less misleading, and quote δx = 0.14.”
That argument might by used for any and all rounding-down operations, where it clearly becomes a subjective decision with no clear ‘rule’ to govern one’s action. I favor a hard and fast rule such as the instructions when adding/subtracting numbers with different numbers of significant figures. It makes no sense to retain digits of a certain order of magnitude when there are no corresponding digits of the same magnitude in the other numbers. Doing so just increases the uncertainty of the digit of the least significance in the final answer.
I did not overlook that example.. It’s the example Taylor uses on pg. 15 which I read…in its entirety. That’s how I know that my use of significant figures complies with Taylor based on the exception noted. If someone is overlooking anything it is you.
Then Taylor is not the source you should use in defense of your own significant figure rules.
Then you are once again not complying with your own source of significant rules. Taylor says (applying rule 2.9) that you report to the same order of magnitude as the uncertainty. Taylor also says (applying rule 3.47 and/or 4.14) that the uncertainty of an average is one order of magnitude less when there are at least 100 elements.
And what about JCGM 100:2008? I was told that I had to comply with the GUM when posting here or else where “or else” ranged from I wouldn’t be taken seriously to my entire calculation leading up to the report was completely wrong. They only say that you shouldn’t use an “excessive” number of digits and who recommend (via the canonical examples) that you use 2 significant figures. They even have an example (section 4.3.4) where they report 3 significant figures so I presume even 3 isn’t “excessive”.
So whose rules exactly am I supposed to comply with. Yours? Taylors? JCGM? Dr. Spencers?
You are, once again, pleading that “numbers is just numbers”. The example you give from Taylor has the implicit assumption that you can actually measure with an accurate resolution out to the hundredths digit.
When it comes to temperature data and “global temperature”, there isn’t a measuring device in use today that has an accuracy in the hundredths digit. Pretending that “numbers is just numbers” doesn’t answer that basic fundamental fact.
As usual, you ignore what the purpose of a measurement is. It is to give a value that someone duplicating the measurement might expect to get. Adding resolution digits beyond what you can accurately measure is perpetrating a fraud on those trying to duplicate the measurement.
Let me requote what Clyde has already given you:
““3.4.8 Although this Guide [JCGM 100:2008] provides a framework for assessing uncertainty, it cannot substitute for critical thinking, intellectual honesty and professional skill. The evaluation of uncertainty is neither a routine task nor a purely mathematical one; it depends on detailed knowledge of the nature of the measurand and of the measurement.” (bolding mine, tpg)
Significant digit rules are purely mathematical, they do not evaluate measurement uncertainty all by themselves, they are a tool to assist in the evaluation of the measurement uncertainty.
Taylor suggests using 1 digit for the uncertainty, except possibly for intermediate calculations of the propagation of error where one may retain an extra guard digit, for which it is common practice to place it in brackets.
Note that as Taylor demonstrates, each time the uncertainty is increased by an order of magnitude, he moves the rounding-off position 1 digit to the left.
Three digits may not be excessive if doing 6-sigma physics calculations. However, there is still the issue of what it is telling one about the precision of the final answer. That is, “What is the smallest or least significant figure in the results?”
So which rules am I suppose to be using?
100:2008] provides a framework for assessing uncertainty, it cannot substitute for critical thinking, intellectual honesty and professional skill. The evaluation of uncertainty is neither a routine task nor a purely mathematical one; it depends on detailed knowledge of the nature of the measurand and of the measurement.” (bolding mine, tpg)
You use detailed knowledge of the nature of the measurand AND OF THE MEASUREMENT.
What is the nature of temperature? Is it a proper metric for heat? Is it a proper metric for climate?
What is the nature of the measurement? What is the measurement uncertainty of the measuring instrument? What is the measurement uncertainty introduced by the microclimate? What is the measurement uncertainty introduced by the measurement protocol? What is the variance of the data?
These are just a few of the considerations. You been given documents on how to prepare an uncertainty budget. Start there.
You are trying to instruct those who think they know everything about measurement uncertainty. Good luck.
My suspicion is that he is bright, but self-educated in the field of metrology with little practical experience in real-world of calculations. It has been my experience that self-educated people often have significant holes in their knowledge base and are totally unaware of their deficiencies.
As I keep telling people I’m a complete novice. I’m less than an amateur. I have massive holes in my knowledge base and I’m definitely unaware of the likely infinite and growing number of them as well. If I’ve learned anything in my life it is that every time I’m exposed to a new concept I learn just how much my knowledge base is lacking.
The fixation with global temperature records is lunatic historically they have never been global or even collated in a standardised way. In addition temp records don’t identify causation definitive cause and effect observational evidence is the boy for that and none exists.
In addition historical data sets are hapless pap collated by odd bod enthusiasts and certainly not global.
Satellite temp records show warming or cooling nothing more relating the warming aspect to co2 has no robust science content at all.
Since the 2023 El Niño is long over now we can no longer credit it for continuing the current step-change that started around 2020, near the solar minimum.
I attribute this latest UAH LT slight uptick to a recent small bump in eastern to central Pacific temperatures and to the continuing strength of solar cycle #25, as positive SST changes have occurred in synch with at least the last nine solar cycles before this one.
The southern ocean SST anomalies warmed again this past austral summer, evidence of the sun’s sub-solar warming effect under high solar maximum TSI.
People do not know what the normal temperature (of earth) is. Modelled datasets has it at 13.9°C.
That is only the mid-latiude sections of the earth that average 14°C, Max 21°C at 30°N or 30°S + Min 7°C at 50°N or 50°S divided by 2.
Basic maths says 30 + -20 / 2 = 5. What is the average temperature of the polar regions?
Around – 20°C.
This blind spot in normal inteligence is based on cult bubble thinking.
Another blind spot that has now been erased is the warming and cooling of the 20th Century.
Where does UAH start, you guessed it, at the cooling period.
So obviously the warming rate is going to positive.
Now if 5C was the known temperature then the sun would be more relevant. As heat is proportional to temperature, the suns heat that heats the earth is 5°C.
340 watts NH illumuniated side, 340 watts SH illumuniated side (add 15% to that) and obvious ly the dark side of both hemispheres 680 watts goes out to space.
Total from the sun 1360 watts (120°C). Modelled data assumes 1/8 heats the surface 120/8 or 170 watts (Earth energy budget NASA image 163.3 w/m2 is typical for February and March, 13 watts below January minimum 1317 w-m2, sun distance is maximum 152 million km).
So 680 watts covers 70% of the earth, 70% of the remainder 680 watts goes out to space and 30% is earths internal heat (1.4 x 1.27kg x 334 m2/s (111, 556 J) / 713 cv = 278.2 kelvin (198345 total heat divided by 713 J (heat capacity per kelvin) or 207K 105 watts per hemisphere.
71°C (207K – 278K) is the amount of heat needed for a liveable planet.
11°C comes from 70% of the planet covered by oceans. As water vapor enthalpy is zero at 267K.
Observations show that we are still in an ice age as earth has 20 milllion km2 of to much snow.
May 1st is close to 5°C which should of happened on April 10th, when the sun TSI is 1360 watts (prior to April 10th higher and after April 10th lower).
Yet 5C in October when sun also 1360/4 watts 5C.
Explanation : Sun distance changes throughout the year. Reaching maximum distance in July (1317w-m2 TSI and minimum distance January 1407w-m2 TSI.
Winter shows below 1317w-m2 instead of above 1317 and rising.
Reason the analysis and observations says earth is still in ice age.
There is copious amounts of evidence that most of the Holocene, from the MWP back to about 10,000 years ago..
….. was significantly warmer than now.
We are actually in a cooler period of the Holocene…
… barely a degree or so above the coldest period in 10,000 years.
And yet, CO2 is apparently at its highest in this 10,000 years.
The Earth is continuing to cool, as it has done for the past four and a half billion years. According to geophysicists, around 4 millionths of a Kelvin per annum.
Of course, the Earth is in a state of constant chaotic motion, and massive volcanic eruptions may release more heat to space, or reduced things of that nature will reduce the rate of cooling. Slow, but inexorable in any case.
Not much humans can do about it, anyway.
Earth does not follow a monotonic decline in global atmospheric temperature.
Independent of volcano activity, the Earth experiences long periods (tens-of-thousands to hundreds-of-millions years duration, such as during “hot house” Earth conditions and interglacial periods within a given Ice Age) wherein there is distinct, continuous global warming.
And yes, there is not much that humans can do to effect such natural warming.
Rubbish. About as silly as “snowball” or “slushball” Earth.
There has never been, nor will there ever be, distinct, continuous global warming. At least, unless current physical laws are overturned. Maybe you are thinking about surface temperatures as measured with thermometers, rather than the entire Earth?
I invite you to specify a mechanism by which a rocky Earth-sized planet, 99% hot enough to glow from dull red to blinding incandescence, might experience distinct, continuous global warming.
I presume the same mechanism might cause a cooling cup of coffee to spontaneously heat up and cool down at intervals – whilst in an unchanging environment.
You’re fantasising. Sorry, but you are refusing to accept reality.
Temperature is not heat. There seems to be a misconception that increased temperature means increased heat. That ignores the physics of heat, especially in an atmosphere that is filled with water vapor. There is a *reason* why steam tables have the indices they do, e.g. pressure and humidity. Climate scientists like to ignore that simple fact.
I agree. There is also a misconception that increased heat means increased temperature.
“Climate science” is an oxymoron. Climate is the statistics of weather observations, which any competent 12 year old can calculate. Obviously, “climate scientists” believe that a 12 year old intellectual level is good enough for them.
Adding CO2 to air does not make it hotter, which seems to be contrary to the “climate science” consensus. Maybe they aren’t quite up to 12 year old level just yet?
All good fun.
Since you asked so nicely, I’ll give you not one but two possible realistic mechanisms by which “a rocky Earth-sized planet, 99% hot enough to glow from dull red to blinding incandescence”—although admittedly I don’t know what “99% hot enough” means when applied to a wide range of incandescence, nor do I know what “blinding incandescence” means in terms of absolute temperature—might experience distinct, continuous global warming:
1) momentum exchange with a separate planetary-size object on a trajectory passing close to that hypothetical Earth-size planet—even impacting it—causes said Earth-size planet to then go into a new orbit that passes deep below the photosphere of the star that planet is orbiting . . . distinct, continuous global warming leading to that hypothetical planet’s eventual destruction within the star,
2) the star around which the hypothetical rocky Earth-sized planet is orbiting is in the process of normal death (having consumed most of its primary fuel hydrogen) and beginning the natural process of expanding into a red giant or red super giant, whereby its corona and photosphere gradually approaches and then engulfs said hypothetical planet . . . distinct, continuous global warming occurring over perhaps a period of a million years or longer.
Reality is that two-body near misses and collisions of planetary-size bodies do happen in our universe (even being incorporated in explaining moons and orbits in our solar system’s formation and evolution) and that stars do age into red giants with their photosphere expanding to radial size that would engulf our current solar system inner planets.
You see, planetary temperature is not just dependent of radiation energy losses to deep space . . . it also is highly dependent on radiation energy input from the star it is orbiting.
Despite what you might believe (based on your, ummmm, statements), the Earth is currently rather finely balanced in overall radiation flux, with a scientifically-calculated average excess of just 0.85 W/m^2 radiation going to deep space compared to the scientifically-calculated mean global average solar radiation input flux of about 1361 W/m^2 . . . that’s a balance to within 0.06%.
Your original comment was –
and it was that “distinct, continuous global warming” to which I was referring.
Burbling about fantastic occurrences, totally unrelated to the impression you were trying to give, just makes you look like a fool caught saying something stupid, and then trying to wriggle out of it.
You don’t have to accept that the Earth’s inner core is around 5500 K, roughly the temperature of the Sun’s photosphere, and presumably as blindingly incandescent.
Yes, the Earth is cooling very slowly. Losing more energy than is generated by internal radiogenic activity. Sunlight, of course, is irrelevant. As Fourier pointed out, the surface loses all the energy received from the Sun, plus a little internal heat.
So carry on being as diversionary as you like. If you are trying to imply the existence of a GHE, or that adding CO2 to air makes it hotter, why not just say so?
Are you afraid of looking foolish?
When I mean to speak about Earth, I used that noun directly.
However, it was you that referred to “a rocky Earth-sized planet, 99% hot enough to glow from dull red to blinding incandescence” in your post above (May 3, 2025 4:17 pm) when inviting me to offer a an example of how such “might experience distinct, continuous global warming.” If you meant to say “Earth”, why didn’t you just say “Earth”???
For your edification, Earth’s peak radiation (aka “glow”) to deep space is in the LWIR portion of the EM spectrum, with about 71% of it’s surface being covered by liquid water with a small fraction including floating sea ice. Therefore, no person with an eduction in science beyond grade school level would ever seriously assert that Earth is “99% hot enough to glow from dull red to blinding incandescence”.
Obviously, what we have here is a failure to communicate (tip of the hat to the 1967 film Cool Hand Luke).
I’ll leave it to WUWT readers to determine which of us appears to be “foolish” . . . and as has become obvious to me, there really is no purpose in us continuing discussions on this topic.
He constantly posts the same garbage on multiple threads and never once presents any data or supporting links for his assertions! Recently he asked me what Earth would be like if the solar irradiance doubled, I pointed out that Venus was the about same size as Earth and received double the irradiance but that was irrelevant apparently!
Feel free to look up the reference if you like. You don’t have to believe it, of course. For your edification, the filament of an incandescent lamp is less than 3700 C – not even the temperature of the core!
The mantle comprises about 84% of the interior. The outer core and inner core comprise more than 15% of the Earth’s volume, and are considerably hotter (of course), than the relatively cool mantle.
You don’t seem to understand basic physics. The Earth is losing around 44 TW – this is referred to as “cooling”. The planet is losing more energy than it is receiving.
As it has done for four and a half billion years.
No GHE. Adding CO2 to air does not make it hotter. Accept reality.
“Yes, the Earth is cooling very slowly. Losing more energy than is generated by internal radiogenic activity. Sunlight, of course, is irrelevant. As Fourier pointed out, the surface loses all the energy received from the Sun, plus a little internal heat.”
Fourier of course lived in rather different times (died 1830) and had rather less data than we have today! Sunlight is certainly not “irrelevant” it is in fact the major source of energy for our planet. In fact measurements by the NASA Ceres program of absorbed sunlight entering the top of the atmosphere and thermal radiation leaving show that since 2000 the imbalance has been positive and increasing (currently ~1.5 W/m^2). In contrast the average flux from the Earth’s interior to the surface is ~50 mW/m^2!
Phil, all the heat from the Sun is dissipated to space, plus a little internal heat.
That’s why the Earth has cooled over the last four and a half billion years.
Adding CO2 to air does not make it hotter.
There you go. Sorry about destroying your GHE fantasy.
“Phil, all the heat from the Sun is dissipated to space, plus a little internal heat.”
As I showed above that is not what’s happening, currently solar irradiation exceeds radiation loses (those are measurements not assertions).
“That’s why the Earth has cooled over the last four and a half billion years.”
Except during multiple periods when it has warmed!
Complete nonsense, Phil. No instrumentation exists which can measure total radiation either absorbed or emitted by the Earth. If NOAA or NASA claim otherwise, someone is lying to you, and treating you like a gullible child. The same people who imply that adding CO2 to air makes it hotter!
I suppose you’re gullible enough to believe that, too.
Keep at it. The Earth is losing about 44 TW. That’s referred to as “cooling” by sane people.
Wow, this is difficult, who should I believe, someone who posts on social media with no credentials and can’t provide data to support any of his assertions, or the organization that operates multiple satellites that measure the Earth’s Radiation Budget? Sorry MF, it’s not even close, you lose!
Phil, you can believe anyone you like. If you believe that Gavin Schmidt is a scientist, go your hardest. If you believe that adding CO2 to air makes it hotter, good for you!
If you believe that NASA, NOAA, or anybody else has a magical instrument that can measure the total radiation that the Earth absorbs or emits, you are obviously extremely gullible or quite insane.
Are you silly enough to believe that Michael Mann was awarded a Nobel Prize, because he said so? Rhetorical question – of course you are!
NASA and NOAA employ all sorts of people, ranging from very good indeed, to the hopelessly incompetent who don’t realise it – getting innocent people killed in the process. Read the Rogers Commission report, and then reaffirm your childlike acceptance of the “expertise” of NASA employees.
You probably would, I suppose.
More of the totally irrelevant rubbish you produce to avoid addressing the science (which you’re totally incapable of).
“If you believe that NASA, NOAA, or anybody else has a magical instrument that can measure the total radiation that the Earth absorbs or emits, you are obviously extremely gullible or quite insane.”
It’s a scientific instrument that is flown on a number of satellites, not magical at all!
https://ceres.larc.nasa.gov/
Of course, you can’t actually provide the bandwidth of this “scientific instrument” because it doesn’t exist!
Even your link states –
No mention at all of the magical “scientific instrument” which can measure total energy either being absorbed by, or emitted by, the Earth.
Sorry Phil, you are suffering from extreme gullibility, or you are living in a fantasy divorced from reality.
Exactly, the link says which bandwidths the instrument uses, what part of that do you not understand?
Here’s the spectrum of the incoming solar:
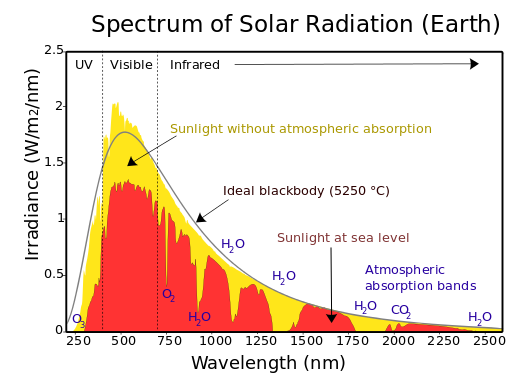
0
Covered by both SW and TOT.
And the outgoing:
Unfortunately this site has a problem with an image as you’ll see below!
Any way a simple Google search will show you that the bandwidth of TOT is more than adequate to measure the Earth’s emissions (3-100𝛍m)
Phil, there is no instrument in the known universe capable of measuring the energy absorbed and emitted by the Earth.
Accept reality.
I do, you apparently have a very strange idea of what constitutes the energy absorbed and emitted by the Earth, perhaps you could explain what bandwidth you believe is required!
Phil, not just what I “believe” – what is required to measure the total energy emitted or absorbed.
Pretty simple – total means total. Not mostly, nearly all, or similar weasel words.
As I said, there is no instrumentation available (or even possible) to measure the total energy emitted and absorbed by the Earth (not that you’ve managed to even say what you think “the Earth” means).
It won’t matter how you define it, will it?
Adding CO2 to air won’t make it hotter, and four and a half billion years of continuous sunlight hasn’t stopped the planet cooling to its present temperature.
No GHE.
“Phil, not just what I “believe” – what is required to measure the total energy emitted or absorbed.”
So you’re unable to explain what bandwidth is required, what a surprise!
Infinitely short to infinitely long, but you don’t even understand what that means – being ignorant, gullible, and possibly suffering from a mental affliction.
Just be clear, that current calculated 0.85 W/m^2 excess of outgoing Earth radiation compared to incoming absorbed solar radiation (disregarding the fact that the error bars on such a calculation are around +/- 1 W/m^2 . . . hah!) can easily be offset by:
— just a 0.2% decrease in Earth’s albedo (say due to decrease in global cloud coverage or a reduction in areal ice coverage over land and water)
— a small fraction of the solar energy variations at Earth TOA due to thousand- to hundreds of thousands-years variations in Earth’s orbital ephemeris with respect to the Sun, known as Milankovitch cycles* and their various resonances.
* “These cyclical orbital movements, which became known as the Milankovitch cycles, cause variations of up to 25 percent in the amount of incoming insolation at Earth’s mid-latitudes (the areas of our planet located between about 30 and 60 degrees north and south of the equator). — https://science.nasa.gov/science-research/earth-science/milankovitch-orbital-cycles-and-their-role-in-earths-climate/
There are ready, science based explanations for how Earth, despite a multi-billion year overall cooling trend (starting from its formation) can experience very long (hundreds of millions of years duration) warming intervals.
Unfortunately, you haven’t been able to come up with any that apply to the Earth that we live on. 99% of the planet is hotter than dull red, right up to incandescent 5500 K or so, whether you accept it or not.
The insolation from the Sun some 300,000,000 km away is insufficient to even raise water to 100 C on the Earths surface, let alone stop anything hotter than this from cooling – like the hot Earth. The Earth, beyond the Sun’s seasonal influence – maybe the first 10 m or so of the crust – presently varying between around 90 C and -90 C.
Yes, restoring the Earth to its previous completely molten condition would count as warming, and some sort of cosmic cataclysm might well achieve this.
Adding CO2 to the atmosphere assuredly won’t. Nor will orbital variations which do not result in the Earth moving close enough to the Sun to obliterate all human life.
No magical cooling, then heating, then cooling . . . cycles.
You have no “ready, science based explanations” to support your pseudo-scientific assertions. If you had, you would have provided them, wouldn’t you? You can’t even find a consistent, rigorous definition of the GHE, so you can’t fall back on that particular piece of nonsense.
Keep trying.
My understanding is that an Ice Age is defined by year-round ice coverage being present over at least one of Earth’s poles “continuously” (i.e., for periods periods greater than 1000 years). I haven’t seen any reference to snow coverage in this regard.
Although we are currently in the early stage of the Quaternary Ice Age, we are also in an interglacial period within such.
If current physical knowledge is correct, it is highly unlikely that the Earth will spontaneously heat up, leading to the Antarctic continent reverting to its previous plentiful flora and fauna.
Geophysicists put the present Earth cooling rate at around four millionths of a Kelvin per annum. No reason at all for this cooling to reverse, and become heating. Any object hotter than its environment will cool, unless supplied with sufficient energy to overcome its energy loss.
GHE worshippers burble “But, the Sun . . .”, conveniently ignoring the fact that four and a half billion years of continuous sunlight has not managed to stop the Earth cooling. Just placing a pot of recently boiled water in the sun will show the foolishness of thinking that sunlight somehow “accumulates” or “stores”. The water will cool, and no amount or length of exposure to the Sun will get it back to the boiling point.
“Climate scientists” live in a rarefied world where reality is thrown aside in favour of fantasy.
“If current physical knowledge is correct, it is highly unlikely that the Earth will spontaneously heat up, leading to the Antarctic continent reverting to its previous plentiful flora and fauna.”
Yet the simple scientific fact, supported by a huge amount of data from numerous different proxies, is that Earth has warmed up from at least four previous Ice Ages: the Huronian, Cryogenian, Andean-Saharan, and Late Paleozoic.
Perhaps you think that such warming cannot happen again? If so, please provide your explanations for (a) what caused the past warmings, and (b) what now prevents a reoccurrence of such warming.
There was no “global warming” – ever. You are simply ignorant, gullible, or both.
No “snowball Earth”, not even a “slush ball Earth”. If you want to call on a “consensus”, a consensus of real scientists seems to be that the Earth’s surface was originally molten, and has cooled to its present state – roughly 90 C to -90 C. Four and a half billion years of sunlight, CO2, H2O, or anything else has not stopped this cooling.
Feel free to believe anything you like – you might even fantasise that adding CO2 to air makes it hotter!
Ho hum.
Nothing to see here…
Averages alone tell us very little. From chatgpt:
“The null hypothesis—that observed temperature changes are due to chance—cannot be tested using only average temperatures. Averaging conceals the underlying variability in the data. Without knowledge of the variability (e.g., standard deviation or distribution), one cannot assess whether observed changes are statistically significant or due to random fluctuation. This issue arises from misapplication of the Central Limit Theorem, which describes how sample means tend toward a normal distribution, but does not justify ignoring variability.”
The sample means tending toward a normal distribution only allows more precise location of the population mean. So what? As you say, the population mean tells you nothing about the variability of he data nor does it provide any metric for the measurement uncertainty of the average value. If all your data is inaccurate then the mean will be inaccurate as well – but you can certainly get very close to what that inaccurate mean is with enough samples of proper sizing.
As a matter of interest, the Central Limit Theorem does not apply to a chaotic series, much to the chagrin of those who wish it would. One can calculate an arithmetical average of the members of a chaotic series, but it is about as useful as averaging the numbers in a telephone directory.
Chaos is unpredictable. The approximate future cannot be determined from the approximate present, even where the present determines the future.
Sad but true, and even grudgingly acknowledged by the IPCC, who agree that it is not possible to predict future climate states.
Still, the UK Met office continues running on the linear graph road.
Probably why even the BBC dumped the UK Met Office as a forecaster.
The linear graph road is a road to nowhere.
I see Australia just smashed its warmest autumn (MAM) record in UAH. +1.21C above the 1991-2020 average. That follows on from its warmest year, in 2024.
Where are all those “no warming in Australia since…” guys?
Geoff?