by Roy W. Spencer, Ph. D.
New Record High Temperatures and a Weird Month
July 2023 was an unusual month, with sudden warmth and a few record or near-record high temperatures.
Since the satellite record began in 1979, July 2023 was:
- warmest July on record (global average)
- warmest absolute temperature (since July is climatologically the warmest month)
- tied with March 2016 for the 2nd warmest monthly anomaly (departure from normal for any month)
- warmest Southern Hemisphere land anomaly
- warmest July for tropical land (by a wide margin, +1.03 deg. C vs. +0.44 deg. C in 2017)
These results suggest something peculiar is going on. It’s too early for the developing El Nino in the Pacific to have much effect on the tropospheric temperature record. The Hunga Tonga sub-surface ocean volcano eruption and its “unprecedented” production of extra stratospheric water vapor could be to blame. There might be other record high temperatures regionally in the satellite data, but I don’t have time right now to investigate that.
Now, back to our regularly scheduled programming…
The Version 6 global average lower tropospheric temperature (LT) anomaly for July 2023 was +0.64 deg. C departure from the 1991-2020 mean. This is well above the June 2023 anomaly of +0.38 deg. C.

The linear warming trend since January, 1979 now stands at +0.14 C/decade (+0.12 C/decade over the global-averaged oceans, and +0.18 C/decade over global-averaged land).
Various regional LT departures from the 30-year (1991-2020) average for the last 19 months are:
| YEAR | MO | GLOBE | NHEM. | SHEM. | TROPIC | USA48 | ARCTIC | AUST |
| 2022 | Jan | +0.03 | +0.06 | -0.00 | -0.23 | -0.12 | +0.68 | +0.10 |
| 2022 | Feb | -0.00 | +0.01 | -0.01 | -0.24 | -0.04 | -0.30 | -0.50 |
| 2022 | Mar | +0.15 | +0.28 | +0.03 | -0.07 | +0.22 | +0.74 | +0.02 |
| 2022 | Apr | +0.27 | +0.35 | +0.18 | -0.04 | -0.25 | +0.45 | +0.61 |
| 2022 | May | +0.17 | +0.25 | +0.10 | +0.01 | +0.60 | +0.23 | +0.20 |
| 2022 | Jun | +0.06 | +0.08 | +0.05 | -0.36 | +0.46 | +0.33 | +0.11 |
| 2022 | Jul | +0.36 | +0.37 | +0.35 | +0.13 | +0.84 | +0.56 | +0.65 |
| 2022 | Aug | +0.28 | +0.32 | +0.24 | -0.03 | +0.60 | +0.50 | -0.00 |
| 2022 | Sep | +0.24 | +0.43 | +0.06 | +0.03 | +0.88 | +0.69 | -0.28 |
| 2022 | Oct | +0.32 | +0.43 | +0.21 | +0.04 | +0.16 | +0.93 | +0.04 |
| 2022 | Nov | +0.17 | +0.21 | +0.13 | -0.16 | -0.51 | +0.51 | -0.56 |
| 2022 | Dec | +0.05 | +0.13 | -0.03 | -0.35 | -0.21 | +0.80 | -0.38 |
| 2023 | Jan | -0.04 | +0.05 | -0.14 | -0.38 | +0.12 | -0.12 | -0.50 |
| 2023 | Feb | +0.08 | +0.17 | 0.00 | -0.11 | +0.68 | -0.24 | -0.12 |
| 2023 | Mar | +0.20 | +0.24 | +0.16 | -0.13 | -1.44 | +0.17 | +0.40 |
| 2023 | Apr | +0.18 | +0.11 | +0.25 | -0.03 | -0.38 | +0.53 | +0.21 |
| 2023 | May | +0.37 | +0.30 | +0.44 | +0.39 | +0.57 | +0.66 | -0.09 |
| 2023 | June | +0.38 | +0.47 | +0.29 | +0.55 | -0.35 | +0.45 | +0.06 |
| 2023 | July | +0.64 | +0.73 | +0.56 | +0.87 | +0.53 | +0.91 | +1.43 |
The full UAH Global Temperature Report, along with the LT global gridpoint anomaly image for July, 2023 and a more detailed analysis by John Christy of the unusual July conditions, should be available within the next several days here.
The global and regional monthly anomalies for the various atmospheric layers we monitor should be available in the next few days at the following locations:
Lower Troposphere:
http://vortex.nsstc.uah.edu/data/msu/v6.0/tlt/uahncdc_lt_6.0.txt
Mid-Troposphere:
http://vortex.nsstc.uah.edu/data/msu/v6.0/tmt/uahncdc_mt_6.0.txt
Tropopause:
http://vortex.nsstc.uah.edu/data/msu/v6.0/ttp/uahncdc_tp_6.0.txt
Lower Stratosphere:
http://vortex.nsstc.uah.edu/data/msu/v6.0/tls/uahncdc_ls_6.0.txtâ€
Looks like it is heading upwards. Where to?
We’re still thawing out from the Little Ice Age.
The August forecast for much of the NH is cooler, including where I am Highs in 80s and 90s F instead of 90s and 100s. Here last year was hotter.
However I see PHX is still likely to suffer more days over 110 next week.
I’ve been hearing about how terribly hot its been in Phoenix all summer. It has been hotter than usual but, as with every hottest of all time claim, this all depends on the quality of the station where the measurements are being taken.
Yes those records that were broken was in a city of less than a million, now at nearly 5 million and temperatures taken at a Airport with now three runways not one and two very large terminals with equally large parking garages, not a surprise. Add in the Hunga Tonga event and it looks like a perfect storm. One that CO2 was in all probability not part of the equation. Of course you will never hear that from the media.
There’s also a heat dome over the central Andes, heating northern Chile.
During heatwaves periods, the Urban Heat Island effect can enhance the temperature records by 8 to 10°C with respect to the surrounding countryside.
These purported broken records are an illusion intended to make the people panicking.
I ride a motorcycle. I can ride the same span of road and experience different temperature swings. One day, dipping down a valley with tall trees on both sides will result in noticeable drop in temperature, on other days with different wind there will be no temperature difference or sometimes warmer. When nearing my home and crossing the lake, Ill feel a dramatic change in humidity, on other days, with a different wind that all goes away.
These are satellite measurements of the lower troposphere. No station siting involved.
“These are satellite measurements of the lower troposphere. No station siting involved.”
That does *NOT* mean that UAH observations are not affected by UHI. Urban heat goes up as well as out.
I’m in Phoenix and I haven’t been suffering. Enjoying the pool at night. We do have air conditioning you know!
https://holoceneclimate.com/
We are still cooling down since the Holocene optimum.
If we are in the throes of an El Nino, then it will likely go higher, if no El Nino happens, then
it will cool again after the peak NH summer. Overall, this is not predictable just like the models aren’t or should I say can’t..
There’s no way CO2 is to blame for an almost .3C jump over a month. Something natural is behind this.
Definitely.
There are stagnant high pressure systems that are cooking the US south. That will change. It always does. It’s *weather*, not climate.
Yep. Anyone claiming otherwise needs to show evidence.
It’s Aliens
I find it frustrating that “the science” gets in the way of real climate science. Shouldn’t people interested in this field be chomping at the bit to figure out what is happening that would cause a large spike like this? No, they just go “see CO2!” Whether it is weather or some larger phenomenon it seems like this would be an interesting thing to hypothesize about and discover.
Walter:
Here is the answer
https://doi.org/10.30574/wjarr.2023.19.1.1329
Huge eruption only recently that was able to throw large amounts of water vapour into the stratosphere.
I don’t think we can discount a significant warming of the water around that volcano.
Question is, where would that warm water go to, how long would it take, and what effect might it have.
Seems to be deep currents, as well as mid and near surface currents, all going in different directions.
Oceanographer and lots of measurements needed.
It went to the Pacific coast of the Antarctic Peninsula, hence lack of sea ice there now.
https://www.nature.com/articles/s41598-019-45190-3
Want to reconsider the down votes, because, actual science?
But it is very clear that the current anomalies being observed in the climate metrics are not associated with the 3-month-old fledgling El-Nino and has much to do with the volcanic event from 19 months ago.
Why did it take 19 months? What physics explains how a mere 150 MtH2O could have such a significant effect?
It did not take 19 months, the effects became immediate, however this was primarily a Southern Hemisphere event so it was predicted that it would take several months for the excess water vapor and other particulates to distribute throughout the Southern Hemisphere as well as migrating to the Northern Hemisphere.
The image below shows Antarctic sea ice (all years) setting a record low-high last year only a few months after the eruption, and this year will clearly be the new low-high by a wide margin.
One needs to look no further than this in science and consequently, physics to relate cause and effect in this situation. No other rational explanation can explain the (never observed before) sudden change in Antarctic Sea Ice over the last two seasons than the (never observed before) eruption.
When I say “effect” I’m talking about the recent rise in the UAH TLT anomaly. And when I say “what physics explains” I’m not asking what happened; I’m asking how it happened.
And as far as the explanation of the physics, the heat flux leaving the planet had to deal with Stratospheric water vapor on its way into space before the eruption, and now it has to deal with more of it.
We’re headed up from La Niña low of -0.04 anomaly in January. No surprise there.
Direction from here can’t be known, but without another Super El Niño continued heating into the 0.70s and 0.80s is a long shot, even with Tongan water now spread across the stratosphere.
We’ll see in August and September.
The 7.5-year cooling trend is however at risk from the building El Niño and huge 2022 submarine eruption.
The record since 1979 is 0.83 C in 02/2016.
Outer space
Maybe heading upwards towards mid-Holocene temperatures? Long way to go, though.
Like when this tree was growing where today it is too cold for them to grow?
Finally, some much desired Global Less-Coldening.
What is “it”?
(please don’t say “global temperature”, because that’s a construct that has no applicability to the daily lives of any creatures on this planet).
Why can’t I say it? The heading of this article is
“UAH global Temperature update”
You sound like you’re applying for a gig with The Knights Who Say “IT”
Where to? Not to catastrophe. The USDA is still predicting another record global corn harvest this year. They are predicting the same thing for wheat. You want a positive correlation to look at? As CO2 has gone up so has global food production. If CO2 and temperature are correlated and therefore have a causal relationship then the same thing must be assumed for food production. We are about 20 years past Gore’s and the IPCC’s prediction of mass starvation from rising CO2 and temperatures.
So where *is* food production headed?
Looking back over the record, I can see lots of places where it was heading up.
Are you really trying to claim that this recent increase actually proves something.
Did I hear you say it looks like it was heading downwards when it was?
Answer – no. People see what they want to see. Always good for all of us to keep this in mind.
If the mainstream media say “hottest ever” – or anything with “hot” in it for that matter – I just skip past because I know that they will never say anything with “cold” in it. Nick Stokes ditto (what has happened to you, Nick, you used to have some reason now you’re just plain bias). When Roy Spencer says “hot” I’m paying attention because I know he will report it like it is, whatever it is. Could this be Hunga Tonga? We don’t know yet, I think, but here at least we have independent minds trying to work it out. I’m staying tuned.
“Could this be Hunga Tonga?”
It would be a belated response to an eruption eighteen months ago.
Why did an eruption in 1815 cause a Year Without Summer in 1816?
Walter;
Because the dimming SO2 aerosols from the volcanic eruption had circulated around the globe. It takes, on average, 17 months for for the maximum cooling from a VEI4 eruption to occur. This was a VEI7, with a shorter circulation time.
So what,
Are you really saying that oceanic seismic activity has an immediate effect…
.. despite data that shows the 2 year lagged ocean seismic activity corresponds far far better to atmospheric temperatures than CO2 does.
It took awhile, but I was able to track down that graph. It was made by Viterito. I recognize this name because of the fraud that occurred under his leadership.
He was the editor-in-chief for the now defunct predatory journal Environment Pollution & Climate Change owned by OMICS. OMICS, subsidiaries, and personnel were investigated for academic fraud in 2016 and were found to have run as many 700 predatory journals and deceived numerous article authors. A judge ordered the India based company to pay $50 million in damages. Viterito defended his involvement.
And his “scientific” positions defy credulity. He allowed an article that stated that the greenhouse effect cannot be real because the atmosphere does not have a roof like a real greenhouse. Even the most predatory of predatory journals would usually reject that kind nonsense. So this must have been a whole new level of ineptitude on his part.
Good spot.
Thanks. It comes from this publication in one of the journals that was determined to be fraudulent.
I would say we felt the effects of it last year as well. There were many heat records broken and some areas experienced unprecedented snowfall, Houston experienced the coldest temperature of my life at 57 years there. Currently Antarctic Sea ice is at near record low. Initial estimates were that the effects would last for at least 4 years. This is not over by a long shot. The man who wrote this article said that these anomalies are unlikely to be caused by El-Nino because it is too weak and too recent to have this type of global impact and looking at the data, it is very clear that we are experiencing something unprecedented.
To the Moon Alice!
To the Moon!
*pow*
*zoom*
Nick,
Tell us exactly how the increase in CO2 during July caused this anomaly change. Without the evidence that CO2 caused the increase, you have no evidence as to what did cause the increase.
When do the islands get overwashed, Nick?
When shall we expect the refugees?
How exactly are we all going to die?
When comes the sharp rise in sea level?
Well, the oceans are supposed to boil according to the brain trust of climate alarmists so I guess it’s headed to at least 100 C (212 F). Never mind that CO2 was 5 times higher during the Jurassic and temperatures were rather comfortable for the early dinosaurs, only about 5 to 10 C higher than today, a temperature humans could easily adapt to if needed. But apparently there’s an imminent apocalypse or something, though there’s no evidence of it, and CO2 is the reason, the whole reason, and nothing but the reason. Well, who am I to argue with the elite? I mean, the science is settled.
This is obviously a “sudden” event-driven warming.
Only have to look at Antarctic sea ice to realise that.
Now what could possibly have happened recently in the SH ?
Nick,
Had there been a fall of similar size, would you have commented “Looks like it is heading downwards. Where to?”
Maybe you might use even better English, such as “To whence?”
Geoff S
If you want to complain about English you should start by checking the meaning of “whence”. According to the Oxford English Dictionary “whence” means “from what place”. Thus “to whence” makes no grammatical sense whatsoever.
Indeed. The correct archaic would be Whither?
If anyone know “archaic” it would be Nick.. !
“Whither” means “where to”, not “where from”.
Exactly.
Blimey – for once I agree with Izaak Walton! I need to lie down for a while.
Where can I sign up to NEVER see another Stokes post again.
Can someone make that happen?
He is a troll.
If anyone watches ‘What we do in the Shadows”, you realize Nick is an energy vampire.
https://www.youtube.com/watch?v=A-Eldr7aV74
Start at 4:11
I would not like to see this become a site on which people are silenced merely for having an opposing viewpoint to the prevalent one.
There is plenty of that elsewhere.
Nick Stokes may be very stubborn, exasperating even, but that is not a vice.
He will engage with you if you initiate a dialogue, which is more than can be said about many others.
Where to? Down.
Please tell me whether there will be another solar flare this month or not:
https://blogs.nasa.gov/solarcycle25/2023/07/03/sun-releases-strong-solar-flare-6/
And before that, it was heading downwards.
”Looks like it is heading upwards. Where to?”
What goes up, must come down
The Ethical Sceptic has an idea for the unusual warmth – check out his web site and the essay on global warming.
According to the graph, last July is lower than 2016 and therefor confirms global cooling.
Clearly, we have not thrown enough tax credits and budget transfers to the UN and NGOs to hold down the warming. More drastic measures like borrowing against your next three generations is now required. Pay no attention to that land war in Europe and continue paying us instead. /sarc
Ah ha, maybe it’s all the explosives being detonated in Ukraine that is causing the warming.
Posters here spent the last month inventing excuses for all the new reported surface temperature records in July. UHI, poor station sites, jet efflux at airports, scientific curruption on a global scale… to name but a few.
Well, here we have confirmation from the satellite data, and UAH no less, that July 2023 was the warmest month yet recorded by instruments. What’s the next excuse?
It is not the warmest month. It’s the warmest July anomaly in the dedicated satellite record. It clearly was not suddenly caused by CO2.
As you could see from the graph, had you looked, the warmest anomaly was 0.83 C in February 2016, during Super El Niño conditions.
Posters here gave you convincing reasons last month. You just chose to ignore them.
Did you read what Dr Spencer said?
July is the warmest month globally, so this was also the warmest month on record in absolute terms.
I agree that is less important than the anomaly value, but it’s still a fact.
You find it remarkable that July is hotter than February? Most land stations are in the NH, with 90% of humanity and air conditioning moving warm air from indoors to outdoors.
You’d need to refer that to Dr Spencer, who makes the claim. Bear in mind that there are 2 hemispheres.
As noted, the hemispheres are radically different.
The SH is 81% water, and even more if land ice be added. It has fewer than 10% of Earth’s people.
The NH is 61% land, with more than 90% of its people. It teems with huge cities, creating urban heat islands, and vast farm and forest acreages, including irrigation.
There’s no comparison between heat profiles.
And yet they *INSIST* on jamming the temperature profiles together to create a “global temperature” data set. What they wind up with is at least a bi-modal data set, if not a multi-modal one, where the “average” is totally useless. You can’t tell what is happening to each modal data set let alone what the impacts on the average is from each. And they totally ignore the increase in variance for the overall data set when you create a multi-modal distribution – meaning an increase in the uncertainty of the average.
It’s enough to make anyone using measurements whose civil and criminal liability depends on the reliability of those measurements cry.
It is truly all they have. Without GAT anomalies they would be bankrupt, so they just ignore any flaws in the weaving.
As intellectually honest as “correcting for bias” in historic temperature data.
Everything is relative – even absolute zero. Even with the alarmist’s heat – we are still in a 9-year cooling trend (Jan – Jul data).
I’m trying to decide if your reading comprehension is as bad as this post makes you seem, or if you just hope that like Nick, if through out enough bafflegab, you’ll be able to fool enough people to make your quota.
OK, I’ll just quote what Dr Spencer says and you can explain what I’m not understanding…
Where’d I go wrong?
“Where’d I go wrong?”
Not thinking at all, not learning anything about anything.
A total lack of perspective due to innate gullibility and ignorance.
No understanding that UAH is very short term data showing warming out of the new ice age scare of the 1970s
Not understanding that the planet is still very much in a cooler period of the last 10,000 years, only a degree or so above the coldest period in those 10,000 years.
In other words.. a basic over-arching ignorance of anything to do with the Earth’s climate history.
Strange how Dr. Spencer, who knows a heckuva lot more about climate science than you, seems unconcerned about recent temperatures. Just like the rest of us. No apocalypse, Nails; not soon or ever. Sorry to calm your overactive imagination. You can go back to worrying yourself to death.
I didn’t mention any ‘apocalypse’, you did. So you may wish to reconsider whose imagination is running away with itself.
You are like a panic-stricken little child, repeating “it’s warming, it’s warming” over and over again !
You really seem totally petrified of a tiny bit of warming… out of the coldest period in 10,000 years
WHY ?
None of the global warmth came to the UK in July as we have had the coldest and wettest July in decades. The simple reason is the jet stream has been firing in low pressure systems from the Atlantic for the whole month and still is. Is this ‘unprecedented’? No, I have experienced summers like this before and not just here. I had a fortnight’s holiday in Bavaria where it rained at some point every single day, even on the nicest day. There was even snow on the Zugspitze. What is new from the ‘climate scientists’ is the claim that global warming has changed the jet stream but as usual, without any proof.
Yawn if you lived through the Medieval times, you would be spouting the same drivel you do here since you still fall for the CO2 did its paradigm it truly a sign that you have no idea what is going on.
No he would be burning witches, after all that what his ilk had to blame before CO2.
Burning witches and running around screaming that we needed to repent of [some mundane activities] or God will punish us any day now. Pointing to anything bad (disease, stillborn babies, animal attacks, war, drought, storms etc.) as proof judgment is already upon us and will only get worse.
According to the unthinking advocates of the global warming cult, any increase in temperature is proof that CO2 is finally causing the heating that they have been predicting for 40 years.
Any chance of a translation of this?
Any understanding of you learning to read and comprehend?
Given your lack of reading comprehension previously, it’s hardly surprising that you don’t want to understand this either.
LOL, you have no idea what is going on…….
No only the Medieval times. We can safely add the Roman and Minoan warm periods.
Satellites weren’t around in the 30’s and 40’s. Who knows what they would have shown back then!
They most likely would have shown higher spikes.
Why would you say that when you don’t have any evidence?
There is plenty of evidence that many parts of the world were as warm in the 1930s as now.
It has been posted before, so I won’t bother posting it again, because you will forget it within 30 seconds, and not learn anything from it.
Easy, because the ground based sensors were all showing higher temperature spikes during that time period.
No, but thermometers were and there’s a clear and consistent record. It’s getting warmer.
Yet there are plenty of thermometer readings UNAFFECTED by too much urban warming, that show that 1930/40 was a similar temperature from now.
Again, posting them for you would be a waste of time, because you won’t not learn anything from them, and would continue to parrot your same ignorant comments anyway.
Now you are lying because most people know it has been warming since the 1600’s thus you have nothing new to sell here.
I’m curious…which dataset do use as supporting evidence for the hypothesis that the global average temperature has been increasing since the 1600s?
We have anecdotal evidence. Glaciers, animal migration patterns, and sea level rise.
Do you know of a global average temperature dataset that uses those proxies?
It’s been getting warmer for well over 300 years, and only the last 70 years or so of that warming could have been caused by CO2.
Not that there is any real world evidence that much, if any, of the last 70 years of warming was caused by CO2.
I’m curious…which dataset do use as supporting evidence for the hypothesis that the global average temperature has been increasing for well over 300 years?
Maybe your new name should be UHI denier.
Look at the UAH record. All that UHI warming the air over the mid-Pacific and Atlantic?
We both know what I’m referring to. You are playing dumb. Also, both of those you mentioned have natural explanations.
Mid-Pacific: El Niño
North Atlantic: Excellent analysis right here https://judithcurry.com/2023/07/02/whats-causing-the-extremely-warm-temperatures-in-the-north-atlantic/
“You are playing dumb.”
No, it is NOT an act !
Mid Pacific is an El Nino developing..
Solar energy has also been quite high.
You do know that it is solar energy that warms the tropical oceans, don’t you.
Or are you ignorant of that , as well.
As usual, the terminally brain dead declare that every increase in temperature, no matter how small, no matter how short term is proof that after decades of predicting death just around the corner, they are finally right.
No, the long term trend is also rising, even in UAH.
No, this is a sudden event..
The long term trend in UAH is basically dead flat apart from the effect of two major El Ninos.
Once your little mind can digest that fact, perhaps your apoplectic panic attacks can stop.
Of course there is no evidence that more than a tiny fraction of that warming is being caused by CO2. The world has been warming for more than 300 years, and CO2 increases prior to 70 years ago were very minor.
BTW, please define which long term trend you are referring to.
Since the height of the Medieval Warm period, there is a slight downward trend.
If you go back to the middle of the Holocene Optimum the downward trend is even stronger.
As others have pointed out, it is the highest ΔT. That is no proof that the absolute temperature of the globe has increased remarkably. I’m not sure about UAH, but other surface temperature datasets use anomalies that are calculated by month, using a baseline of the station and not a “global temperature baseline”. The fact that ΔT has had a large increase does not mean the average absolute temperature has changed much.
This was the largest absolute temperature for any month on record for UAH. That’s all Dr Spencer is claiming.
Yet still well below the normal for the last 10,000 years
There is no evidence of any human or CO2 causing this slight spike.
There is no evidence that it is anything but a totally natural response to high TSI with a probable kick-along from the recent volcanic eruption.
So please, try not the panic too much… you will deplete the world supply of nappies.
Posters here spent the last month explaining specific surface temperature records. Do you not understand the difference? That we are all interested in the exact cause of this sudden jump in the satellite record, but anyone with a modicum of physics understands that this is not and cannot be due to CO2?
Well you’re the same guy who insisted the Hunga Tonga event would just disappear by turning into rain in the stratosphere, so I guess the modicom of physics comment is unfair.
“but anyone with a modicum of physics understands that this is not and cannot be due to CO2?”
Which leaves scientifically illiterate nitwits like FN out of the discussion.
Yes, “explaining” why they were all wrong. ‘Nothing to see here’ excuses, each with it’s own often ludicrous handle. Yet here we have UAH stating explicitly that yes, it actually was an exceptionally warm month. The warmest since 1979 at least.
As for Honga Tonga, that event occurred 18 months ago. We’re using it as the explanation for a very hot month a year and a half later? How does your understanding of physics explain that?
Complete ignorance as always from rusty.
No understanding the delayed response of ocean seismic activity, which corresponds very well to atmospheric temperature.
The fact that you think such a huge even as the Hunga eruption would not affect the global weather, shows just how mindless and stupid you really are.
You aren’t really going to pretend, even for a minute, that human CO2 caused the eruption or the warming spike, are you?
Or that CO2 was in any way responsible for this slight warming event
Let’s see your fantasy science explanation…. please. 😉
As I said.. you are too ignorant to join in any rational discussion.
Fascinating how you just dismiss the many scientific discussions over the last few months as just, excuses.
Thank you for admitting that science means nothing to you.
TheFinalNail – just like you don’t seem to understand that it doesn’t rain in the stratosphere (remember how you were confidently and sarcastically “explaining” to everyone for being so stupid on that point?) you don’t understand the difference between these two events.
Yes, there were some hot temps out there. Many of them have explanations that have nothing to do with CO2. If you wish to blame CO2 for things that it can in theory do, go ahead, but don’t make a fool of yourself and blame if for temp readings it could not have possibly caused.
Was July some sort of record? On an anomaly basis almost, on an absolute basis yes. Could CO2 have caused this? No. CO2 increases at about 2 ppm per YEAR which is less than 1/2 of 1 percent per year, and each additional ppm is less effect than the one before it due to CO2 being logarithmic. The Honga Tonga event on the other hand is a one time pulse into the stratosphere which caused a huge increase that we have not studied even in theory, let alone gathered data on. So, could it produce a substantial increase in temps with an 18 month lag? Maybe. I don’t think so. But is it possible? Yes. Are other explanations possible? Also yes.
Keep in mind that Dr. Spencer is insinuating that 150 Mt of H2O may be the cause of the dramatic warming in recent months. To put that into perspective that amount of CO2 is released every 1.5 days by humans. How does your understanding of physics explain how 150 MtH2O can cause so much warming in 19 months, but 38,000 MtCO2 over the same period does nothing?
I’m going to guess that you actually believe that all green house gasses are equal in strength and impact.
Then you have guessed wrong.
He tries really hard to hide what he really believes.
Injection into the stgratosphere rather than the troposphere, where water rains out, make no difference on your alternative planet?
I think it does make a difference. Anyway, if your point is that H2O does not condense in the stratosphere then surely you have anticipating the argument that CO2 does not condense in either the stratosphere or troposphere.
Anyway, my point is that I’m constantly being told that CO2 cannot have an effect because 38,000 GtCO2 is simply too small of an amount. Yet here we are and people are suggesting that a mere 150 MtH2O is the most likely candidate for the high rate of warming over the last few months. Surely you recognize the strangeness of that dichotomy. No?
No. CO2 and H2O are different, as are troposphere and stratosphere.
And most commenters recognize that CO2 has some effect, but so far beneficial. When and if we hit 560 ppm at the end of this century, the equilibrium warming effect might be 1.5 degrees C, not 3.0, let alone 4.5.
bdgwx, if you wish to look foolish, happy to oblige.
Human emissions of CO2 are about 8% of emissions frrom human and natural combined. So the amount per day of CO2 is 12 times larger than you allude to. Mother nature recylcles most of both, so almost everything emitted is then absorbed by photsynthesis. About 2 ppm per year is left over which must be measured against the backdrop of the 430 ppm we currently have. Small and growing smaller because CO2’s effects are logarithmic and so each additional ppm has less effect than the one before it. As the incremental change on an annual basis is tiny, it makes no sense that it could cause such a large change in a single month on its own.
H2O injected into the stratosphere on the other hand is all by itself. We do not know if there are natural processes that will absorb it or if it will just stay there. It is a major change to the water vapour concentration in the stratosphere, and a one time step change at that, not a gradual 0.4% per year increase of steadily decreasing effect. We have not studied or modelled such a thing. We have no measurements, no sensing equipment and no data. So, per Dr Spencer, could it be the culprit. Maybe. We don’t know.
If you still do not understand the difference between these two things then you may take a seat next to the TheFinalNail and perhaps the two of you can talk about how it rains in the stratosphere.
I say it is about 100 MtCO2/day.
100 MtCO2/day * 365 day/yr * 12 = 438 GtCO2/yr.
Note that 438 GtCO2/yr is 56 ppm/yr.
Does that sound right?
Yep. And we can use the Myhre 1998 formula to quickly estimate the logarithmic effect. A 1 ppm increase from 280 ppm is 5.35 * ln(281/280) = 0.019 W/m2. A 1 ppm increase from 420 ppm is 5.35 * ln(421/420) = 0.013 W/m2.
I know.
It’s not by itself. There is other stuff in the stratosphere including CO2. There are natural processes that deplete H2O in the stratosphere. It will not just stay there.
Is your hypothesis that it the amount of a substance is irrelevant and that only the duration of the pulse matters? Is the water vapor increase in the troposphere irrelevant because it occurred over a long period of time? If yes can you provide corroborating evidence?
See Jenkins et al. 2023 for an example of a study and modeling of such a thing.
https://acd-ext.gsfc.nasa.gov/Data_services/met/qbo/qbo.html
“It’s not by itself. There is other stuff in the stratosphere including CO2. There are natural processes that deplete H2O in the stratosphere. It will not just stay there.”
Exactly what are those natural processes? If it doesn’t rain in the stratosphere then where does the H2O go? Is it converted to something else? Does it diffuse back down into the troposphere? If so how fast does it do that? If the H2O gas volume is higher in the troposphere then in the stratosphere then how much diffusion downward will there be?
If you want to make an assertion like this you need to be able to back it up.
Jenkins 2023 is what tyou are citing? LOL.
Yes. That is what I cited. I’m responding to “We have not studied or modelled such a thing.” by pointing out that it has been studied and modelled.
Well, given that there is no evidence of CO2 causing any warming whatsoever,
And all this H2O went into the stratosphere, while the CO2 is constantly part of the lower atmosphere Carbon Cycle that gives life to the planet.
….. there is no way of comparing anything.
You alarmists are the people claiming an increase from 3 to 4 molecules of CO2 per 10 000 is responsible for the current warming (if that is indeed real).
I think you have me confused with someone else. I’m not claiming that the current warming (assuming we talking about the last few months) is caused by 3 to 4 molecules of CO2 per 10000. The irony here is that many people here are saying it is caused by 1 molecule per 80000 of H2O. I’m the one pointing out the absurdity of that dichotomy.
“in July. UHI, poor station sites, jet efflux at airports, scientific curruption on a global scale…”
Which were all PROVABLY TRUE.
CO2 warming.. still waiting for your evidence
Now explain how CO2 could cause a sudden warming event like this.
It will be funny watching your attempt at more non-science nonsense. 🙂
Liar.
Would “imagining” be a kinder word?
No.. A better description for your comments would be panic-based idiocy and basic all-round ignorance.
You live in your own little AGW fantasy-world bereft of any actual scientific knowledge or understanding
Kinder, but less accurate.
You won’t think that a month out of 522 really changes things very much, will you?
We all agree the world is warming. Having the warmest month toward the end is to be expected.
Bring on the warmth. Steve Case says it best.
Exactly. As long as it’s getting a bit warmer and not colder, I’m happy. Warmth is good, cold kills.
This beats the previous warmest July, from 1998 by 0.26°C.
Noticeable that apart from 1998, all the top 10 warmest July’s have been in the last 14 years, and all of the most recent 8 July’s have been in the top 10.
The pause remains unchanged in length, now starting in October 2014.
Mostly Los Niños years.
I make it an even split:
“As of mid-July 2023, the previously weak El Niño conditions in the central-eastern equatorial Pacific have strengthened gradually to a weak-to-moderate El Niño”
https://iri.columbia.edu/our-expertise/climate/forecasts/enso/current/
Not all the years have the correct ENSO with July.
The one belows are the correct definition. (the three months that end with July)
2023 0.64 Weak El Nino
1998 0.38 Neutral
2022 0.36 Weak La Nino
2016 0.26 Neutral
2021 0.21 Neutral
2010 0.20 Weak La Nino
2018 0.17 Neutral
https://ggweather.com/enso/oni.htm
El Niños and la Niñas are not things that occur in one specific month – they build up over time. Suggesting that July 1998 was in neutral conditions just becasue the MJJ period had gone negative is meaningless. Clearly July 1998 was hot because of the year long El Niño that preceded it.
The page you and I quoted tells you the strength of the conditions for each year, but as the season crosses the winter each year is written as say 1997 – 1998. Is that strength that I consider to be relevant to temperatures in July.
It is not meaningless because it only takes 3 months for it to adjust.
Why do you persist in comparing apples to oranges, months to years (both averages)? Even comparing Julies doesn’t tell us much, if you want to compare peak months. This especially true for temperature anomalies.IIRC the peak months isn’t a month, but the period of mid-July to mid-August n the NH.So, comparing calendar months is not comparing peak periods.
If you want to compare peaks temperatures you have to look at daily records. Are the absolute numbers and are the events increasing or diminishing?
El Nino of 2019-20 was pretty strong. Look at the UAH graph. It was almost strong enough to break the cooling trend.
But that’s not what determines if the year is an El Niño. It usually takes months before the ENSO conditions filter through to the UAH data.
July 2019 to February 2020 was well into El Niño territory:
https://www.weathernationtv.com/news/march-2020-el-nino-update-puzzle-time
From your source
The month becomes an El Nino when 3 successive months have been +0.5c or above.
It takes 3 months for ENSO conditions to filter through the UAH data.
https://www.woodfortrees.org/plot/uah6/from:2015.9/to:2016.2
Peak
2015 OND 2.6 (ONI)
2016 NDJ 2.6 (ONI)
On June 2023 the ONI was 0.5 meaning weak El Nino conditions will now be starting to affect UAH.
UAH isn’t showing ENSO conditions. It’s just showing temperature.
I was basing the strength on this page
https://ggweather.com/enso/oni.htm
2019 – 2020 (that is from JJA of 2019 to MJJ of 2020) was never in an El Niño, though it did get close.
It was an El Niño very weak but the main contributor to the warmth during that time was a sudden stratospheric warming effect.
1 2023 0.64 Weak El Niño
2 1998 0.38 Very Strong El Niño
3 2022 0.36 Moderate La Niña
4 2020 0.31 Neutral
5 2016 0.26 Strong El Niño
6 2019 0.25 Weak El Niño
7 2021 0.21 Moderate La Niña
8 2010 0.20 Moderate El Niño
9 2017 0.17 Neutral
10 2018 0.17 Neutral
https://origin.cpc.ncep.noaa.gov/products/analysis_monitoring/ensostuff/ONI_v5.php
Sorry, please ignore this as I tried to edit/delete as it is wrong. The correct version was posted not long later.
Ok just for giggles take a station somewhere in the US that has a long record and is still rural and said record has not been tampered with. It also has had a declining population and try to tell me that this July was warmer than the 30s. Also that a map of measured temperature in the 1930s and compare against this year. At no time this July did we have every state measure a day in July temperature of over 100 degrees. In the 1930s that happen.
The USA is not the world. It was below average this year in the UK – that doesn’t mean UAH is wrong, just that that’s not where it was hot.
“that’s not where it was hot.”
Ok , so not even “global” warming.. OK !
They honestly don’t get that they are their own worst enemy when it comes to claiming anything “global”!
And they conveniently ignore the fact that not even the UAH is “global”.
Earth has been warming for 400 years. You would expect recent years to be warmer (but not linearly so).
“Earth has been warming for 400 years.”
It has not.
“1650, not the start of the Little Ice Age, but the start of the coldest years midway through, i.e., the First Climatic Minimum” – Wikipedia That looks close to 400 years to me, but if you prefer 350 or even 250 that’s fine by me.
The wikipedia article is based on PAGES2K. Are you okay with that?
Meanwhile you didn’t provide anything better…… thus useless.
Same question to you…are you okay with PAGES2K?
I am.
Meanwhile you didn’t provide anything better…… thus useless.
I’m not saying there is something better. I’m only asking if Mike Jones accepts his own source.
Are you OK with warmng when you are sure warming is going to be catastrophic?
I was thinking, four months ago, that it looked like we were heading down, and wondering if it was the start of a huge downturn that might last 30 years, in which glaciers grow all over the world, the Arctic freezes to 30 feet deep and barely melts in Summer, there are blizzards in places that are not used to them, and that take months to melt, people freeze to death on the highways, and crops fail from awful droughts brought on by colder than normal air.
Like back in the 1970s.
I thought it might occur, and was not good with it.
Because I do not cheerlead for events I think will be unfortuitous.
But all you warmistas seem to operate in the totally opposite way.
Get mad when nothing awful happens. Make up lies when your disastrous predictions fail to materialize, then use those lies to terrorize children and the weak-minded into becoming drugs addicts and committing suicide.
So, are you going to cheerlead for panic and doomsday mongering? Will you say nothing when children are sure they have no future because that is what alarmists preach to them every single day of their lives?
Will you nod sagely and understand completely when people commit suicide because they are gullible lackwits and believe forecasts of doom, and become convinced they live on a poisoned world, and we will all soon be roasted alive?
I don’t consider it to be catastrophic.
There is not going to be a secular downturn until the Earth energy imbalance (EEI) goes negative. Not only is the EEI not negative, it is positive and increasing. [1]
Neither do I. We have that in common.
I think you have me confused with someone else. I don’t get mad when something awful does not happen. I don’t terrorize children. And I don’t lie. Though, I do make more than my fair share of mistakes and I am often wrong.
No. And if you track my posts you know I’m not kind to doomsday mongering.
No. And if you track my posts you know I’m not kind to alarmist preaching.
No. In fact, I’m an advocate for suicide prevention. I don’t think humanity will be roasted alive. And I do not share your position that people considering suicide are “gullible lackwits”.
I feel like I’ve made a good faith attempt at answering your questions. So if I may I would like to request that we steer this discussion back to the science. Do you accept PAGES2K?
OK, I concede that I was lumping you in with other people who share some of your views.
As for pages @K, I am not familiar at all.
I do not bother with echo chambers.
I have found that the conversations are not at all about information sharing when someone with contrary opinions shows up and comments, so I years ago just stopped even glancing at most climate sites.
I never return to a site that removes a comment I have made, so there are numerous skeptic-oriented sites I never look at either.
But as I said somewhere on this comment thread, I do not consider every scrap of info that comes from someone or some site that I disagree with, as being false, necessarily.
Also, it tends to occur somewhat frequently that a skeptic can refute the lame arguments of a warmista using warmista information and graphics.
Kind of like in a court of law when a lawyer posits a logical argument starting with something the opposing counsel has said.
Like, saying, “Let’s assume for the sake of discussion that what (the other guy) has said is true. Even in that unlikely case, his argument falls apart under scrutiny, and the correct conclusion is the opposite of what my opponent has asserted.”
IOW, it is a stronger refutation if one can use the information provided by the opposite side of a debate to show that that other side is incorrect.
I do not accept altered data sets, as a strong general rule, and I think that any person who does accept altered data has no basis for any opinions or ideas that rely on such.
Fruit of the poisoned tree.
Yes!
I know of no other endeavor that allows the “correction” of collected data. When I posted data in a lab journal, it was forever. If it was found unusable, it was marked as such and new data was collected if possible.
There is only one reason that the data changers have and that is to CREATE long records out of what should be a number of short records.
BTW, I do not have a position regarding suicide that is as you say. There are gullible people, and there are suicidal and people suffering from clinical depression, and people who are for many reasons leading lives which are devoid of hope and optimism, or any positive emotional states.
When these overlap, bad things are bound to happen at a higher frequency.
I also happen to know that for every person whjo does kill themself, there are many more who are merely terribly miserable, or who have tried and failed.
For every drug addict who dies of an overdose, there is a far larger number who are trapped in addiction and never do overdose.
And the numbers are growing fast for all these groups.
Kids in school are being force fed an overwhelming, pervasive, relentless, and ongoing message of doom and fear.
Some people are immune to bullshit, even at an early age. Many others are defenseless against it. They are being emotionally and psychologically tortured, and are defenseless against the bullies that they are forced to sit and listen to, all day, five days a week, 200 days a year.
No, Pages 2k is a joke. Run by extremists…
… with a pre-determined outcome.
I’m going to let you pick the fight about PAGES2K being a joke with Mike Jones alone.
Pages2K is an attempt to mimic Mickey’s Hockey Stick by manipulating and mal-adjusting tree and other data.
That was their aim, and after many adjustments, that’s what they got.
Pages2k is a conglomeration of subjective information that is truly impossible to patch together. If you think current measurements have uncertainties in the tenths digit, what do you think the uncertainty in tree rings are? There is simply no way to patch unmeasured data onto measured data with any accuracy whatsoever. A tree ring may show +2 degrees of an anomaly (doubtful and subjective) but there is no way to accurately judge the absolute temperature at which it occurred. Simply trying to “trend” ΔT’s into something resembling a temperature just isn’t possible. That is why a GAT is an unscientific metric to judge the “temperature” of the globe.
The only scientific procedure to do is to go on record as to what you think the perfect global temperature is and apply that to every station. That will give you a “global anomaly” for each station. No one will do that because, god forbid, it would require actual research as to what that perfect temperature would be. Holy Hell would break loose if it was warmer than it is today. At least you would have a metric that indicates how far the earth is from a perfect temperature.
I expect Wikipedia articles on controversial topics to be biased, and sometimes they are too biased to be used realistically. If however an article such as this one has not been too distorted then it’s a useful source because CAGWers tend to accept it. PAGES2K or not, it is pretty much in line with other sources.
So in the future if someone makes the claim that the Medieval Warm Period was warmer globally than today then you’ll support those who challenge the claim using PAGES2K?
Well, that is a distortion. I try to take everything on its merits. I can agree with a person or organisation on one thing and disagree with them on another, and that’s because I haven’t yet found anyone or any organisation that is right about everything or wrong about everything (though some do get close to the latter). I have even agreed with Nick Stokes on something here on WUWT.
A tremendous amount of effort from certain sources has been put into trying to remove the MWP from history or to claim that it wasn’t global. The problem with that is that they go into obvious distortions to try to support the claim. There is pretty compelling evidence of the significance of the MWP and there is pretty compelling evidence that those who try to remove the MWP from history are badly motivated (ie, dishonest). That isn’t absolute proof that the MWP was warmer than today or global, but it is pretty compelling evidence that it is reasonable to regard the MWP as warmer than today and global until someone proves otherwise.
It was not claimed to have been global. [Lamb 1965]
Can you post a link to global temperature reconstruction showing that?
Nobody has removed the MWP. It was a real phenomenon that almost everyone agrees occurred. Mann himself says the MWP was real and even published research with a hypothesis how it happened. [Mann 2002] [Mann et al. 2009]
Mann himself did remove the MWP in his 1998 paper. Mann only used the 2002 and 2009 papers to attempt to show the MWP was a regional occurrence. That didn’t refute the 1998 paper at all.
Read the following for the number of studies confirming that the MWP was global.
http://pages.science-skeptical.de/MWP/MedievalWarmPeriod.htmx
Your attempt to spin Mann’s papers without even mentioning published peer reviewed papers that have a different conclusion only cements your reputation of being unscientific. A real scientist would admit to and deal with conflicting conclusions.
Information has to be evaluated on the particulars of that information.
Nothing is true based on who said it. No news story that has not even been written yet can be graded for usefulness or veracity, sight unseen, in advance, based on it being sourced from some particular website.
The entire notion is the opposite of scientific.
Nothing is true because of who said it.
And who said something is not evidence, one way or the other, of value or truthfulness, let alone veracity.
Yes, it was cooling from the 1650s down to the end of the 17th century, at least for some parts of the globe. And it’s a lot warmer now. But that does not mean it’s been warming for the last 350 years (as in there has been continuous warming over that period). For much of time from the 17th to the 20th century temperatures were going up and down slightly but with no overall trend.
Indeed. The first 80-years of all the global data sets that start in 1850 (NOAA, HadCRUT, Berkeley) show no warming trend.
“Indeed. The first 80-years of all the global data sets that start in 1850 (NOAA, HadCRUT, Berkeley) show no warming trend”
Translation: After 40 years, my fellow end of the world doomsday catastrophists have managed to alter all of our favorite packs of lying lies to make it appear that there was no change in global conditions during the period that Earth finally emerged from the disastrous Little Ice Age, even though the years around 1850 was a notoriously cold time in all the history books, when such events as the Donner Party cannibalism episode occurred, and 80 years later, the world was in a terrible Depression caused in part by widespread crop failures, and these hot conditions would soon culminate in the Dust Bowl disaster.
You must be the worst warmista liar ever, dude.
Even Mikey Mann says that 1850 was about as cold as it has been in the past 2000 years, and 80 years later was hotter than it has been in 2000 years.
The truth is, almost all warming since the preindustrial period occurred during the period you state had no trend.
Significantly, during this time, there is only one large contiguous area that had anything close to widespread reliable weather data.
According to all of that data*,1850 was very cold, and the 1930s was the hottest period on record to this day.
*Adjusted or altered time series’ are not data, they are misinformation or outright disinformation.
Period of time in which TFN claims there was no trend, using infamous Warmista Hokey Schtick graph from Leftopedia:
That graph is based on PAGES2K. Are you okay with that?
So you admit that Mickey Mann was wrong..
Ok !
NOAA, HadCrud, the Berks….. create whatever they want to show.
Bellman, you appear to have missed the “warmer (but not linearly so)” in my original comment. There was no claim of continuous warming.
I took you to mean the not linear was in relation to recent years. Your exact comment was:
“Earth has been warming for 400 years. You would expect recent years to be warmer (but not linearly so).”
I was responding to your first sentence. It’s not correct to say it’s been warming for 400 years when there are periods of 100 or more years with no warming.
If the warming over the last 400 years has not been continuous, then what’s the point of mentioning it? Whenever I see these sorts of claims the argument is always that this must mean the current warming over the last 50 or so years just the natural result of the warming that started 300 years ago. But that argument makes no sense if almost all the warming over the last 300 years actually happened in the last 100 years.
As an example, take a look at the chart “Geologic evidence (millions of years)” in Wikipedia’s Global temperature record page. Yes it’s Wikipedia again, for the same reasons.
There is a very clear cooling trend over 5 million years. Yet within that period there were many periods of sharply increasing temperatures including the Holocene right at the end. Earth’s climate is non-linear. It is perfectly normal for a period of one trend to have within it periods of the opposite trend. This applies to all periods of any length.
Incidentally, while I am happy to use that Wikipedia chart as an illustration of a general trend, I am not too keen on using it for its detail. That’s because the original authors of the chart, Lisiecki and Raymo (2005), distorted the data to try to align it with what they thought was the underlying cause (read the Discussion in the Wikipedia article). Some years ago, I asked them for the unadjusted data, but received no reply.
“It is perfectly normal for a period of one trend to have within it periods of the opposite trend. This applies to all periods of any length.”
Indeed. But that doesn’t mean you can assume it just happens. The claim is that because it was warming in the early 18th century, then late 20th century warming must just be a continuation of the same process. That is the implication of saying it’s been warming for the last 300 years.
You say there was “no overall trend from the 17th to the 20th century”?
That is utterly ridiculous.
Shall we use the middle of each of those centuries, or the beginning, or the end, or what?
Beginning of one to end of the other?
No matter which we look at, the 17th century, meaning the 1600s, was a disastrously cold period, and by the 20th century, the Little Ice Age was over, and indeed by the end of the 20th, some people were claiming it never existed.
So in the period you specify, it went from about as cold as it has been in the past 8000 years, to nearly as warm as parts of the Medieval Warm Period.
Looks like a trend to me.
Perhaps you meant to say “continuous” rather than “overall?”
Only warmista liars have ever asserted there has ever been a stable period in which temperatures did not change over a long period of time, such as centuries and millennia.
And it sure did take a lot of erasing and book burning and lying to even begin to tell that whopper.
“That is utterly ridiculous.”
Sorry, that should have been 18th century, not 17th.
BTW, I submit as source material, the very first IPCC report, but I can find many others to submit for your approval if you disbelieve the IPCC. Do you disbelieve the IPCC?
 ?fit=300%2C172&ssl=1
I “disbelieve” that ancient graph, for reasons that have been hammered out over the decades. But even it demonstrates my point. No warming (at least In England) from the middle of the 18th century to the end of the 19th. A 150 year pause difficult to see how the spike that followed the 1690sis responsible for the warming that happened 200 years later.
The warmista position is that the level of CO2 in the atmosphere controls the temperature of the planet.
Anyone who has studied Earth history knows this to be false.
For some reason, or more likely, set of reasons, all proxy evidence of past conditions shows very clearly that there are huge changes at every time scale, in whatever interval one chooses to study.
Since no one has any clear and consistent explanations that show why these changes occurred, it follows that no one knows or can explain all of the trends and changes in trends which have occurred in the past.
Nor has anyone given a cogent reason to suppose that whatever factor or set of factors that was causing all of those changes, is not still operating to continue to do so.
IOW, unless one can explain exactly how and why we had large changes in temperature in the past, operating on many separate time scales, it is scientifically unsound to suppose that future trends can be predicted based on a factor that was not operating during those previous eras.
CO2 cannot be shown to have led changes in temperature at any time and at any scale of time in previous intervals. In fact in some very clear examples, the opposite can be shown to have been the case. Changes in CO2 concentration and temperature recorded in ice cores and benthic foraminifera (among other proxies), show clearly and repeatedly that since the time of the onset of the Late Quaternary Glaciation, changes in temperature have preceded changes in CO2 by many hundreds of years.
Warmistas have in the recent past used ice core data to try to sell their hypothesis as factual, but then it became plainly and undeniably apparent that the ice cores in fact refuted the CO2 leads global temperature hypothesis of warmistas, at which time the whole subject was immediately discarded by them. It is now impossible to even find anyone among the warmistas that is even willing to discuss the subject of the ice core data.
Over a great many time scales, it can be shown that CO2 and temperature are poorly correlated or completely uncorrelated, just as it can be shown that warmer temperatures than exist today have occurred at times when CO2 was very much lower.
It is also the case that no evidence exists whatsoever, besides unevidenced assertions, that warmer temperatures are dangerous, harmful, or bad. The evidence has long been recognized to show exactly the opposite. Cold periods are very bad for life in general, and human endeavors in particular.
And CO2 is not a dangerous molecule, or a harmful one, but is in fact the essential building block of every single molecule in every living thing which has ever existed.
And it is currently not elevated, but very low by all historical standards except the most recent past.
There is nothing harmful about it. Life prospers ever more bountifully as levels of it increase, and life forms that depend on it do best when it is several times higher than present atmospheric concentrations.
Numerous biological, geological, and chemical processes remove it from availability to the biosphere, and this has over many millions of years resulted in a dangerously small and dwindling concentration of it in the atmosphere, recently reversed, quite by accident, by human beings discovery of the utility of fossil fuel energy sources.
It is only the unreasonable notion that any changes wrought by human beings to the existing environmental conditions as being necessarily and by definition bad, that could ever lead anyone to suppose that we have to limit and even lower CO2 in the air.
Such is the degree of illogic employed, that we have reached a state of denial of reality, wherein actual scientists, or more accurately by people who claim to be that, refuse to acknowledge the basic biological reality that all life depends on CO2, that photosynthesis of CO2 and H2O into glucose powers the entire biosphere, and that every other molecule in every living thing is built from those molecules of glucose created by photosynthesis.
You are being too logical. Logical thinking about natural phenomena is not a common trait among climate scientists and CAGW advocates.
By disbelieving that graph, you are dismissing what was known to be true back before this issue became a political one, data sets were altered by people with a particular hypothesis and point of view, and all such information was changed by them to comport with their radical and highly controversial ideas.
I cannot begin to imagine why information manufactured by people with a political agenda, who have a 40 year record of being continuously wrong about every prediction they have ever made, is somehow believed to be truthful, while information compiled over a far longer period of time by researchers who had no agenda besides for accurately documenting and describing what was occurring is rejected as being “ancient”.
Data collected in real time and pertaining to the physical conditions that were observed by highly trained and unbiased individuals, is not ancient.
And nothing was hammered out.
No process having anything to do with science was employed.
This data was inconvenient, as it directly contradicted and disproved the contentions of those who discarded it and replaced it with fabricated information, the only value of which is that it comports with the narrative that those same people invented.
By rejecting it, all you are really saying is it does not fit in with what you have previously decided you want to believe.
And that political propaganda is more important to you than objective data.
There is a not a shred of evidence that what everyone agreed was true at the time, was somehow mistaken.
It was not shown to be wrong, it was simply erased and replaced by fabrications.
“By disbelieving that graph, you are dismissing what was known to be true”
“Knowing” something to be true is not a substitute for data. What is that graph meant to represent, who produced it, what data was used, and why does the IPCC refer to it a schematic?
The graph is a mess. No indication of the temperature scale. Presumably the marks are meant to indicate 1°C, but that isn’t specified and there is no indication of what the base of the anomaly is. There’s a dotted line that represents approximate temperatures at the start of the 20th century, but this doesn’t line up with the middle break point of the y-axis. Meanwhile the x-axis is labelled “Years before Present”, but that’s obviously wrong as the scale is marked in centuries AD.
In fact it seems likely it was based on the work of Lamb, and the later part seems to be a smoothed graph of CET, up to the middle of the 20th century. I’ll attach the 30 year rolling average for comparison.
But in either case my point stands. There has not been continuous warming since the end of the 17th century. Also note that on the IPCC schematic temperatures are now well above the top of the medieval warm period.
True , only for about 200-300 years.
THANK GOODNESS FOR THAT WARMING
Yet still humans die from cold around 10-20 times more often than from heat.
Still retreating glaciers uncovering tree stumps of tree that grew during the MWP and earlier.
More like 300, since the end of the Maunder Minimum.
Evidence of a sudden jump in atmospheric CO2, bellboy?
Evidence that this SUDDEN warm spike is caused by CO2 or human anything in any way shape or form..???
We can’t wait for more of your anti-science nonsense. 😉
I see the inability of some here to argue without using meaningless insults continues unabated.
“Evidence of a sudden jump in atmospheric CO2”
Nobody has claimed there has been a sudden jump in CO2, so why would you expect evidence of it?
“Evidence that this SUDDEN warm spike is caused by CO2 or human anything in any way shape or form..???”
Nobody has claimed the sudden warming is “caused” by CO2 (certainly not me), so why do you want evidence of it. Nobody knows exactly why the last couple of months have been so warm – it’s probably down to a number of factors, and anyone saying they know the one true cause is deluded.
I am wondering if you are unable or unwilling to answer his statements with evidence you dodge over and over, it is boooriiiing!
I did answer the statements. I’ll try to be clearer. There is no evidence for a sudden jump in CO2 because there hasn’t been a sudden jump in CO2. There is no evidence that CO2 caused this month’s spike in temperatures because this month’s spike in temperatures was not likely to have been caused by a spike in CO2.
If people find these answers boring, maybe they should stop asking me so many boring questions.
So, you are admitting that this little spike is almost certainly TOTALLY NATURAL.
With no evidence of any CO2 or other human cause.
Thanks. !
As always you ask what you think are gotcha questions and then draw your idiotic conclusions from the answers.
No. I am not admitting or claiming anything about the current unusual global temperatures. As far as I know, nobody has an explanation for this month. There may be multiple causes natural or other.
Keep in mind that according to Christy et al. 2003 the uncertainty on monthly anomalies is ±0.20 C. That means we cannot eliminate the possibility that a significant portion of this month’s increase is the result of a random effect. So not only has it not been said that the rise is either natural or anthropogenic but that the measurement itself could be biased too high this month.
/yawn/
next…
Well, if you insist.
Here’s the graph of July anomalies.
It is now August, and you are still alive from that terrible July
climateweather waves with inevitable quieting of the “look it is hot very hot” screams as the Sunshine hours is declining towards the early fall which means declining hot days hours.Then when a torrent of record cold gets ignored by you and other 1/2-year worriers it exposes your irrational viewpoint of the world.
I’m sorry, but my skills with graph making don’t extend to plotting next month’s anomaly. This is a post about the current anomaly. Surely it’s on topic to discuss it, and how unusual it is. If August turns out to be unusually cold I dare say we will be discussing it then.
Instead of whining about your lack of tools, go buy yourself a real graphics package.
Could you provide the details of any package that can display data foronths that haven’t happened yet?
Maybe you could recomen it to Spencer. It would be great to know what August’s anomalie is.
Are you saying your linear regressions are worthless for forecasting?
If so, why bother with your trends.
As far as a package, you get a regression equation that draws the line between your data. Are you asking how to get Excel to make calculations for future intervals using that equation?
Your questions are really becoming inane.
What are you whimpering about now? What trends? I’m certainly not going to use a simple linear trend to predict what August will be.
Read the thread. This started because Sunsettommy complained I was still talking about July temperatures when it was now August. At least I think that was his point.
I’m merely pointing out that this article is about the month we have data for and not the next month which is still speculation at this point.
I can’t speak for Bellman though I suspect he would share my sentiment here…If the July anomaly drops below the 1985 value I would definitely notice and discuss it openly.
How do you normalize the weather conditions between 1985 and today? If you can’t normalize between one month in one year with a stagnant high pressure system and the same month in a different year with a stagnant low pressure system then how do you compare the two?
Why should I care about these inane “anomaly” calculations”
The whole thread, starting with the OP, is about anomalies. You probably should skip it.
What is the variance associated with your “average global temperature? Either the variance of the absolute value or of the anomaly will suffice. My guess is that you don’t have a clue meaning you also don’t have a clue as to the uncertainty of the average values you are stating!
He doesn’t know the variance, doesn’t care, and won’t answer.
It’s his religious dogma.
Another trendologist exposes his lack of reading comprehension.
No surprise, really.
If you don”t care about the UAH data, why are you reading this blog? And why are you attacking me for pointing out what that data shows and not Spencer or WUWT for highlighting it?
So you would rather live in a bubble of confirmation bias? I wouldn’t be surprised at that!
Yes I want to live in a bubble of confirmation bias. That’s why I keep using the UAH data set even though it’s the one that I have least confidence on. That’s why I keep trying to debate with those who I most disagree with.
Meanwhile you and Karl is so confident you know that UAH is a fraud that you won’t even discuss it with Spencer.
You just continue to show that you have absolutely no understanding of physical science at all.
The re are two issues with UAH. One is its uncertainty – the same issue as all of the climate models and other data sets.
The other is the concept of a “global average”.
Neither of these make UAH a “fraud”. It is just unfit for the purpose for which the CAGW clique is using it.
UAH is *not* a predictor, it is a record of the past. The past is not prologue. The past is not the future. Even Monckton only uses UAH as a *record* and not as a predictor. He uses that record to deduce physical relationships. It is those physical relationships that can be used to “predict”, but there is even a measure of uncertainty in that because you need to know *all* relationships to create an accurate prediction.
Temperature is not a physical relationship description, it is a poor proxy for anything. We’ve had the capability of converting to using enthalpy for 40 years. But climate science has never once attempted to do so, preferring to use the argumentative fallacy of Appeal to Tradition to continue using past protocols. The reason typically given is “to maintain a long record” but that is just a smoke screen. You could easily do BOTH! The real issue is that no one wants to risk having predictions based on temperature alone invalidated.
Please note that UAH can’t provide for enthalpy measurement because it can’t measure humidity, pressure, or anything else needed to calculate enthalpy at any point in the biosphere.
Yup, yup, yup, and yep.
“Neither of these make UAH a “fraud””
You think UAH publish meaningless figures with no mention of the huge uncertainties, yet don’t think that’s a bit fraudulent?
“It is just unfit for the purpose for which the CAGW clique is using it.”
Very few do make use of it. At best it’s just one data source amongst many. The only people how put it, and it alone, to any purpose are those writing for WUWT. And that’s because it shows the least warming.
“UAH is *not* a predictor, it is a record of the past.”
Why on earth would anyone think it’s predicting the future? There’s a reason why July’s figures are only published in August.
“Even Monckton only uses UAH as a *record* and not as a predictor.”
Well, apart from his realitometer which is trying ot compare the past UAH rate of warming with a supposed modeled rate of warming for the end of the century.
Go look up what the legal definition of fraud is. You obviously don’t know.
More of his psychic projection:
“The only people how put it, and it alone, to any purpose are those writing for WUWT. And that’s because it shows the least warming.”
So literally minded when it suits you. I’m not suggesting you believe a legally defined criminal fraud has been committed. But you’ve been quite keen to throw that word around for all sorts of reasons in the past – infilling data, reporting too many significant figures any adjustment of data.
Oy! Bell-(appropriate adjectives) is back to psychic projections.
If you have discussed it with Spencer, what did he have to say about the uncertainty in his data? Did he accept that the uncertainty of a monthly anomaly is at least ±1.4°C or whatever you are currently claiming. Does he accept that a real scientist will publish all the variance in the data, and that in any case a global average is a meaningless statistic?
Is this all you’ve got? A red herring? I don’t HAVE to discuss it with Christy in order to be able to assert that he is mischaracterizing the measurement uncertainty!
Again, what he is using is the variation in stated values as a proxy for the uncertainty in the measurements. That’s a physical impossibility – something you refuse to admit. It’s part of the meme that you continue to apply, all the while denying that you do: “measurement uncertainty is all random and all cancels”.
The variation in daily temps are a measure of the WEATHER for each day. Weather is *NOT* climate. It’s why months like May and September have wider variations in daily temps – they are the months where you see transitions – from winter to spring, and from summer to fall/winter.
The third week in July this year Kansas was under a high pressure system with high temps. The last week in July Kansas saw a low pressure system begin to move in and temperatures moderate. The average temperature for July, 2023 was a combination of the WEATHER CONDITIONS in existence over that period. Last year, 2022, the weather was different. We didn’t have that stagnant high pressure causing extremely high temps early in the month.
Now, does the fact that the July, 2023 average temp was higher than July, 2022 tell you that we are seeing a warming climate or just that the weather patterns were different for each year?
Your lack of reading comprehension is off the charts:
“you and Karl is so confident you know that UAH is a fraud”
Neither Tim nor I have ever made such an assertion, this is just another example of psychic projection by you.
You just described his values as inane. you think the data has huge uncertainties to the extent that it’s impossible to tell if any month is warmer than any other month, and you say the think it’s measuring, a global average isn’t fit for purpose.
If you believe there’s no useful information in all these monthly anomalies, don’t you think it’s fraudulent to keep publishing them as if they were useful, with no mention of uncertainty?
Clown!
What I have stated many times is that the real uncertainty has not been quantified and is therefore unknown.
And you still can’t read, even after being led around by the nose.
And you have the memory of a goldfish.
The only “anomaly calculations” I was using in that graph where those from UAH.
Duh! You cherry picked all the July numbers and plotted them with connected dots.
This is inane.
But you didn’t say my graph was inane, you said the anomaly calculations were inane.
It makes sense to compare all July values, because then you are comparing like for like – and it’s hardly cherry picking when I’m using all the July figures.
As far as using lines – generally I prefer just showing points as the lines can be distracting, but with a sparser graph it helps to make the flow better. Hopefully nobody here is going to assume that means that there was a continuous change from one year to another.
The alternative would be a bar chart, but that can be misleading regarding the base period in my opinion.
Here’s the same for the month of January, just to avoid the charge of cherry picking.
“It makes sense to compare all July values, because then you are comparing like for like – and it’s hardly cherry picking when I’m using all the July figures.”
As I have pointed out – you are *NOT* comparing like for like. You aver comparing WEATHER, not climate.
This July was hotter than last July because of WEATHER, not because of climate. This year we had a stagnant high pressure system. Last year we didn’t.
Until you can figure out a way to normalize temperature readings for WEATHER, any comparison attempting to show climate change is a fool’s errand.
The entire climate science discipline today is littered with this kind of idiocy. Instead of comparing weather patterns over time they take the easy way out and try using temperature values – which are the worst possible proxies one can imagine! Comparing weather patterns or using enthalpy is HARD. It will take some innovative thinking to even develop the measurement systems needed to track changes in weather patterns. Enthalpy could be done today but isn’t used because it might falsify “global warming”.
And here you are, along with the rest of the CAGW clique, trying to defend the indefensible and you don’t know enough physical science to even realize it.
In most cases, the data will exist to to reconstitute historic weather patterns. Bill Johnson, Anthony (Watts and Banton) have experience with met data, so know this better than me.
As far as I know, at least the daily minimum and maximum pressures were recorded along with the minimum and maximum temperatures, as well as relative humidity and rainfall.
Synoptic charts were manually drawn using the data from weather stations. Met organisations are sure to have computerised this.
Who knows? Finding long-term patterns in weather patterns might come in handy for keeping Skynet amused.
No, the data doesn’t exist much before 1980. In order to track weather patterns you need at least hourly records of everything you can think of, pressure, humidity, wind, etc. and you need it at terrain level grid scale. And you need it not jut at the surface but aloft as well. Low pressure and high pressure systems have impacts thousands of feet up in the atmosphere.
Two readings per day are simply not sufficient. Look at the attached graph. At 7AM today a low pressure front moved through bringing rain (not measurable here but it wet the pavement). That low pressure held the temperature stable until almost 9AM, well after sunrise, when the low pressure moved out and the atmospheric pressure started back up. Temperature rose slowly till abut 1PM when the pressure started back down. The temperature shows a *big* spike upwards between 1PM and 2:30PM, going from about 78F to 88F, ten degrees. From sunrise to 1PM the temperature had only risen from 74F to 78F, 4 degrees.
If you can’t capture these spikes then you can’t capture weather patterns either, at least not with enough granularity to be really useful. I can’t see how you can normalize temperatures to eliminate weather pattern effects if you don’t know the weather patterns.
It was WEATHER that caused both the stagnant temp in the morning and the peaking temperature in the afternoon, not climate change.
Yes, the resolution is quite limited, but a broad (albeit blurry) picture can be painted.
Even daily reconstructions of broad-scale surface synoptic charts have to add information to daily midpoints of maximum and minimum temperatures.
The information is available to produce isobars, isotherms and isohyets at continental scale.
“The information is available to produce isobars, isotherms and isohyets at continental scale.”
I might buy this with the proviso that the information means nothing if its not used. How much of a global record do we have of synoptic charts? Who is going to digitize them into a database usable for a “global” ( or even continental) study?
You would still have the problem of how do you put the information into a form useful for comparing locations across the globe to come up with a “global average temperature” across time? You would still have the problem that temperature is not weather and it is weather that determines climate, not temperature.
The synoptic charts were produced from data recorded at the weather stations, so ca can be produced again using the software used to generate them from current weather station data.
There will be human judgement involved in adding features such as fronts and troughs, but the bae bones are almost certainly computerised.
That raises an interesting question about comparing past synoptic charts and their modern equivalent generated using the historic data.
The historical synoptic charts should have been archived by the meteorological organisations, but in practice would probably have to come from newspaper archives.
What is probably most important is large-scale features, such as the latitudes where the high and low pressure systems run. Those determine cloud cover, rainfall, and nasty cold fronts from the poles.
Summarisation loses information. “Global Average Temperature” is a rather limited proxy for enthalpy, and that in turn is a limited proxy for pressure systems or “weather”.
One would hope that ongoing research is being conducted into more than just temperatures. The GCMs seem to fit into this area, but there isn’t wide coverage about how well they hindcast aspects other than annual GAT.
“The synoptic charts were produced from data recorded at the weather stations, so ca can be produced again using the software used to generate them from current weather station data.”
The operative word here is “current”. Not past. Earlier than about 1980 the data just isn’t there. And I question if data with enough granularity exists before 2000, especially on a global basis.
It’s not enough to just focus on the US if you are looking for global weather patterns and how they change.
” but the bae bones are almost certainly computerised.”
I would agree after 2000 but that data is certainly not being utilized or climate science would have moved to using true enthalpy instead of the poor proxy temperature is. The same data needed for tracking weather (humidity, pressure, elevation, etc) is exactly the same data needed to track enthalpy.
“but in practice would probably have to come from newspaper archives.”
Which certainly don’t have the granularity that is needed for a true scientific approach.
““Global Average Temperature” is a rather limited proxy for enthalpy, and that in turn is a limited proxy for pressure systems or “weather”.”
Temperature truly isn’t a proxy for enthalpy. That would only be the case if the rest of the environment were static, e.g. pressure and humidity for example.
It’s not obvious to me that *climate science* is doing much except for temperature.
Globally, that’s quite likely. However, the British have had a long-term obsession with the weather and recording aspects of it, and that carried through to most of the former colonies. As a result, quite good records exist for Canada, India/Pakistan, Australia, New Zealand, Egypt, various regions of southern Africa.
Synoptic charts principally exit for the purpose of representing the pressure systems, with a few bells and whistles thrown in for luck. As far as I know, these records exist for most of Australia back to the 1850s. There don’t seem to be suggestions that air pressure readings are dependent on the enclosure, so that data should still be valid.
Is it as complete and granular as more recent data? No. Is it sufficient to reconstruct continental scale charts? I would argue that it is. Are pressures accurate to +/- 0.1 millibar? Who cares?
What is important is the latitude of the high and low pressure bands.
As noted above, the other former British colonies also kept good records.
More’s the pity.
I’m not disputing that records exist. The question is if they are granular enough for the purpose. I provided you a graph in my original message showing that pressure fronts can move through (or forward and backward, or sideways, etc) over just a few hours. Probably in minutes. They have a big impact on temperatures and enthalpy, even determining minimum and maximum temperatures and enthalpy.
The question is whether or not readings taken once or twice per day are sufficient to track weather patterns over time. I’m not convinced.
The short answer is “no”.
The longer answer is “Not a hope in Hell”.
Australia by and large makes Kansas look mountainous.
Most of our pressure systems take between 3 and 10 days to move across the continent from west to east. The only major exceptions are Queensland cyclones which come in from the east and head south once they’ve weakened to strong depressions, and East Coast Lows which form off the New South Wales coast, bring a lot of rain and gradually head SE towards New Zealand.
Those broad scale systems can be reconstituted from daily readings, and should provide useful information on long-term changes.
“Australia by and large makes Kansas look mountainous.”
What you lay out for tracking weather in Australia is not applicable to much of the globe.
You may well be right. Large mountain ranges on the western side of a continent could well make quite a difference.
Sub-Saharan Africa may be similar, but is unlikely to have the long historical data we have.
From my point of view, Australia is applicable to Australia 🙂
As was written in the other thread, averaging air temperature is the only wrench in their toolbox.
And Bellman, the world’s great expert on temperature measurement uncertainty, claims that U(T) = 1.5K is “way too big!!“
“And Bellman, the world’s great expert on temperature measurement uncertainty”
Your obsession with me is not healthy.
“claims that U(T) = 1.5K is “way too big!!“”
If that’s the actual uncertainty for UAH, then yes it would be worryingly big. It makes UAH data not fit for any purpose and makes Monkton and WUWT idiots for putting so much faith in it.
You’re the idiot who keep exposing his abject lack of knowledge about the subject, not I.
I see we’ve reached the “I know you are but what am I” stage of the argument. Time to put karlo back in the ignore file for a while.
Oh yeah, by responding to each and every post.
Every month you turn up, demonstrating how clueless you truly are.
Pee Wee died this week. km gets the job….
It *IS* worryingly big. And it is even bigger for the land and ocean data.
None of it is fit for purpose.
“As I have pointed out – you are *NOT* comparing like for like.”
It makes more sense to compare one July with another July than to compare it to a January – that’s the point.
“You aver comparing WEATHER, not climate.”
Yes. So? If we want to compare global climate we can look at longer averages.
“This July was hotter than last July because of WEATHER, not because of climate.”
You don’t think a warming climate will affect the weather. Or an unusually warm period tells us anything about climate?
“Until you can figure out a way to normalize temperature readings for WEATHER, any comparison attempting to show climate change is a fool’s errand. ”
You look at long term trends in the weather. Unless the weather is conspiring to just keep getting hotter and hotter with no change in the climate, you can assume that long term trends in the weather are caused by changes in the climate.
“And here you are, along with the rest of the CAGW clique, trying to defend the indefensible and you don’t know enough physical science to even realize it. ”
What do you think makes me part of this clique. I don’t even know what you think CAGW means. All I’ve defended is Spencer and Christie from charges that there data is not fit for purpose. I can do that despite not agreeing with many of their views on climate change.
There is no “The Climate” — something you trendology lot will never grok.
You are trying to create a time series without knowing the basics. Here is a site that explains some basics.
https://www.cfainstitute.org/en/membership/professional-development/refresher-readings/time-series-analysis#:~:text=A%20time%20series%20is%20mean%20reverting%20if%20it,covariance%20stationary%2C%20then%20it%20will%20be%20mean%20reverting.
There are strict rules for using linear regression on time series. Have you made those checks?
Would you call this graph a “mean reverting” time series? What ramifications does that have for a linear regression?
Tell everyone what the ramifications of averaging ΔT’s that have different variances are! Is that proper statistically?
I never said it was a time series. It’s simply showing all the values for July in chronological order.
“There are strict rules for using linear regression on time series.”
Then explain what those “strict rules” are, rather then just linking to a financial web site.
But I’m not sure what point you think you are making here as I didn’t do a linear regression or any other analysis on the July values.
“Would you call this graph a “mean reverting” time series?”
Of course not. That’s the point, temperatures are rising.
“What ramifications does that have for a linear regression?”
It means the trend won’t be zero.
“Tell everyone what the ramifications of averaging ΔT’s that have different variances are! Is that proper statistically?”
Again, the only person who’s done a linear regression in this article is Dr Spencer – did you ask him if it was “proper statistically”? Will you ask Monckton if he publishes a pause article this month?
“I never said it was a time series. It’s simply showing all the values for July in chronological order.”
What is the label on the x-axis of a chronological order of data?
“That’s the point, temperatures are rising.”
You are comparing WEATHER, not temperature. Weather, such as the stagnant high pressure that has been cooking the southern US, is *NEVER* accounted for as a confounding variable when looking at temperature trends. The WEATHER is what caused the big jump in temp between July, 2022 and July, 2023. Unless you can show that the 2023 weather pattern was caused by rising temperatures (instead of the other way around), you do *NOT* know enough to assert rising temps due to global warming.
Call it a time series if you like, but it’s only of one part of the year. But I wasn’t treating it as a time series, just an illustration of how this July compared against others. My original point was just listing the 10 warmest July’s in order of anomaly – not year.
Here’s the graph ordered by rank, 2023 is the first one.
You are *still* comparing points in time with different weather patterns. That’s not proof of “global warming”.
And your graph *still* has time involved! Take away your color index and what use is the graph? You are just displaying a time series in a different manner! The same problems exist – and the biggest one is that you can’t determine a causal relationship with CO2 from the data you display.
Positive anomalies exist from the 80’s through the 2000’s. Negative anomalies the same. Yet CO2 was rising continually from the 80’s through the 2000’s.
That should be a trigger for anyone with an open mind to realize that the weather is a major contributor to the anomalies – AND that the weather is not temperature driven but vice versa!
If the driver were rising temperatures from CO2 then the anomaly rankings would be a linear rise as well since the difference between present temps and the baseline average would keep going up!
“That’s not proof of “global warming”.”
What would constitute proof of global warming to you?
To me the “proof”, or as I would say “evidence” of global warming is the statistically significant warming trend seen in global figures, whether from the satellites over the last 44 years, or surface data since the 70s.
One hot month does not proof anything, any more than a single cold month proves there is no global warming.
“And your graph *still* has time involved!”
I really don’t know why you are so obsessed with time, unless you are actually interested in the warming trend.
“Take away your color index and what use is the graph?”
It demonstrates how much warmer one July was from the others, and if you know that one month is the one we are discussing it demonstrates Dr Spencer’s point that this is an usual month.
“You are just displaying a time series in a different manner!”
Some might wonder why you are so scared of a time series.
“The same problems exist – and the biggest one is that you can’t determine a causal relationship with CO2 from the data you display.”
You really are obsessed. You are so scared that it might be correct that rising CO2 causes rising temperatures, that you can’t even accept a time series showing a warming trend lest it might tempt people into drawing that heretical conclusion.
But if you were so confident that CO2 is not causing the rise, why would you worry. You could just demonstrate what else might be causing it.
“Positive anomalies exist from the 80’s through the 2000’s. Negative anomalies the same.”
To be clear, which months are positive and negative depend on the base period. UAH changed to a more recent base period, which turns some positive anomalies negative, due to all the global warming that doesn’t exist.
But it should be obvious even to you that there are more positive anomalies in the later parts of the data than the earlier parts.
For July, up to the year 2000 there were 3 positive anomalies compared with 18 negative ones. After 2000 there were 16 positive anomalies compared to 8 negative. There hasn’t been a negative anomaly for 10 years.
“That should be a trigger for anyone with an open mind to realize that the weather is a major contributor to the anomalies”
You keep hitting those strawmen. Nobody has ever argued that fluctuations in individual monthly and annual anomalies are not due to weather – most noticeably that caused by ENSO conditions. That’s why we keep trying to tell you that the pause is a bogus statistic. It’s mostly describing the weather.
“If the driver were rising temperatures from CO2 then the anomaly rankings would be a linear rise as well”
Only if you believe that there can only be one single thing affecting global temperatures. Surely even you can see that it’s possible for two things to be happening at the same time. Weather can control changes in temperature from month to month, but CO2 (or postage stamps, or whatever) cause a longer term persistent warming trend.
“””””But it should be obvious even to you that there are more positive anomalies in the later parts of the data than the earlier parts.”””””
And you assume that means there is continuous warming.
The issue is not that there are more above the than below. The point is that what goes up also comes down.
From Wikipedia:
“””””Regression toward the mean is thus a useful concept to consider when designing any scientific experiment, data analysis, or test, which intentionally selects the “most extreme” events – it indicates that follow-up checks may be useful in order to avoid jumping to false conclusions about these events; they may be “genuine” extreme events, a completely meaningless selection due to statistical noise, or a mix of the two cases.”””””
From: https://mathworld.wolfram.com/ReversiontotheMean.html
“””””Reversion to the mean, also called regression to the mean, is the statistical phenomenon stating that the greater the deviation of a random variate from its mean, the greater the probability that the next measured variate will deviate less far. In other words, an extreme event is likely to be followed by a less extreme event.”””””
This is exactly what is shown in the graph below. Doesn’t matter if the excursions are negative or positive.
Most of the so-called “statisticians” involved in climate science have probably never done anything more than Stat 101 in college. They can’t even distinguish between multiple measurements of the same thing and multiple single measurements of a multitude of different things let alone address what the difference in the two have on statistical analyses!
“And you assume that means there is continuous warming.”
It was Tim who insisted on talking about the number positive verses negative anomalies. I’m just saying what they indicate. It’s suggestive that there’s been a warming trend, but the better indicators are all things you reject such a linear regression or rolling average. There’s also just eyeballing.
“Regression toward the mean … ”
In the case of a trend the regression is towards the trend. You might see values below the trend line, but sooner of later they are balanced by values above it, and vice verse. This is what I’ve been trying to explain whenever you talk about the pause.
“This is exactly what is shown in the graph below.”
If you think the graph is showing reversion to a static mean you need to get your eyes tested, or actually try to understand what the phrase means.
To illustrate this, here’s the cumulative monthly mean. If there was no trend you would expect the cumulative mean to tend towards a fixed value, a horizontal line. In fact once it’s settled down we see it continue to increase. That’s because it’s regressing to the mean of the trend, not to a constant value – that is the data is not stationary.
“””””It’s suggestive that there’s been a warming trend, but the better indicators are all things you reject such a linear regression or rolling average. There’s also just eyeballing.”””””
1st, there is not enough data to make an informed decision about what the future holds.
2nd, you did not read any of the documents I showed. The reversion to the mean IS an accepted statistical property. Your response didn’t even address it let alone show how it doesn’t apply to rate of change data.
3rd, and most importantly, show a period on the UAH graph where positive or negative excursions did not return to the mean.
Unless you can show a period where temperature did not revert to the mean, then there IS NO trend of changing temperature.
1st, who said anything about the future.
2nd, I know regression to the mean is a statistical property, I’m just not sure what point you think you are making about it here. As always you just provide a link to something you never seem to understand, but have just decided can be used to ignore all the evidence that temperatures are rising. Then you expect me to guess what is in your mind.
3rd, What mean?
The mean of all monthly anomalies to date is -0.06°C. For the first 20 years it was -0.43°C, for the last 20 years it’s been +0.29°C.
Have you listened to nothing on this site? What temperatures are warming, day or night? Where are temperatures rising? Are they rising at every point on the globe equally? Are temperatures good proxy for enthalpy or weather over all points on the globe at the same time? Here is a question for you. Why don’t we trend CO2 concentration using anomalies for measuring stations across the globe?
“What temperatures are warming”
The ones you were talking about a couple of posts ago, when you got all exited about regression to the mean, remember? UAH global monthly anomalies.
“day or night”
Can’t tell from the UAH data, but based on other data sets, both.
“Where are temperatures rising?”
Why do you keep asking me to do your homework? You are just as capable of downloading all the data as I am.
The short answer is most of the globe, but at different rates, e.g. Northern Hemisphere more than Southern. Land more than ocean.
“Where are temperatures rising?”
In fact, you don’t even need to do the work. The UAH regional data helpfully works out the trend for each region.
https://www.nsstc.uah.edu/data/msu/v6.0/tlt/uahncdc_lt_6.0.txt
From that we can see all regions are rising apart from the Antarctic which is effectively flat. Whilst the Arctic ocean is the fastest warming at 0.27°C / decade.
“Have you listened to nothing on this site?”
Of course not, he is not capable of understanding. Remember this is guy who tries to tell Pat Frank and Clyde Spencer they are wrong!
Do you not understand that “trending” rates of change is a problem? They do not add directly. I’ve had a problem with people calling anomalies temperature for quite some. They are not a temperature! Anomalies have a basic dimension of ΔT/month. Averaging one anomaly with a specific baseline with a second anatomy that has an entirely different baseline is will not give a relative answer. Bias is guaranteed.
“Do you not understand that “trending” rates of change is a problem?”
I can’t help you with your problems. I’m not even sure you know what you are saying. There are lots of problems associated with any statistical analysis – do you have any specific concern, and what do you mean by trending rates of change? The trend is the rate of change.
“They do not add directly.”
No you’ve lost me again. What do not add directly? Why would you want to add trends?
“I’ve had a problem with people calling anomalies temperature for quite some.”
Again, I can’t help you with your problems. I mean I could try, but you will just throw it back in my face as usual.
“Anomalies have a basic dimension of ΔT/month.”
What are you on about now? How on earth does an anomaly involving dividing by a unit of time? Maybe you are confusing yourself by putting that Δ in front of T. Do you mean change over time or change from a base?
“Averaging one anomaly with a specific baseline with a second anatomy that has an entirely different baseline is will not give a relative answer.”
Sure it will. But if you think you are correct you need to take it up with those, like Spencer and Christie who produce these global anomalies. I’m just a consumer.
“No you’ve lost me again. What do not add directly? Why would you want to add trends?”
A rate of change is a derivative. It only tells you how fast something is changing at a specific point.
What do you think finding an average anomaly is if it isn’t adding derivatives to find their sum?
Once again your lack of understanding of physical reality is showing.
“What are you on about now? How on earth does an anomaly involving dividing by a unit of time?”
We’ve had this discussion before and, as usual, you simply just blew it off! Do a dimensional analysis. It’s very simple.
What is the monthly average? It’s temperature/time. E.g. (temp_day1 + temp_day2, + … + temp_day30) divided by 30 days.
That gives you a value of “temperature / time”.
The average baseline used to find an anomaly is also temperature/time. So you get temp/time – temp/time = temp/time.
You lack of understanding of physical reality is showing BIG time!
When one says “average temperature OVER a month”, one SHOULD wonder what the word “over” really means.
For some reason statisticians have the idea that “n” is a unitless number. When you have the misconception that statistics deals only with counting numbers it is easy to never see what the physical ramifications actually are.
Significant digits – Ha, Ha, Ha. Show a statistics class that ever mentioned physical measurement uncertainty and how it affected statistical calculations.
“What do you think finding an average anomaly is if it isn’t adding derivatives to find their sum?”
Is that what you think Jim was trying to say? It just seems such an odd thing to claim an anomaly is a rate of change. How any months is July 2023 from the base period of 1990 – 2020? Should Spencer have said the anomaly was 0.003 °C / month?
“Once again your lack of understanding of physical reality is showing. ”
Could you point me to a physics text book describing an a temperature in terms of K / s, or are you just making it up?
“What is the monthly average? It’s temperature/time.”
No, no no. I’m not surprised I blew you off if that was the nonsense you were spouting. A monthly average is either a sum of discrete measurements divided by the number of measurements. Or, as I suggested when you were insisting it was impossible to average temperature, you can think of a temperature over time, in which case the dimensions of an average are (Temperature * Time) / Time = Temperature.
“You lack of understanding of physical reality is showing BIG time!”
Presumably you apply that logic to Spencer, and everyone else who describes an Anomaly in °C, rather than °C / month. Yet you say you don’t regard Spencer as a fraud, you just think he doesn’t understand physics.
“How any months is July 2023 from the base period of 1990 – 2020? Should Spencer have said the anomaly was 0.003 °C / month?”
Unfreakingbelievable!
Jim told you: “For some reason statisticians have the idea that “n” is a unitless number.”
Did that not sink in at all?
Calm down – your answer has nothing to do with the question. You claimed that finding an average anomaly was adding derivatives.
I suspect the problem is you are mixing up derivatives and integration. What you mean to say is the monthly average is the sum of daily partitions of the month, but for some reason you think the things being added are derivatives. Hence the claim that they are Temperature / Time.
I really would like to know if I’m misunderstanding your argument, but just shouting your catchphrases isn’t going to help.
Bellman, as a statistician, has one hammer. Everything is a nail. Physical reality doesn’t exist. He lives in “statistics” world. It’s why he sees evaluating multiple measurements of the same thing and multiple measurements of different things exactly the same way!
“What would constitute proof of global warming to you?”
How about propagating the variances of all data set throughout the entire statistical analysis the data is used for. From daily midrange values to monthly averages to annual averages to long term averages.
Then we could see if the final variance supports the resolution being claimed for the statistical analyses.
How about *NOT* assuming that all measurement error is random, Gaussian, and cancels and showing how the measurement uncertainty propagates with each “average” standard error propagation protocols? Then we could see if the accumulated measurement uncertainties support the resolution being claimed for the global temperature.
“To me the “proof”, or as I would say “evidence” of global warming is the statistically significant warming trend seen in global figures”
*YOU* don’t even know enough to judge whether the use of the data is valid or not. Neither does most of the climate change cadre. The first time you assume that all measurement error is random, Gaussian, and cancels you have invalidated any subsequent analysis. So it all starts off badly and gets worse at every step! Thus there is no way to physically judge whether the analysis gives “statistically significant” results!
“you do *NOT* know enough to assert rising temps due to global warming. ”
I’m not making any assertion – but all you are saying is that rising global temperatures may not be due to global warming, but might just be the result of the globe getting warmer.
Too soon to jump to any conclusions. However, Dr. Spencer does say;
• warmest Southern Hemisphere land anomaly
• warmest July for tropical land (by a wide margin, +1.03 deg. C vs. +0.44 deg. C in 2017)
The hot NH outside the tropics doesn’t seem to have been a contributor. And remember, the SH is in winter, so the biggest factor is a ΔT of low temps in winter. Hard to make the case that warmer winters are a catastrophic climate change problem.
From the data given I would expect NH outside Tropics to be ~ 0.66°C, which would make it a record for July, though only slightly warmer than 1998 at 0.64°C.
Why not address the fact that warmer winter temperatures are not a bad thing?
How about addressing the fact that averaging winter anomalies (larger) with summer anomalies (smaller) biases the average to a higher value that overstates the “global” value?
In fact it was 0.69°C, so 0.05°C warmer than the previous record.
“I’m not making any assertion – but all you are saying is that rising global temperatures may not be due to global warming, but might just be the result of the globe getting warmer.”
Your reading comprehension skills are just atrocious. Where have I said anything like this?
I am saying that weather drives temperature, not the other way around. That means you need to identify weather patterns in order to normalize temperatures into a useful comparison. And what drives weather patterns? We know that ocean phases do. Do those ocean phases also determine the movement of the jet stream over time? What impact does the jet stream have on temperatures? We already know that the jet stream has a large impact on weather patterns, so exactly what drives the jet stream and how is that accounted for in climate models? If the jet stream impacts weather then it also impacts cloud formation. How is that accounted for in the climate models?
It simply isn’t enough to just graph temperature averages and say CO2 is driving temperature increases. That’s no different than saying rising postal rates causes rising temperatures.
The paragraph you quoted is word salad, and atrocious is the right word for his reading skills, which lead him to put words on people’s mouths. This assumes his behavior isn’t part of a bizarre troll act, which as time goes by I doubt less and less.
At any rate, he is not an honest person.
I’m guessing I will not see a single answer to my post from any of the usual suspects. Not a single one has addressed my claim that comparing July, 2022 to July, 2023 is comparing weather and not global temperature.
“It makes more sense to compare one July with another July than to compare it to a January – that’s the point.”
That’s a fallacious argument known as an error in composition. Just because one case doesn’t make sense it doesn’t mean the other case does! Comparing July, 2022 to July, 2023 *IS* just like comparing July to January.
It is WEATHER that is the major determining factor in all of the months, and weather changes from month-to-month and from year-to-year and even decade-to-decade!
“Yes. So? If we want to compare global climate we can look at longer averages.”
Did you *think* about this at all before you wrote it? How does averaging something that is wrong get better if you extend the period being averaged?
“You don’t think a warming climate will affect the weather. Or an unusually warm period tells us anything about climate?”
I never said that. Quit putting words in my mouth. I *SAID*, comparing July, 2022 temps to July, 2023 temps is comparing WEATHER, not climate. The weather patterns in each year were totally different. Was the change in pattern caused by global warming? Who the hell knows? Climate science certainly doesn’t!
And climate science as it stands today never will know! Because they are not conditioning their data to normalize weather impacts on the data!
“You look at long term trends in the weather.”
What long term trends in the weather does climate science look at? What long term weather trends are identified in the climate models? The models are almost entirely driven by trying to match CO2 growth. That’s why the small ups and downs in the model outputs, i.e. the noise, are actually little more than random noise!
California was supposed to be in a long term drought lasting for years because of climate change. Guess what? It hasn’t happened. Miami and NYC were supposed to be underwater by now because of climate change causing changing weather and sea levels. Guess what? It hasn’t happened! Hurricanes, i.e. weather, were supposed to be pounding the east coast to smithereens because of climate change by now. Guess What? IT HASN’T HAPPENED.
Exactly what long term weather trends are *YOU* seeing that confirms the global warming theory?
“Unless the weather is conspiring to just keep getting hotter and hotter with no change in the climate,”
Who says the weather is getting hotter and hotter? You are equivocating – trying to substitute “weather” for “temperature”. If the weather were getting hotter and hotter then we *would* be seeing the food shortages, flooding, species extinctions Gore warned us about 30 years ago! But we aren’t!
Temperature is just a piss poor proxy for *anything*. It’s a poor proxy for enthalpy and it is even a worse proxy for weather!
Try to find a study addressing attribution that takes into account weather for a portion of any temperature change, plus or minus. It is all human CO2.
It is one reason that knowing variance is important.
“That’s a fallacious argument known as an error in composition.”
In which Tim once again tries to avoid the argument by throwing out a claim of a random argumentative fallacy he doesn’t understand.
“Just because one case doesn’t make sense it doesn’t mean the other case does!”
That’s not what the fallacy of compensation means at all. It means taking a property of a part and assuming it must apply to the whole.
“Comparing July, 2022 to July, 2023 *IS* just like comparing July to January.”
Apart from the fact that both July’s are taking place at the same point in the seasonal cycle whereas July and January are occurring at opposite points in the cycle. Apart from the fact that both July’s have the same base temperature whereas January is colder than July. Apart from the fact that there is more variation in January anomalies compared to June anomalies.
Again, I have to ask why are you so insistent that I’m wrong to compare different July’s, yet don’t worry that this is exactly what Spenser does ion the head post. Seriously are you claiming it’s wrong to ever say one month was warmer than another? Would you make the same claim if someone pointed out a month was a record cold one?
“Did you *think* about this at all before you wrote it?”
Now tell me what type of argumentative fallacy you’ve just used.
“How does averaging something that is wrong get better if you extend the period being averaged?”
You’re the only one claiming the UAH data is wrong.
“I *SAID*, comparing July, 2022 temps to July, 2023 temps is comparing WEATHER, not climate.”
And I’ve said nothing to disagree. The point is the weather this July was much warmer than the weather last July. I along with Spencer have also pointed out it’s warmer than any other July in the satellite record.
What makes it more indicative of climate is not any one month, it’s the fact that so many recent years have been warmer than most of the years 30 years ago.
“Exactly what long term weather trends are *YOU* seeing that confirms the global warming theory? ”
Hmm, maybe the long term trend in temperature.
“Who says the weather is getting hotter and hotter?”
UAH, and every other global data set.
“If the weather were getting hotter and hotter then we *would* be seeing the food shortages, flooding, species extinctions Gore warned us about 30 years ago!”
Now there’s a fallacious argument if ever I saw one.
“In which Tim once again tries to avoid the argument by throwing out a claim of a random argumentative fallacy he doesn’t understand.”
ROFL!! You can’t even understand the definition *you* provided! You are assuming that what is true for July, 2022 is true for July, 2023 – assuming what is true for part (July, 2022) is true for the whole (July, 2022 AND July, 2023)!
You just totally miss the whole point that the weather was different in both years – as it is for *EVERY* year! What is true for one is *NOT* true for the whole but you assume that it is!
“Apart from the fact that both July’s are taking place at the same point in the seasonal cycle whereas July and January are occurring at opposite points in the cycle.”
July, 2022 is at a different point in time than July, 2023! The exact same thing as being in different seasons – i.e. different points in time!
Don’t you *ever* get tired of playing the fool?
“Again, I have to ask why are you so insistent that I’m wrong to compare different July’s,”
Because they are apples to oranges comparisons!
“yet don’t worry that this is exactly what Spenser does ion the head post.”
As usual your reading comprehension disability just comes shining through!
tpg: “And climate science as it stands today never will know! Because they are not conditioning their data to normalize weather impacts on the data!”
tpg: “What long term trends in the weather does climate science look at?
Do these statements somehow *not* apply to Spenser in your mind?
” Seriously are you claiming it’s wrong to ever say one month was warmer than another?”
No. But it is wrong to attribute the difference in temperature directly to rising CO2 without accounting for the weather patterns causing the temperatures.
This is such a simple point I can’t understand why you have such difficulty in understanding it! It’s your willful ignorance at play again I suspect!
“And I’ve said nothing to disagree. The point is the weather this July was much warmer than the weather last July. I along with Spencer have also pointed out it’s warmer than any other July in the satellite record.”
And of what use is this observation without an accompanying reason for the difference – be it implied or stated?
If all you meant was to point out the difference then why are you arguing when I criticize climate science for not considering the difference in weather patterns before attributing the rise to CO2? Your own words put the lie to your claim of being just a reporter of fact!
“it’s the fact that so many recent years have been warmer than most of the years 30 years ago.”
Your own graph of ranked anomalies puts the lie to this claim. You can’t even properly interpret what you post yourself!
“Hmm, maybe the long term trend in temperature.”
Again, you are attributing weather patterns to temperature – that temperature drives weather instead of the other way around. What proof do you have that temperature drives weather and CO2 drives temperature? And don’t quote climate model studies – they aren’t *weather*!
Concentrating on the pure value of a global anomaly is ignoring the underlying cause.
An anomaly of +4 in southern Peru and an anomaly of +1 in southern Texas average out to a large number.
Yet, is an anomaly of +4 during winter a bad thing? Better yet, what drove the anomaly, daytime or nighttime temperature.
Are you absolutely unable to analyze what variables will influence anomaly averages.
Lastly, anomalies are not temperatures. Anomalies are ΔT, a rate of change if you will. Comparing and averaging rates of change requires a firm knowledge of what causes it to change. Just another fallacy in climate science!
You aren’t really expecting an answer, are you? You have to understand the physical reality in order to determine if your statistical analysis is valid. And they don’t understand the physical reality at all. They assume all data is random, Gaussian, and all error cancels. *That* is the physical reality of the alternate universe they live in.
“You are assuming that what is true for July, 2022 is true for July, 2023 – assuming what is true for part (July, 2022) is true for the whole (July, 2022 AND July, 2023)!”
Which is not what you were originally arguing. You claimed the fallacy was me saying that if something was not true for one part it must be true for another.
And you still are not describing the fallacy of composition, let alone anything I claimed.
Really your logic is on a par with your arithmetic. It would be so much easier for you if you just engaged with the argument rather than trying to win on technicalities.
“You just totally miss the whole point that the weather was different in both years”
And there you go with the strawman arguments. When have I ever said the weather was the same? If the weather was the same the temperatures would be the same and there would be no point in comparing different months.
Do you really think like this in real life or is it just an act for my benefit? If I tell you that, here, this July was much colder than last July, do you say I can’t compare them because the weather was different? And do you then go on to say that it’s much warmer than it was in January and that’s just as good a comparison?
“July, 2022 is at a different point in time than July, 2023!”
Do you not understand the concept of seasons? Did you ever learn that the earth goes round the sun?
“Which is not what you were originally arguing. You claimed the fallacy was me saying that if something was not true for one part it must be true for another.”
Give it up! You were arguing that the weather in July, 2023 could be compared to the weather in July, 2022. That what was true for July, 2022 (i.e. the weather) was true for July, 2023.
You were wrong. You are still wrong. And you won’t admit it. You are trying to compare an apple with an orange.
“When have I ever said the weather was the same?”
You can only compare similar things. You were trying to compare temperatures in July, 2022 with temperatures in July, 2023 in order to say the difference was due to global warming. You can run but you can’t hide. The fact is that you don’t even know enough about physical science to realize that the weather patterns were different in each year – and not because of global warming!
” do you say I can’t compare them because the weather was different? “
I am saying that you can’t use the comparison to prove global warming! You can’t even get that straight. Your reading comprehension is atrocious.
The winter of 1935 here in the central US was warm and dry. 1974 winter was cold with lots of snow. 2022 winter was mild with little snow. Can you compare them to prove global warming? NO! The weather patterns were different! What you have to prove is that global warming has caused a consistent shift in weather patterns. That’s going to be *REAL* hard to do what with the above weather patterns!
“Give it up!”
Why, just when it’s getting fun. I love seeing how far you can go to avoid to avoid seeing anything that might conflict with your creed.
“You were arguing that the weather in July, 2023 could be compared to the weather in July, 2022.”
Correct, but you just blew it away using a misappropriated logical fallacy.
“That what was true for July, 2022 (i.e. the weather) was true for July, 2023.”
Nonsense. The whole point is that the weather in 2023 is different from 2022 – that’s why the temperatures are different.
“You can only compare similar things.”
What nonsense. You can compare anything to anything. I can compare the weight of an elephant to the weight of a car, or speed of a train to that of a kangaroo, if you wanted.
But int his case I am comparing similar things, namely the global temperature in one calendar month to that of the same calendar month in different years. I’m noting that it was a lot hotter, and from that concluding the weather was different.
As usual this only becomes an issue for you when you fear it might threaten your beliefs. How many times have people here, possibly even you, compared temperatures in 1930s US, with current temperatures in the US. Did you jump up and down demanding they stop comparing different things?
“You were trying to compare temperatures in July, 2022 with temperatures in July, 2023 in order to say the difference was due to global warming.”
See what I mean? I said nothing about the difference between 2023 and 2022 as being due to global warming. That would be absurd, unless you think warming is happening at the rate of 30°C / century. But the slightest possibility that the unusually warm month might be connected in any way with a decades long warming trend, is enough to mean it must be denied at all costs – even to the point of denying it’s possible to compare the two months at all.
“The winter of 1935 here in the central US was warm and dry. 1974 winter was cold with lots of snow. 2022 winter was mild with little snow. Can you compare them to prove global warming?”
Of course not, anymore than you can use the warm El Niño in 1998 to claim there had been no warming since then. You don’t look at individual months to make such a claim, you have to look at all the data.
Clown! I never “claimed” such, are you incapable of understanding anything?
And Spencer has as much said that he does not care what the numbers are.
Spencer does not publish his variances.
“Clown! I never “claimed” such, are you incapable of understanding anything?”
https://wattsupwiththat.com/2022/07/01/satellite-data-coolest-monthly-global-temperature-in-over-10-years/#comment-3545864
https://wattsupwiththat.com/2022/07/01/satellite-data-coolest-monthly-global-temperature-in-over-10-years/#comment-3547219
Go on – whine about how it’s not fair to quote your actual words – mutter mutter something about enemy lists.
bellpsychicman goes back to his enemies files, and then does a massive face-plant while doing do.
I never said those are the real numbers, instead they are estimates based on experience with real-world temperature measurements that are a lot more reasonable than the milli-Kelvin crap with which you lot fool yourselves.
Tell me again how this is “whining” — CMoB has you pegged to a tee, you are hapless.
“bellpsychicman goes back to his enemies files”
See. I was being psychic when I said “mutter mutter something about enemy lists.” Or possibly I see karlo’s game too well.
It’s his usual MO – repeatedly say something stupid, then a few months later deny he ever said it, and when you do a brief internet search and quote his exact words he’ll start whining about “enemy files” or some such nonsense. It’s as if he believes the mere fact you went to the trouble of checking what he said, invalidates the evidence.
“I never said those are the real numbers, instead they are estimates based on experience with real-world temperature measurements that are a lot more reasonable than the milli-Kelvin crap with which you lot fool yourselves.”
Agreed, you said you just pulled the numbers out of thin air, and refused to explain why you thought they were meaningful – but you said they were modest estimates and the real value could be larger.
And you will no doubt continue to spam your links ad nauseum.
Attempting to discuss real uncertainties with you trendologists is a Fool’s Errand, it is pointless.
You will never understand.
It’s called “willful ignorance”.
Acknowledging reality would pop their CAGW balloon, thus reality must be denied.
Another reason this stuff is pseudoscience.
Still can’t read, eh?
I also expect you won’t be complaining when Monckton tells you the inane anomalies have paused since October 2014.
Not only can you not read with comprehension, you still don’t understand CMoB’s method.
So you keep asserting, yet never want to explain what you think his method is, and how it differs from my interpretation.
I think his method is to find the earliest start month that will give a non-positice trend up to present. I base my interpretation on the fact that that’s exactly what he says it is. Using that method I think if he makes a post this month he will be saying the pause now starts in October 2014, and the length remains the same.
If you disagree with this interpretation you only have to say when you think the pause now starts, and we can compare the results.
You can’t even figure out what people mean from the words they type, so why bother? (And you’ve been given clues here in the past that have never penetrated the neutronium).
I’ll take that as a no, you can’t explain why you think my understanding is wrong.
Ask me if I care how you “take” it.
Irrelevant to the argument. This isn’t about your feelings, it’s about your claim to understand the Monckton Pause Method better than me.
Your lack of reading comprehension skills is not my problem, take your whines to someone who cares.
You shouldn’t. Averages are a statistical descriptor, not a measurement. As a statistical descriptor an average is only useful if accompanied by the associated variance of the data used to determine the average.
Since we do *NOT* have the accumulated variance of the data used to determine the absolute values of the averages which, in turn, are used to create the anomalies it follows that we have no idea of how to judge the uncertainty of the “global average temperature” be it an absolute value or an anomaly.
The same thing applies to *all* temperature data sets, including UAH. No self-respecting physical scientist or professional engineer would accept any statement of “global average temperature” as a useful measurement for anything.
Yes! And the point that flew right over both their heads is that his graph of “July anomalies”, with all the points connected, implies there is some physical relationship between A(July 2022) and A(July 2023).
I’ll be waiting for them to explain it.
Yup! Comparing monthly anomalies from year-to-year is not even comparing weather, let alone climate.
It’s all part of the problem of coming up with a regional “average” let alone a global average. E.g. the high temps in the south US are because of the weather patterns in existence in July, namely the stagnant high pressures. How do you account for WEATHER in such a comparison? Weather is not climate but it does have a huge impact on temperatures! If you can’t normalize weather impacts over a time series then how do you account for them? You can’t consider them as just “noise”. They may seem to be random but they aren’t, they are the result of physical processes. So you can’t just “average” them away.
The amount of unstated assumptions in the entire climate science discipline is just amazing. The climate scientists can’t even seem to recognize that there are known unknowns let alone unknown unknowns. And the statisticians they employ don’t have enough knowledge of physical science to understand that you can’t just average away uncertainty and assume physical processes are “random”. That’s how you wind up with the climate science rule of “all uncertainty is random and cancels”.
I’ve been looking at anomalies a bit trying to determine what they indicate. Supposedly they are to indicate ΔT growth from a baseline. However, anomalies are calculated for each station individually and then averaged. By only examining the means and not computing the statistical parameters of the distribution it is difficult to know the variance. All one can really assume is that 50% of the anomalies were below the mean and 50% were above the average. Even this will be incorrect if the distribution is skewed.
I ran across this study that looked at temperatures across the U.S. by county. It has the following statement.
Anomalously warm temperatures are associated with increased injury deaths | Nature Medicine
This is an indication that anomalies are not similar across regions or latitudes. Even area weighted values will have these differences result in biases. One noticeable bias is what occurs when averaging anomalies from different hemispheres. When winter has larger anomalies than summer, this will bias an average to higher values than what would be seen when averaging similar seasons. I’ve never seen this addressed either here or in climate related studies.
Just one more reason a GAT is just not a reliable indicator of global change. It has been manipulated in order to achieve the highest values possible and still has no relationship to any given region.
The UAH averages the monthly satellite data for each grid point, these become the basis for everything done after. The number of points in these averages is not constant and varies strongly with latitude. They don’t report the number of points and they throw the variances away.
And I’m reminded of peak detector circuits.
A minus one, I ruffled more fine trendology plumage with the truth.
Just over 40 years, which begins at the very point in time that temperatures were the very lowest that have existed in the past 120 years.
Those of us who were alive at the time and studying these subjects back then, recall vividly that those cold years were not welcomed as a good thing.
It is also well remembered that many of the same problems that are now being blamed on warming, were at that time blamed by some on colling, which was also blamed by those same people as being the cause of that cooling.
Here is a graph (Official unaltered US surface data as measured by thermometers, via Heller) of the number of hot days that have occurred every year in the only place in the world which has good records of a large contiguous area of actual thermometer readings over a long period of time:
Phew! 1C warmer than the early 80s. Catastrophe!
[/sarcasm]
We go through 10-20C swings every day, and 30-50C swings from the summer to winter if you’re not near the equator. Remind me again why 1C warmer is a problem on a world prone to life-killing ice ages?
The life-killing glaciation was just 6C cooler by global average. Nothing, eh?
More like 10 C, with much more outside the tropics.
Can you post a global average temperature reconstruction showing that?
In unglaciated areas, the average might have been only 6 C cooler, but over the vast ice sheets, much lower.
Sounds good. So now we’re 7C clear of calamity? Hopefully the warming continues and we can increase our safety margin against glaciation.
And, by the way – what caused those repeated 6C cooldowns?
Was it neandertal man and denisovans (and homo erectus before that) sequestering too much CO2?
Is this one of the triple peak el-nino cycles? Hmm. My guess is that the 13% increase in water vapour due to Honga-Tonga in January 2022 along with a weak/moderate el-nino would be most likely.
Here is NASA’s graphic. See if you can spot the difference the volcano made LOL
No surprise a bit of a delay in spreading across the NH.
Can we go back and see if there is correlation between marine volcanic eruptions and localized heat waves in the past such as during the 1930s in the US?
Question which everyone is still struggling with , is what exact effect this will have.
There is also the heat released by that volcano into the surrounding deep waters.
(Let’s not pretend there wasn’t any, when there was enough to vaporise millions of tons of water and send it into the stratosphere.)
Where will that appear and when, and what will it do to atmospheric temperatures.
We already know that the lagged ocean seismic activity corresponds really well to atmospheric temperatures,
…… and this was one mighty event !
More excellent evidence that no one knows how the climate works, that climate models are worse than useless (or did they predict this?) and good evidence against the anthropogenic co2 argument.
CO2 may cause warming, no one can the you how much with an degree of certainty. Most are just guesses. OH by the model output is not data, it just guesses unless the variables are well known. Even at that they are still unknow variables that may trip you up. More than one building and bridge have collapsed because of that.
Even the biggest guesser of them all, the IPCC is still guessing 1.5 to 4.5C as the possible increase for a doubling of CO2. Doubling would be around 560ppm, since the pre-industrial level was around 280ppm. There is probably not enough fossil fuels left in the ground to get CO2 levels much about 800ppm, especially giving the rate at which the planet has been greening.
The problem for those pushing for higher climate sensitivities is the fact that we have well over 100 years of CO2 increasing, and even if you assume that 100% of the warming over that period is caused by CO2, you don’t get a sensitivity much more 1C.
Given the fact that the warming started long before CO2 levels started increasing, climate sensitivity is more likely to be closer to 0.5C.
“These results suggest something peculiar is going on. It’s too early for the developing El Nino in the Pacific to have much effect on the tropospheric temperature record.”
The only peculiar thing going on again is the lack of attention given to solar supersensitivity.
Dr. Spencer spoke too soon here, as the LT lags the ocean by 2 months [1]. Two months ago the sun was emitting a long-duration TSI spike which immediately warmed the ocean. [2]
TSI has fallen off since then due to the persistence of high sunspot area in the last few weeks, having the effect of slowing down ocean heat accumulation from ASR in the central Pacific. [3]
Recent weather records are directly attributable to the highest total solar irradiance since 2002.
The sudden lower trop T rise could be caused by a reduction in the rate of water evaporation from the oceans, a cooling mechanism, and rained onto the land, known to cool land temperature observations. A related factor is cloud cover variation in this hydrologic cycle.
Rick W is the go-to on this. He compiles and interprets the global data. We should wait to see the latest few months of data before making a WAG. Geoff S
I sure am glad I am not living in the lower troposphere, or I would be a third of a degree less cold than I was last month.
Are we up to 60°F yet?
Because that is when I take off my heavy coat.
Where I live, in south-eastern England, it has been the coldest, wettest, and windiest July I can remember in my 70 years.
Prompting two thoughts:
(1) Weather is not climate. Nor is climate anything more than some (yet to be rigorously defined) average of weather.
(2) One swallow doth not a summer make. Nor does one dead swallow make a winter, nor one flood – or drought, or tornado, or hurricane, or hailstorm, or insert weather phenomenon of your choice – make a climate catastrophe.
“Where I live, in south-eastern England, it has been the coldest, wettest, and windiest July I can remember in my 70 years.”
Memory and perception of weather can be misleading. I’d say 2007 or 2012 were worse in recent memory (and the data supports my perception).
You were a bit unlucky then. In the historic CET region, July was fractionally warmer than the long-term average.
Assuming the data for the present and the past are being presented honestly.
We know they are not being.
The CET was famously altered, and the original data erased.
Why would anyone erase hundreds of years of original data?
“Someone might try to use it to say I am wrong.”
That is one mighty wacky brand of science.
“warmest absolute temperature (since July is climatologically the warmest month)”. So, why does it look like 2016 was higher? “tied with March 2016 for the 2nd warmest monthly anomaly.” March 2016 looks higher to me. What am I missing?
July is warmer than March in absolute terms.
Jan 263.18
Feb 263.27
Mar 263.43
Apr 263.84
May 264.45
Jun 265.10
Jul 265.42
Aug 265.23
Sep 264.64
Oct 263.95
Nov 263.41
Dec 263.19
And that is surprising, why exactly?
It is not surprising to me. I can’t speak for other people so if it comes as a surprise to Max More he’ll have to tell us why.
For Australia (in Mardi Gras colours) here is the Viscount Monckton type of pause from June 2012 to the end of July 2023.
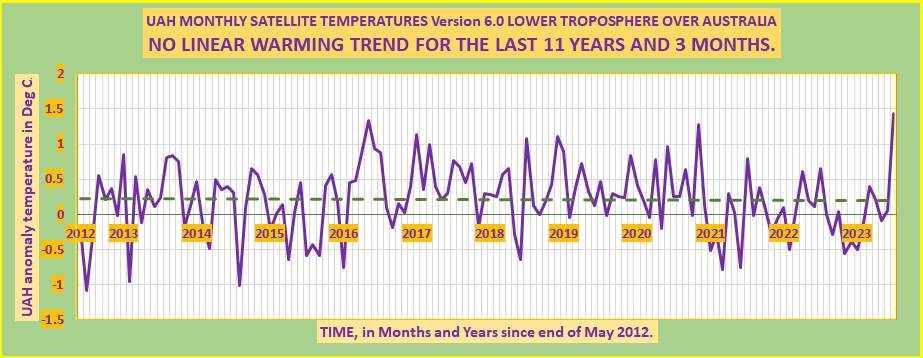
Eleven years and three months with a negative linear least squares fit, whichj is indicative rather than diagnostic.
The most recent very high value took a month off the start of the”pause”.
Experts are scrmbling to explain the sudden high.
Geoff S
It will be interesting to see Monckton’s ‘Pause’ plot this month.
Will the ”running, centered 13 month average” (red line) reach the 2020/2016 highs?
Given the time of year and given that it is still cold down here in the SH, I have doubts. What is happening to the ”extreme” heat in EU and China etc today?
Whatever it is, it will be presented honestly.
It will be interesting to see how much longer Monckton will post updates.
“It will be interesting to see Monckton’s ‘Pause’ plot this month.”
Here’s what I think it will look like.
Starts in October 2014, lasts 106 months, unchanged from last month.
And here’s the same pause in context.
Why is there such a difference between the two graphs? The first shows no warming form the start of the first big El Nino, whereas the second does show warming.
I’m not sure what you mean. The two graphs are both using the same data, it’s just that the first only shows the data from October 2014 to present, whilst the second shows it from December 1978 to present. The look different because the first is more spread out, but the actual values are identical.
Global Temp does not exist. It is an abstract notion. Each locale should be analyzed for its specific traits to see what changes have occurred there over time, and only that temperature record should be compared to itself. Maybe one area is getting warmer. But why?
Perhaps other areas are unchanged. Why? and maybe some cooling.
UHI is probably affected some of our temps.
What about the length of the records at the poles?
How much coverage do these remote sites have? How long is the record for these remote sites, and how confident are we in our data?
Averaging disparate data sources to achieve a global temp is really a waste of time and effort. Let us look at the details and focus on smaller localities to look for our answers there.
But that won’t provide the necessary answers and is therefor a nonstarter.
Science at work
HOH KNOE!!
I’M MELTING!!
Mate, if you can tell a difference of 0.3C degree, you are way more sensitive to temperature changes than anyone else on the planet. !
“I Am Gumby Dammit!” /eddiemurphy
Yup, if you can notice a 0.24C change in temperature, you should consider part-time work as a thermometer.
Since satellite records began in 1979. That’s only 44 years of historical data . The warmists are clutching at straws trying to convince us that we are doomed unless we all stop breathing.
Every month the trendologists trot out the same old tripe, over and over.
And 1979 was very well known to be about as cold as it has been in the past 120 years.
I’m curious…which dataset are you using in support of that claim?
All of them, prior to them being altered.
Here is what they look like with and without adjustments. Does 1979 look to be about as cold as it has been over the last 120 years?
Or what about this graph?
Read the title of this carefully. Global AVERAGE Temperature. How many anomalies are below the average and what is the shape of the distribution? Look at the last value where ΔT=~+1.2° C. If that is an average value of a normal distribution, then there must be locations that have an anomaly of say 2° C and some of 0.5° C. Some of 3° C and some of -0.5° C. Where are all these locations that have these varied anomalies? Do you know if the distribution of anomalies is normal or skewed? Show us some histograms!
Look at this study. Anomalously warm temperatures are associated with increased injury deaths | Nature Medicine
One of their conclusions was:
The study period was 1980 – 2017. Also note they used a median and not the mean. Why do you think that was? Were the distributions skewed too badly to use the mean as an appropriate statistical parameter? Is the U.S. an outlier or do other land areas have similar conditions? This study covered 37 years. It is interesting that Florida could expect temperatures about 1.2° C warmer than 1980 during late summer while North Dakota could expect temperatures that are 3.6° C warmer than 1980 in winter. Do you think the folks in North Dakota would be terribly upset with that temperature change?
I have posted the pertinent graph from the study that shows the anomaly distribution.
I need to add something to this.
It is interesting that Florida could expect temperatures in 2100 about 1.2° C warmer than 1980 during late summer while North Dakota could expect temperatures in 2100 that are 3.6° C warmer than 1980 in winter. Do you think the folks in North Dakota would be terribly upset with that temperature change?
So, are you now attempting to back up what TFN said about 1850 to 1930?
The first graph says the light blue line is “no adjustments”, but that is simply a lie.
It is fake.
And easy provable as such.
On the second one, what you are asking makes no sense in the context of the previous discussion.
That graph is merely ridiculous.
As I plainly stated when I referred to it:
“…infamous Warmista Hokey Schtick graph…”
Let’s have a gander at some information that is not part of a organized campaign of political propaganda, eh?
For the entirety of the satellite record, the values obtained closely track the AMO.
For the previous time period, the AMO closely matches pre global warming era temperature records.
So, here is a graph with the AMO and UAH superimposed:
I’m so glad that the Sun is perfectly stable never varying at all in intensity or in magnetic storms. Just like every other star in the universe!
The sun is more stable than some comparable stars, but less so than others. The important takeaway is that it’s a variable star.
The variability of TSI due to factors such as Earth’s elliptical orbit around the Sun and longer-term Milankovitch cycles make variations in the Sun’s luminosity appear as insignificant on less-than-million-year timescales.
And I’m so glad the Earth is also very stable, with no massive volcanoes, no changes in seismic activity…. and that the past has been perfect weather forever. 😉
In last january, the French CNRS published an interesting paper entitled “Learning the lessons of the Hunga Tonga eruption”. They estimated the amount of water vapour injected in the atmosphere at 140 millions metric tons that is expected to remain airborne for several years and, in addition to its greenhouse effect, could also alter global circulation and worsen polar ozone depletion.Learning the lessons of the Hunga Tonga eruption | CNRS News
Yes, we have a freak temperature increase following a freak volcanic event, or at least, an unusual event on the human time line, since we have never seen something like this before.
Connection?
Several things to look at. Moana Loa Keeling Curve doesn’t reflect COVID industrial turndown. We have absolutely no chance of checking the rise. At the foot of the WUWT website is Global Temperature site with real time readings from tens of thousands of worldwide thermometers. Global temp is 14.7C. Brrr. Since I’ve been watching temp has increased two hundredths of a degree Fahrenheit. Wow. See ENSO NOAA for El Niño facts. We’ve emerged from a 30 month La Niña. El Niño predictive graphs show decline towards neutral next spring mebbe neutral this time next year then La Niña again?
The July temperature anomaly record is down to the combination of two factors.
El Niño started early. It is more common for Niños to start in summer-fall. This is all an indication of an atmospheric anomaly.
After three years of La Niña, the ocean has accumulated a great amount of subsurface heat. An atmospheric anomaly is bringing it to the surface ahead of time in both basins. In the Atlantic, the northward western boundary of the gyre does not show an anomaly, indicating normal heat transfer to the atmosphere. The southward eastern boundary current is very warm, and the heat is not coming from the Arctic. It is being brought to the surface by the atmospheric anomaly. A negative NAO drove the circulation and storm track southward in June. We had double the normal amount of precipitation this June in Spain and I suppose it was dry further North.
So the heat is being recycled back into the tropics in the Atlantic and it will be interesting to see Arctic sea ice extent this September.
In July North Atlantic SST has decreased but the heat is affecting land surface and thermometers. I expect anomalies to decrease in the coming months to what could be expected from an average Niño. The situation in Antarctica requires more data.
The origin of atmospheric anomalies is hard to track. The ultimate cause might elude us.
“The ultimate cause might elude
us.Javier“Speak for yourself. The rest of your comment was just more of your speculative word salad.
“After three years of La Niña, the ocean has accumulated a great amount of subsurface heat. An atmospheric anomaly is bringing it to the surface ahead of time in both basins.”
You still don’t get that there is no passive recharge during La Niña, that the recent ocean temperature increases were strictly driven by the highest TSI since 2002.
The way I see it Javier, you are in total denial of reality and you are trying your damnedness every day to take everyone else with you, just like the IPCC does with their frozen views. Ironic.
Proof that we are past the dreaded tipping points. Now it’s full on boiling!
You may want to take a more pragmatic approach here. Keep in mind that Christy et al. 2003 say the monthly uncertainty on their measurements is ±0.20 C. That means 1 out of every 40 months a 0.6 C anomaly really could have only been 0.4 C. It’s possible that the high 0.64 C anomaly could be at least partially a fluke. Of course, the more months we string together with high anomalies the more confident we are that it is truly warmer. But even then that isn’t an indication of a tipping point. There could be other explanations like the Hunga-Tonga eruption, marine sulfur emissions reductions, an in-phase alignment of multiple oscillations, etc. Boiling? Not a chance.
You can’t get +/- 0.2C uncertainty from measurements that are +/- 0.5C or larger. Christy is doing the typical climate science handwaving of “all measurement uncertainty is random and cancels” in order to justify using the variance of the stated values as the uncertainty.
It’s a statisticians trick: stated value +/- measurement uncertainty => stated value.
The variation in stated values can’t identify the accuracy of the stated values, only the measurement uncertainty can do that. All the variation in daily values can represent in a monthly average is the variation in weather during that specific month. If you can’t somehow normalize the weather variation from day-to-day then the daily variation is meaningless. If you can’t normalize the weather variation from day-to-day then you can’t even compare a monthly average from year-to-year.
The entire temperature databases are simply not fit for purpose, from beginning to end!
You mean that nice Mr Antonio Gutteres was lying?
No. My post has nothing to do with Mr Antonio Gutteres. My points are 1) nothing is boiling 2) the large July increase could be at least partially explained by a random measurement effect and 3) their are other explanation that do not require tipping points.
With all due respect—and I honestly do carry a large amount for both Dr. Spencer and Dr. Christy—I have to question if it is proper to be distinguishing temperature anomalies based on reported precision to two decimal places (i.e., to variations of 0.01 deg-C).
My understanding—and please do correct me if I’m wrong about this—is that an end-to-end uncertainty/accuracy analysis that starts with raw data from the microwave sounding units used on satellites to derive LT temperature, and includes the many independent variables that must be considered in the path of converting such to a “global” “average” temperature of Earth’s “lower troposphere”, results in analytical uncertainties of at least ± 0.2 deg-C (a factor of 20 times higher than the asserted precision!).
Also, I further understand that the satellite MSUs used by UAH, RSS and others cannot be calibrated to accuracies better than ± 0.2 deg-C end-to-end using ground-reference sources/panels designated for such purpose. Again, please correct me if I’m wrong about this.
I greatly welcome anyone with specific knowledge of satellite-based atmospheric temperature data accuracy to comment on this, especially how measurement inaccuracies are treated for data going back as far as 1979 (43-plus years ago, yikes!).
BTW, I’ve attached a UAH-published graph of GLTT that clearly shows the month-to-month temperature anomalies, again being reported to a precision of 0.01 deg-C.
Ooops . . . here’s the UAH-published graph that I referred to:
Look carefully at this graph. The largest percentage of data points are between +/- 0.2C meaning you don’t know what those measurement data points actually are. They could actually be anywhere in that interval.
That being the case exactly what is the graph telling you? (hint: it is telling you absolutely nothing).
The biggest problem with it, is that it is only a little over 40 years and happens to have started right at the end of a 30-year sharp cooling trend.
So by itself it is highly misleading, as it lacks all-important historical context.
Really?
Both NOAA and NASA define “climate” as weather over a specified geographical area averaged over a continuous interval of 30 or more years.
IMHO, that puts the referenced graph, all by itself, in the historical context of indicating one aspect of Earth’s climate for the last 40-plus years, assuming one can overlook the claimed 0.01 C resolution of the plotted data (i.e., round it off to the nearest 0.25 C).
As for your phrase “historical context” . . . would that be inclusive of the last 200 years (since the Industrial Age began)? The last 400-1000 years (since the period of the Little Ice Age)? The last 12,000-14,000 years (since the beginning of the Holocene interglacial)? Or perhaps the last one million years (since the approximate beginning of glacial/interglacial cycles having periods of roughly 100,000 years each)?
In the context of warmista propaganda, it is even worse, because that context supplies the rationale for thinking it shows the world is heading in a bad direction and we are getting into worse and worse trouble, year over year.
And that is false.
1979 was universally recognized at the time as getting too cold. That cooling trend that then was ongoing, was projected to continue and worsen, and it was very plausible that if it got much colder the results were likely to be very bad.
The people we are debating here have stated that they are 100% sure a new multidecade cooling trend is not just unlikely, but impossible, and that warming by any amount is nothing but bad.
Each of those beliefs is either wrong or an unevidenced guess that they are nonetheless certain of.
They are like little kids who are convinced there are wolves under their beds, and that wolves eat people and that people are defenseless against wolves.
The measurement uncertainty interval is a combination of a lot of things. The conversion algorithm for changing irradiance into temperature has its own uncertainty. The atmospheric conditions at any specific sample point has its own uncertainty. Time and location of observations is not fixed meaning you are looking at a random sample which, however large the sample is it is still just a sample meaning there is an uncertainty associated with the sampling error.
I’m not even sure the +/- 0.2C interval is a measurement uncertainty. If it is the standard deviation of the sample means then it isn’t even measurement uncertainty at all!
UAH publishes anomalies to 3 decimal places.
The latest uncertainty analysis of UAH is provided by Christy et al. 2003.
You can do your own type A evaluation by comparing their measurements with RSS and STAR. When I do that I get about ±0.15 C which is close to their type B evaluation of ±0.20 C.
Hmmm . . . if true, that’ll be 20 years since updating the uncertainty analysis. Then, clearly, somebody’s not minding the store. I sure hope your statement is NOT true.
He doesn’t understand anything about measurement uncertainty.
I wish my statement were not true as well. I also wish UAH would publish their uncertainties with the anomalies similar to how others do it.
It isn’t true.
The “others” don’t understand measurement uncertainty any better than you do.
You can’t *DO* a Type A evaluation because you don’t know the specifications of all of the uncertainty components! You are making an unstated assumption that the only component in the uncertainty is the measurement device uncertainty and that you can know what that uncertainty is at any point in time.
That means that the only evaluation you can legitimately make is a Type B evaluation based on judgement.
You continue to show your lack of knowledge of physical metrology with every post you make.
A Type A evaluation requires repeated measurements of the same thing, typically a calibration standard. A Type B evaluation is based on available knowledge including judgement based on experience.
Wrong: the UAH temperature data is reported to 0.01 K, multiplied by 100 and saved in integer form.
This was not a real UA, just a comparison linear fits to delta-T numbers with radiosonde data.
More truth, more minus signs.
Trendology truly exists in an alternate universe.
Regarding the calibration of the MSU it is as follows:
“After making a measurement at each earth viewing position, a two-point calibration is performed by rotating the mirror to view cold space and then a calibration target whose unregulated temperature is monitored with multiple precision thermistors.”
Land measurement stations also use precision thermistors but the measurement stations still suffer calibration drift. If they didn’t then routine re-calibration wouldn’t be needed. So how often is their calibration target re-calibrated? And what is the drift characteristic for the target?
The calibration I referred to is made approximately every 26 seconds.
Nice comment . . . but utterly fails to address the issue of the asserted end-to-end accuracy of lower troposphere temperature as derived (calculated) by using MSU’s on orbiting spacecraft.
Numbers please.
Also, calibration using a hard ground “target” (even though it be monitored with multiple precision thermometers) is nowhere near equivalent to calibration to the gas composition of the global average lower troposphere, which is identified as the stated data end product. Any idea how that gap is bridged, analytically or empirically?
That water injected into the stratosphere was seawater. You know, salt water?
Yes, it is very interesting what happens to the temperature under the equatorial Pacific.
http://www.bom.gov.au/archive/oceanography/ocean_anals/IDYOC007/IDYOC007.202308.gif