The Setup: Bold Forecasts, But a Lackluster Outcome
Mann opens with dramatic language about “unprecedented” hurricanes and their links to warming oceans. His piece asserts that human-caused warming is driving stronger storms, citing rapid intensification in specific cases like Hurricane Milton (which reached 185 mph winds) and even speculating about the need for a hypothetical “Category 6” classification.
Indeed Milton nearly breached the threshold of 192 mph sustained winds argued by one recent study to constitute a whole new “category six” caliber of hurricanes that has emerged in an era of unprecedented ocean warmth. A separate study estimated that the deadly flooding in the southeastern U.S. from hurricane Helene was increased by 50% by human-caused warming.
However, these claims about stronger hurricanes don’t align with the latest findings from the IPCC. The 6th Assessment Report (AR6) explicitly states that evidence for long-term trends in hurricane frequency and intensity is inconclusive, with no detectable increase in global cyclone frequency and mixed regional trends. While short-term variability may yield extreme seasons, the broader picture contradicts Mann’s insistence that climate change is creating reliably stronger storms. His narrative relies on cherry-picking extreme cases rather than examining the full record.
This misalignment extends to his forecasts. Mann and his team predicted an “extremely active” hurricane season, with a most likely estimate of 33 named storms. Instead, the season produced just 18—or 19 if we generously include a borderline case. For perspective, this falls well below Mann’s projected range of 27–39 storms. Not exactly the “record-shattering” season anticipated.
The Excuses: Blame the Variables, Ignore the Model
Rather than owning the shortcomings of their forecasts, Mann and his colleagues turn to a familiar playbook: citing unpredictable variables to explain their miss. They blame the Madden-Julian Oscillation (MJO)—a well-known atmospheric cycle—for suppressing storm formation during the crucial July and August peak. Saharan dust outbreaks are also invoked as a contributing factor.
So there’s no real discrepancy when it comes to the latter half of the season. It was basically as active as predicted. The puzzle is why July and August were so quiet despite clearly favorable seasonal large-scale climate conditions. This is where one runs into complications with intraseasonal variability. Of particular relevance is the so-called Madden-Julian oscillation or simply “MJO” to its friends. The MJO is a roughly 40-50 day oscillation in the tropical atmospheric circulation which influences the location of convection, which shifts east and west over the course of a single 40-50 day cycle. When the center of convection coincides with the tropical Atlantic, conditions are more favorable for tropical cyclogenesis.
While these factors undoubtedly play a role, they are hardly “unknowns.” Both phenomena have long been recognized as influential in tropical weather. Shouldn’t a sophisticated statistical model, touted as one of the “most accurate,” account for such routine variability? Mann’s reliance on these explanations reads less as scientific insight and more as retroactive justification.
Alternative Models: When One Forecast Fails, Pivot to Another
In a curious twist, Mann highlights an alternative model that predicted 19.9 storms—a remarkably close match to the observed total. Yet he admits that this model is generally less reliable than the one that failed spectacularly. Touting the success of a secondary, less accurate framework seems like an exercise in hedging bets rather than improving the science. If your “backup” prediction worked better, why not use it as the primary model going forward? This sleight-of-hand raises more questions than it answers.
There is one other noteworthy detail here. Our group makes an alternative forecast in which tropical sea surface temperature (SST) in the main development region (MDR) is replaced with what we call “relative SST”, defined as the difference between MDR SST and the average SST throughout the entire tropics, which some researchers have argued might be a better predictor of Atlantic hurricane activity. While our previous analyses have found that this alternative model yields less skillful predictions, it is notable that this year it yielded a much more accurate prediction of 19.9 +/- 4.5 total named storms that was remarkably close to the seasonal total.
Stronger Hurricanes? Not So Fast
A particularly bold claim in Mann’s reflection is that human-caused warming is directly responsible for the rapid intensification and increased destructiveness of storms. He points to Milton and Helene as evidence, even citing studies that argue for the necessity of a new “Category 6” hurricane classification.
However, this narrative overlooks the IPCC’s cautious stance on the issue. The IPCC AR6 finds only low confidence in detectable increases in hurricane intensity globally. While there is moderate confidence in increased peak wind speeds for a subset of tropical cyclones, these trends are not consistently observed across all ocean basins. Moreover, the number of global cyclones has either decreased or remained flat. Mann’s narrative about a world of ever-stronger storms is more rhetorical than rigorously scientific.
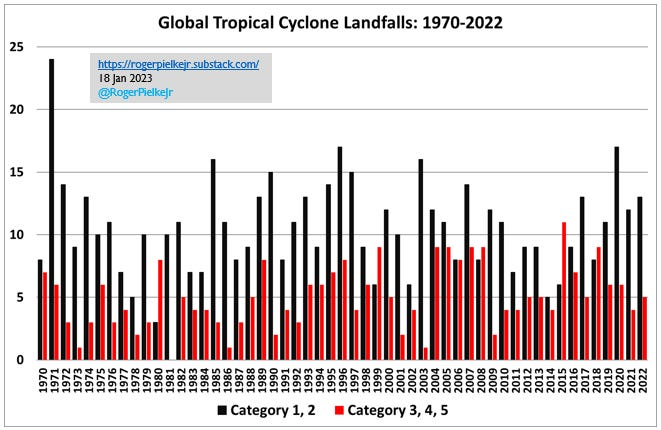
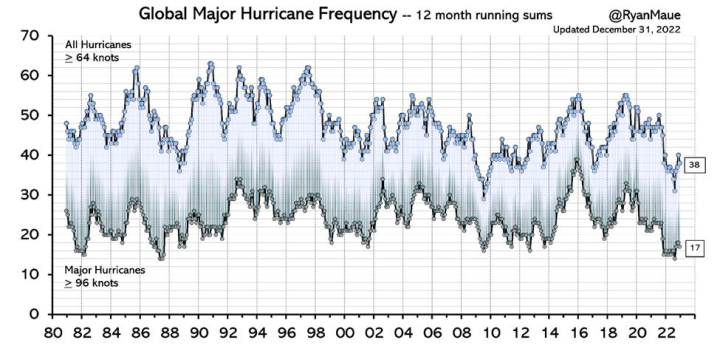
Here is the reality of Tropical Cyclone trends from Roger Pielke Jr, and Ryan Maue
“We have identified considerable interannual variability in the frequency of global hurricane landfalls; but within the resolution of the available data, our evidence does not support the presence of significant long-period global or individual basin linear trends for minor, major, or total hurricanes within the period(s) covered by the available quality data.”
Mann’s post inadvertently highlights a key issue in climate science: the gap between predictive confidence and observed outcomes. When forecasts fail, climate scientists often claim the climate system is no longer behaving predictably—implying their models are still right, just incapable of adapting to a “changing system.” This raises a critical question: If the system is behaving unpredictably, how can forecasts demand such unwavering trust, let alone justify sweeping climate policies?
Mann’s reflection ends with an ominous flourish: “There could well be far more unpleasant surprises in the greenhouse.” While such warnings are useful for grabbing headlines, they risk undermining public confidence when paired with unfulfilled predictions. If we’re not sure what to expect, how can anyone claim certainty about the impacts of climate change? This is less science and more speculative storytelling.
Final Thoughts: Missed Marks and Moving Goalposts
The 2024 Atlantic hurricane season wasn’t the catastrophe Mann’s models forecasted. While the storms that did form were destructive, the season as a whole fell far short of expectations. This raises a critical issue: When predictions fail, should we be refining models or doubling down on fear-driven narratives?
Mann’s reflections suggest the latter approach. His insistence that missed forecasts still “teach us important lessons” sidesteps the more obvious conclusion: overconfidence in flawed models does more harm than good. Rather than admitting these forecasts have limits, he suggests the rules of the climate system itself may be changing. It’s a convenient excuse but an unconvincing one.
For climate science to have any credibility, it needs to grapple honestly with its uncertainties—not reframe every miss as proof of an unknowable, ever-shifting reality. Until then, one can’t help but see this as another chapter in the growing credibility crisis of climate forecasting.
Very nice Charles. This post raises more questions for me. Number one I don’t give a damn what Mann has to say. Number two Mann is not the only one using climate models to predict the number and strength of future hurricanes. How are our guys doing with their predictions? Number three is using models the only tool we use to predict hurricanes? Number four are there outfits that have consistently done a respectable job predicting the number and strength of future hurricanes? Number five is it even possible to accurately predict the number and strength of future hurricanes?
e is it even possible to accurately predict the number and strength of future hurricanes?
What I found interesting is the claim that Saharan sand and MJO somehow messed up his predictions. IOW, his numbers would have been correct if not for at least those two phenomena.
Its a stupid argument unless Saharan sand and MJO never had an effect on hurricanes ever before. Mann’s Climate Change theory requires evidence of more and greater land striking hurricanes, more than the previous year? Is it possible that Saharan sand and MJO kept 1970s and earlier hurricane seasons less powerful and numerous? Didn’t previous years have “variables” that reduced its numbers too? Maybe that line isn’t increasing because absent those same “variables” previous years would have been just as intense.
The point being is that if these variables contributed to a smaller value today, why didn’t these variables have an effect on previous seasons? I submit they did and instead of X hurricanes of Y intensity, it was X-n named storms and Y-n reduced intensity.
Richard Greene
January 27, 2025 2:20 pm
Climate predictions and long term weather predictions are rarely right. The usual response is to forget the old predictions and make new ones.
It is very unusual to tap dance after a bad prediction, and try to list excuses. But Michael Ma is that kind of guy. The best climate scientist in the world. Just ask him.
Famous for his
Tree Ring Circus
Hockey Stink Chart.
I can’t tap dance, so I make good predictions: In 1997 I predicted the climate would get warmer unless it got cooler.
In 2020 I predicted the US would be invaded by aliens from the planet Uranus. I count that prediction as half right, as we were invaded by aliens, but they were from Latin America.
When Bill Gray and Colorado State started posting seasonal forecasts, I was pretty skeptical, both that someone in Colorado would know anything about tropical storms (except he was safe from them) and the shear chutzpah that one could make such a forecast. After a few years and they were still at it, I took a closer look and found their end-of-season reviews. Some were quite harsh on themselves, something we’ll never hear from Mann or Trump.
However, I had learned that one learns a lot more from mistakes than successes and the reviews after bad forecasts were fascinating, and led me to discover the seasonal forecasts had a lot of information about the why behind the forecasts. The 1995 review after the last AMO flip was great, I learned a lot from it.
Somehow, I just didn’t have an urge to look for a review by the Mann himself. I’m glad that Steve Milloy did, even though I haven’t learned much new!
Trump has some pretty noteworthy accomplishments to be proud of. He does sometimes apologize for his mistakes, and a search will reveal pages of him doing so.
Mann claimed to be a Nobel Prize winner for a time, until the committee told him to stop. I was unable to find any instances of him apologizing for anything.
Len Werner
January 27, 2025 2:27 pm
Earth, and its climate, were 4.54 billion years old when man evolved, and are still 4.54 billion years old when Mann devolved. Man’s and Mann’s opinions of what climate should be are irrelevant in that time scale. There is no evidence of a stable climate in the past 0,55 billion years of complex life, and zero reason for either man or Mann to assume the climate should be stable in it’s present state for any part of the future, and ample indication that it should continue warming all by itself. Mann will not understand this as long as his stature and income depend on him not understanding it.
We live on a rock that has morphed through billions of years of interaction between the life it supports and materials that collected over time to form the rock and its core.
Human ingenuity to release sequestered carbon dioxide is a gift to the lifeforms that enabled the conditions suited to humans. Humankind is giving back and the lifeforms directly dependent on CO2 are rewarding humans by flourishing like they have not done in millions of years.
The only argument I have with you post is that humans evolved to fit the conditions. We did not have to be the way we are. The conditions did not evolve to allow our existence.
Rud Istvan
January 27, 2025 2:43 pm
Nice post, CR. The only thing I find amazing about Mann is that he is still at it after having been wrong on so much for so long. Penn State and now U Penn obviously pay well for him to keep being wrong.
When the real history of the ‘climate science’ “madness of crowds” is written (NOT by Naomi Oreskes), Mann, Hansen, and Gore will be among the central bad actors. Milloy and WUWT will be among the heroes.
Nick Stokes
January 27, 2025 3:09 pm
” The 6th Assessment Report (AR6) explicitly states that evidence for long-term trends in hurricane frequency and intensity is inconclusive, with no detectable increase in global cyclone frequency and mixed regional trends.”
As I have pointed out before several times, that table 12.12 frequently seen here is not a table of frequency or trends of actual weather. It is, as plastered all over the table, a table of climate impact drivers. Impact is basically a measure of damage caused. It is made worse by worse weather, and better by mitigation – better buildings, warnings, evacuation etc. It is the latter that are hard to measure, especially globally, and that is why their models are incolclusive.
“Impact is basically a measure of damage caused. It is made worse by worse weather, and better by mitigation – better buildings, warnings, evacuation etc.”
I agree with your statement Nick, although I would call this adaptation rather than mitigation.
Wouldn’t you agree that our resources are more wisely spent on adaptation (“better buildings, warnings, etc,”) rather than expensive and fruitless efforts to invert the Keeling curve? These efforts are demostratively ineffective.
I can find no evidence that the efforts so far have made any measurable difference.
Despite lies to the contrary, wind and solar don’t reduce CO2 emissions at their current levels of penetration. They aren’t “replacing” fossil fuels, since the fossil fuel plants have to keep running in warm to hot standby.
Electric cars don’t reduce CO2 emissions since the electricity they are being charged with comes almost entirely from fossil fuel plants.
The tiny bit of reduction that has occurred, would have occurred had nobody done anything about CO2. Replacing coal with gas, occurred because fracking made gas cheaper than coal.
Replacing incandescent bulbs with LED started happening as soon as LEDs became cheaper to operate.
As much as you nitpick every little inconsequential, off-topic statement that generally has little to do with the actual post, I can’t believe that you would make such a broad, factualy unsupported declarative statement like “he climate affects the whole world.” The climate can’t affect anything because the climate isn’t real. it doesn’t exist. It’s an abstract construct of man. I’ts an average of predominant weather conditions in an area or region over time. An average cannot affect anything.
Wait a minute, human damage is only one measurement and the database for what one might call natural is sparse. I’ve studied the aftermath of a fair number of storms of all strengths up to Celia and Andrew and have examined the literature. Some effects last long enough to study which is obviously difficult. Mortality, migrations, etc. disappear. I wonder how much the increased damage is still due to stupid construction which still exists despite improvements countered by the increase in populations.
“Impact is basically a measure of damage caused. It is made worse by worse weather”.
And there will be worse weather, even if its only a result of natural variability: a100 year storm, 500 year storm, 1000 year storm. These outliers are guaranteed, AWG or not.
Our best protection is hardened infrastructure (and reliable energy, which is really just more of the same thing.)
Nick has never responded to my point that fighting climate change (mitigation) is a losing battle, providing zero quantifiable benefit, at huge quantifiable waste of resources.
“Damage is made worse by worse weather, and better by mitigationadaptation– better buildings, warnings, evacuation etc.”
He’s trying to weasel out of the fact the science doesn’t support the increasing devastating weather meme that the world has come to erroneously believe.
Nick, two observations
First, I have always had a bug out bag, annually replenished, because I live in a hurricane prone zone.
Second, I have studied the long term hurricane forecasts. They are crap. Which is also why I have an emergency bug out bag.
oh, and our bug out car since 2007 is a hybrid Ford Escape small SUV AWD getting about 450 mpg on just 10 gallons. So when we bug out, we get out.
This is what the AR6 actually has to say about CIDs
The climatic impact-driver (CID) framework adopted in
Chapter 12 allows for assessment of changing climate conditions
that are relevant for regional impacts and risk assessment. CIDs
are physical climate system conditions (e.g., means, events, extremes)
that affect an element of society or ecosystems and are thus a priority
for climate information provision. Depending on system tolerance,
CIDs and their changes can be detrimental, beneficial, neutral or
a mixture of each across interacting system elements, regions and
society sectors. Each sector is affected by multiple CIDs and each CID
affects multiple sectors. A CID can be measured by indices to represent
related tolerance thresholds. {12.1–12.3}
So you can see its not about damage caused, they’re “physical climate system conditions” and they are exactly what you think they should be…a measure of frequency and/or severity.
So for example for “Hail”, the table tells us there is no (scientific) measure of increase or decrease in “Hail” due to climate change now, expected by 2050, or even expected by 2100.
It has nothing to do with being a measure of damage caused by hail.
As I have pointed out before several times, that table 12.12 frequently seen here is not a table of frequency or trends of actual weather.
You are 100% correct.
Table 12.12 is about whether (or not) various climate signals have (or have not) “emerged”, in both the historical data and in the climate models out to 2100 under RCP 8.5 / SSP5-8.5.
.
The relevant IPCC conclusions are actually in chapter 11 of the AR6 WG-I assessment report, full title “Weather and Climate Extreme Events in a Changing Climate”.
Reminding ourselves of the claims made in the ATL article (just before the link to Table 12.12) :
The 6th Assessment Report (AR6) explicitly states that evidence for long-term trends in hurricane frequency and intensity is inconclusive, with no detectable increase in global cyclone frequency and mixed regional trends.
First, about the “evidence”, see the first paragraph of section 11.7.1.2, “Observed Trends”, on page 1585 :
Identifying past trends in TC metrics remains a challenge due to the heterogeneous character of the historical instrumental data, which are known as ‘best-track’ data (Schreck et al., 2014). There is low confidence in most reported long-term (multi-decadal to centennial) trends in TC frequency- or intensity-based metrics due to changes in the technology used to collect the best-track data. This should not be interpreted as implying that no physical (real) trends exist, but rather as indicating that either the quality or the temporal length of the data is not adequate to provide robust trend detection statements, particularly in the presence of multi-decadal variability.
Summarising that as “the ‘evidence’ is inconclusive” seems reasonable … to me, at least.
Second, focussing on frequency changes in the past for various regions, the following extracts are also from section 11.7.1.2, on pages 1585 and 1586 :
A subset of the best-track data corresponding to hurricanes that have directly impacted the USA since 1900 is considered to be reliable, and shows no trend in the frequency of USA landfall events (Knutson et al., 2019).
…
A similarly reliable subset of the data representing TC landfall frequency over Australia shows a decreasing trend in Eastern Australia since the 1800s (Callaghan and Power, 2011), as well as in other parts of Australia since 1982 (Chand et al., 2019; Knutson et al., 2019).
…
Existing TC datasets show substantial inter-decadal variations in basin-wide TC frequency and intensity in the western North Pacific, but a statistically significant north-westward shift in the western North Pacific TC tracks since the 1980s (T.-C. Lee et al., 2020). In the case of the North Indian Ocean, analyses of trends are highly dependent on the details of each analysis (e.g., pre- and/or post-monsoon season period, or Bay of Bengal and/or Arabian Sea region). The most consistent trends are an increase in the occurrence of the most intense TCs, and a decrease in the overall TC frequency, in particular in the Bay of Bengal (Sahoo and Bhaskaran, 2016; Balaji et al., 2018; Singh et al., 2019; Baburaj et al., 2020).
…
As with all confined regional analyses of TC frequency, it is generally unclear whether any identified changes are due to a basin-wide change in TC frequency, or to systematic track shifts (or both).
.
While the link to Table 12.12 is misleading, the ATL article is correct when it says “The 6th Assessment Report (AR6) explicitly states that …”.
You just need to read section 11.7.1.2, pages 1185 and 1186, to confirm that those claims are in fact correct.
Table 12.12 is about whether (or not) various climate signals have (or have not) “emerged”, in both the historical data and in the climate models out to 2100 under RCP 8.5 / SSP5-8.5.
No he’s not. Climate Impact Drivers have an actual definition in AR6 and it’s at the beginning of its chapter, chapter 12, not chapter 11.
It has nothing to do with damage and everything to do with the emergence of trends of instances and/or severities.
AR6 lists those particular items because they could be about damage to society as opposed to say listing a trend in the tropical hot spot or a trend in stratospheric cooling which won’t cause damage or be used in policy creation.
The SPM brings it all together. On observations A3.4 says:
“It is likely that the global proportion of major (Category 3–5) tropical cyclone occurrence has increased over the last four decades, and it is very likely that the latitude where tropical cyclones in the western North Pacific reach their peak intensity has shifted northward; these changes cannot be explained by internal variability alone (medium confidence). There is low confidence in long-term (multi-decadal to centennial) trends in the frequency of all-category tropical cyclones. Event attribution studies and physical understanding indicate that human-induced climate change increases heavy precipitation associated with tropical cyclones (high confidence), but data limitations inhibit clear detection of past trends on the global scale.”
For projection, B2.4 says: “It is very likely that heavy precipitation events will intensify and become more frequent in most regions with additional global warming. At the global scale, extreme daily precipitation events are projected to intensify by about 7% for each 1°C of global warming (high confidence). The proportion of intense tropical cyclones (Category 4–5) and peak wind speeds of the most intense tropical cyclones are projected to increase at the global scale with increasing global warming (high confidence).”
There’s a better than even chance major tropical cyclone occurrence increased since 1980 but we dont know what they’ll do long term. And we dont know what lesser cyclones will do long term either.
We expect more precipitation but haven’t measured it globally.
That aligns with the Table 12.12 entry for cyclones which is that the science hasn’t measured a change yet (with sufficient confidence to attribute it) and isn’t expecting to, either.
B2.4 says in summary:
We’ve measured nothing worth mentioning but we expect it to get worse.
Yep, that aligns with the precipitation entry in table 12.12 too. We haven’t measured it yet but regional attributable events happen in the models by 2050 using RCP8.5
… an alternative model that predicted 19.9 storms …
How can one have a fractional storm? That is like being slightly pregnant. Round the estimate to the nearest integer and be done with it. Maybe this explains why their numeric models perform so poorly.
Kevin Kilty
January 27, 2025 3:37 pm
The history of predictions is filled with instances where some phenomena, the randomness of which was essentially stationary, but where a longer and longer time frame presented more record-setting events interpreted as dire. Is this because a longer record explores more completely the extreme tails of a distribution, or are the essential parameters of the process drifting? It takes a very long record indeed to decide this question.
Six-sigma can only be proven with mass production.
‘He [Mann] points to Milton and Helene as evidence, even citing studies that argue for the necessity of a new “Category 6” hurricane classification.’
Pretty clear where Mann’s going with this, i.e., storm strength inflation based on the difference between measuring wind speeds on the ground historically vs. airborne instruments today. Wouldn’t it be leave less room for data tampering if we compared historical storms to current storms on the basis of on-land pressure readings?
The tropics aren’t warming much. The Arctic is warming more. Therefore if we regard the North Atlantic as a giant heat engine, transferring heat energy from the tropics (and no doubt the sea surface) to the Arctic, and doing work by creating Accumulated Cyclone Energy, the work output is Energy_in (from tropics)*Carnot efficiency (which is 1-Tc/Th), which will drop as the two heat reservoirs (tropics and Arctic) equalise in temperature, even though in a warming world there will be more heat energy in the Tropics, the amount that is turned into Northern Hemisphere ACE will drop. On the other hand the Antarctic isn’t warming much so I’d expect an increase in SH ACE as the tropics warm.
Sadly for that theory the latter is also dropping, but at least the idea that Carnot efficiency plays some part may help explain why increasing the air temperature does not necessarily equate to increasing ACE.
Many people are waiting for hurricane storm frequency to return to it’s historic levels, especially the 1940s ant 1950s.
Mann is trying to benefit by catching hurricane frequency return to mid 20th Century.
“citing rapid intensification in specific cases like Hurricane Milton (which reached 185 mph winds)”
My understanding is that wind speed measurement was made by measuring pressure and estimating wind speed, not actual wind speed measured over 1 minute.
Nor is it unusual for hurricanes to spin off tornadoes and that leaves one wondering just how do they know the pressure change they measured is from the hurricane and not a tornado spinning up?
MR166
January 27, 2025 6:10 pm
With the advent of AI being a climate scientist will be much easier. Input the results that you want and AI will construct the model that produces that output. No more tedious hours of inputting the false temperature data provided by NOAA and the MET. No more modifying code to fit the past.
Story Tip.
WHY by condo’s at inflated prices in Miami when you can start investing in beachside properties in or around Portland, Maine at a fraction of the cost, and, in a few years time ocean temperatures will be just perfect!? /s
I’m 72. In 40 years I expect to be dead. In the meantime, it’s f***ing cold. That’s why I’m not investing in beachside property in Portland, Maine. I prefer the warmth now.
Darin Knaus
January 28, 2025 7:14 am
This is a great article. Another way of framing this is that Mann’s model over-predicted the correct number by 83%. Where did the range of +-6 storms come from? Is there some statistical basis? If that’s one standard deviation from the mean he missed by 2.5 standard deviations, a pretty rare occurrence 🙂 How can you base policy on climate models that are always wrong and always miss in the same direction?
John Hultquist
January 28, 2025 9:07 am
These are my principles model predictions. If you don’t like them, I have others.
Often attributed to Groucho Marx, but a longer history about politicians.
elmerulmer
January 28, 2025 4:08 pm
If Mann’s predictions influence catastrophic and maritime insurance coverage, and they must, then insurance and re-insurance contracts are mis-priced. Far beyond the damage caused by the weather there is an efficiency cost due to reliance on bad predictions. This efficiency cost each year is dozens of billions, possibly hundreds, and is born not by Mann the predictor, but by insurance market participants. The question I have is how big is Mann’s cut?

Liars are going to lie. Michael Mann is a liar.
When all else fails, Point and Laugh.
If its dark, use a 200,000 lumen flashlight then Point and Laugh
A very public liar too.
When Mann decries the failure of his models as the fault of climate change, it says more about Michael Mann than climate.
The MJO ate my homework. – Mikey Mann
Very nice Charles. This post raises more questions for me. Number one I don’t give a damn what Mann has to say. Number two Mann is not the only one using climate models to predict the number and strength of future hurricanes. How are our guys doing with their predictions? Number three is using models the only tool we use to predict hurricanes? Number four are there outfits that have consistently done a respectable job predicting the number and strength of future hurricanes? Number five is it even possible to accurately predict the number and strength of future hurricanes?
e is it even possible to accurately predict the number and strength of future hurricanes?
What I found interesting is the claim that Saharan sand and MJO somehow messed up his predictions. IOW, his numbers would have been correct if not for at least those two phenomena.
Its a stupid argument unless Saharan sand and MJO never had an effect on hurricanes ever before.
Mann’s Climate Change theory requires evidence of more and greater land striking hurricanes, more than the previous year? Is it possible that Saharan sand and MJO kept 1970s and earlier hurricane seasons less powerful and numerous? Didn’t previous years have “variables” that reduced its numbers too? Maybe that line isn’t increasing because absent those same “variables” previous years would have been just as intense.
The point being is that if these variables contributed to a smaller value today, why didn’t these variables have an effect on previous seasons? I submit they did and instead of X hurricanes of Y intensity, it was X-n named storms and Y-n reduced intensity.
Climate predictions and long term weather predictions are rarely right. The usual response is to forget the old predictions and make new ones.
It is very unusual to tap dance after a bad prediction, and try to list excuses. But Michael Ma is that kind of guy. The best climate scientist in the world. Just ask him.
Famous for his
Tree Ring Circus
Hockey Stink Chart.
I can’t tap dance, so I make good predictions: In 1997 I predicted the climate would get warmer unless it got cooler.
In 2020 I predicted the US would be invaded by aliens from the planet Uranus. I count that prediction as half right, as we were invaded by aliens, but they were from Latin America.
In
When Bill Gray and Colorado State started posting seasonal forecasts, I was pretty skeptical, both that someone in Colorado would know anything about tropical storms (except he was safe from them) and the shear chutzpah that one could make such a forecast. After a few years and they were still at it, I took a closer look and found their end-of-season reviews. Some were quite harsh on themselves, something we’ll never hear from Mann or Trump.
However, I had learned that one learns a lot more from mistakes than successes and the reviews after bad forecasts were fascinating, and led me to discover the seasonal forecasts had a lot of information about the why behind the forecasts. The 1995 review after the last AMO flip was great, I learned a lot from it.
Somehow, I just didn’t have an urge to look for a review by the Mann himself. I’m glad that Steve Milloy did, even though I haven’t learned much new!
Trump has some pretty noteworthy accomplishments to be proud of. He does sometimes apologize for his mistakes, and a search will reveal pages of him doing so.
Mann claimed to be a Nobel Prize winner for a time, until the committee told him to stop. I was unable to find any instances of him apologizing for anything.
Earth, and its climate, were 4.54 billion years old when man evolved, and are still 4.54 billion years old when Mann devolved. Man’s and Mann’s opinions of what climate should be are irrelevant in that time scale. There is no evidence of a stable climate in the past 0,55 billion years of complex life, and zero reason for either man or Mann to assume the climate should be stable in it’s present state for any part of the future, and ample indication that it should continue warming all by itself. Mann will not understand this as long as his stature and income depend on him not understanding it.
We live on a rock that has morphed through billions of years of interaction between the life it supports and materials that collected over time to form the rock and its core.
Human ingenuity to release sequestered carbon dioxide is a gift to the lifeforms that enabled the conditions suited to humans. Humankind is giving back and the lifeforms directly dependent on CO2 are rewarding humans by flourishing like they have not done in millions of years.
The only argument I have with you post is that humans evolved to fit the conditions. We did not have to be the way we are. The conditions did not evolve to allow our existence.
Nice post, CR. The only thing I find amazing about Mann is that he is still at it after having been wrong on so much for so long. Penn State and now U Penn obviously pay well for him to keep being wrong.
When the real history of the ‘climate science’ “madness of crowds” is written (NOT by Naomi Oreskes), Mann, Hansen, and Gore will be among the central bad actors. Milloy and WUWT will be among the heroes.
” The 6th Assessment Report (AR6) explicitly states that evidence for long-term trends in hurricane frequency and intensity is inconclusive, with no detectable increase in global cyclone frequency and mixed regional trends.”
As I have pointed out before several times, that table 12.12 frequently seen here is not a table of frequency or trends of actual weather. It is, as plastered all over the table, a table of climate impact drivers. Impact is basically a measure of damage caused. It is made worse by worse weather, and better by mitigation – better buildings, warnings, evacuation etc. It is the latter that are hard to measure, especially globally, and that is why their models are incolclusive.
On forecast reviews, I haven’t seen a WUWT review of their own very similar forecast:
“Time to Pack a Bug-Out Bag, Hurricane Season from Hell Predicted“
“Impact is basically a measure of damage caused. It is made worse by worse weather, and better by mitigation – better buildings, warnings, evacuation etc.”
I agree with your statement Nick, although I would call this adaptation rather than mitigation.
Wouldn’t you agree that our resources are more wisely spent on adaptation (“better buildings, warnings, etc,”) rather than expensive and fruitless efforts to invert the Keeling curve? These efforts are demostratively ineffective.
“Wouldn’t you agree that our resources are more wisely spent on adaptation”
DEpends on whether we can stay ahead. The US and similar can spend on adaptation. But the climate affects the whole world.
Isn’t the goal to reduce atmospheric CO2?
Have our efforts thus far had any measurable effect at all?
At what point would you admit “this ain’t working?”
Asian economies have been growing fast. You have to assess against what would have happened if no effort had been made.
Coulda woulda shoulda. The warmists’ lament.
I can find no evidence that the efforts so far have made any measurable difference.
Despite lies to the contrary, wind and solar don’t reduce CO2 emissions at their current levels of penetration. They aren’t “replacing” fossil fuels, since the fossil fuel plants have to keep running in warm to hot standby.
Electric cars don’t reduce CO2 emissions since the electricity they are being charged with comes almost entirely from fossil fuel plants.
The tiny bit of reduction that has occurred, would have occurred had nobody done anything about CO2. Replacing coal with gas, occurred because fracking made gas cheaper than coal.
Replacing incandescent bulbs with LED started happening as soon as LEDs became cheaper to operate.
Nobody will ever know what would have happened if no effort had been made. Nobody will ever know what.might have been only what is.
Only charlatans make claims in public they cannot backup and Dr Curry roots them out PDQ doesn’t she Mr Stokes?
It’s impossible to asses a negative unless you have a crystal ball.
“If I had married Marilyn Monroe, we would have had platinum haired blue eyed children.”
My crystal ball says I’m right. Prove that it is wrong.
And the whole world is increasing atmospheric CO2…
Plant life says … “thank you”!
…. and climates are not changing in any significant way..
____
“Depends on whether we can stay ahead”
What does that even mean…. stay ahead of what ???
As much as you nitpick every little inconsequential, off-topic statement that generally has little to do with the actual post, I can’t believe that you would make such a broad, factualy unsupported declarative statement like “he climate affects the whole world.” The climate can’t affect anything because the climate isn’t real. it doesn’t exist. It’s an abstract construct of man. I’ts an average of predominant weather conditions in an area or region over time. An average cannot affect anything.
Wait a minute, human damage is only one measurement and the database for what one might call natural is sparse. I’ve studied the aftermath of a fair number of storms of all strengths up to Celia and Andrew and have examined the literature. Some effects last long enough to study which is obviously difficult. Mortality, migrations, etc. disappear. I wonder how much the increased damage is still due to stupid construction which still exists despite improvements countered by the increase in populations.
“Impact is basically a measure of damage caused. It is made worse by worse weather”.
And there will be worse weather, even if its only a result of natural variability: a100 year storm, 500 year storm, 1000 year storm. These outliers are guaranteed, AWG or not.
Our best protection is hardened infrastructure (and reliable energy, which is really just more of the same thing.)
And renewables weaken the infrastructure.
“better by mitigation – better buildings, warnings, evacuation etc”
Those things aren’t mitigation. They’re adaptation.
Don’t agree with him on this, he’s wrong. Climate Impact Driver has a definition in AR6 and its got nothing to do with damage.
Nick has never responded to my point that fighting climate change (mitigation) is a losing battle, providing zero quantifiable benefit, at huge quantifiable waste of resources.
“Damage is made worse by worse weather, and better by
mitigationadaptation– better buildings, warnings, evacuation etc.”He’s trying to weasel out of the fact the science doesn’t support the increasing devastating weather meme that the world has come to erroneously believe.
Joe Bastardi actually did do a review near the start of the season, and revised his numbers downwards.
Meteorologist Bastardi: The whys of the hurricane season so far – Climate Depot
Mann , of course, doubled down on his prophecy, and has never retracted or explained.
Don’t worry Nick. The new IPCC report will “give” Weather Attribution Studies more credit. No science necessary. 😉
Nick, two observations
First, I have always had a bug out bag, annually replenished, because I live in a hurricane prone zone.
Second, I have studied the long term hurricane forecasts. They are crap. Which is also why I have an emergency bug out bag.
oh, and our bug out car since 2007 is a hybrid Ford Escape small SUV AWD getting about 450 mpg on just 10 gallons. So when we bug out, we get out.
450 mpg? Just what kind of fuel are you using?
It’s a hybrid.
I think Rud means 45mpg. If it is 450 mpg I want one.
He multiplied by 10 gallons in his head but cancelled the wrong units.
Nick writes
This is what the AR6 actually has to say about CIDs
So you can see its not about damage caused, they’re “physical climate system conditions” and they are exactly what you think they should be…a measure of frequency and/or severity.
So for example for “Hail”, the table tells us there is no (scientific) measure of increase or decrease in “Hail” due to climate change now, expected by 2050, or even expected by 2100.
It has nothing to do with being a measure of damage caused by hail.
You are 100% correct.
Table 12.12 is about whether (or not) various climate signals have (or have not) “emerged”, in both the historical data and in the climate models out to 2100 under RCP 8.5 / SSP5-8.5.
.
The relevant IPCC conclusions are actually in chapter 11 of the AR6 WG-I assessment report, full title “Weather and Climate Extreme Events in a Changing Climate”.
Reminding ourselves of the claims made in the ATL article (just before the link to Table 12.12) :
First, about the “evidence”, see the first paragraph of section 11.7.1.2, “Observed Trends”, on page 1585 :
Summarising that as “the ‘evidence’ is inconclusive” seems reasonable … to me, at least.
Second, focussing on frequency changes in the past for various regions, the following extracts are also from section 11.7.1.2, on pages 1585 and 1586 :
.
While the link to Table 12.12 is misleading, the ATL article is correct when it says “The 6th Assessment Report (AR6) explicitly states that …”.
You just need to read section 11.7.1.2, pages 1185 and 1186, to confirm that those claims are in fact correct.
No he’s not. Climate Impact Drivers have an actual definition in AR6 and it’s at the beginning of its chapter, chapter 12, not chapter 11.
It has nothing to do with damage and everything to do with the emergence of trends of instances and/or severities.
AR6 lists those particular items because they could be about damage to society as opposed to say listing a trend in the tropical hot spot or a trend in stratospheric cooling which won’t cause damage or be used in policy creation.
The SPM brings it all together. On observations A3.4 says:
“It is likely that the global proportion of major (Category 3–5) tropical cyclone occurrence has increased over the last four decades, and it is very likely that the latitude where tropical cyclones in the western North Pacific reach their peak intensity has shifted northward; these changes cannot be explained by internal variability alone (medium confidence). There is low confidence in long-term (multi-decadal to centennial) trends in the frequency of all-category tropical cyclones. Event attribution studies and physical understanding indicate that human-induced climate change increases heavy precipitation associated with tropical cyclones (high confidence), but data limitations inhibit clear detection of past trends on the
global scale.”
For projection, B2.4 says:
“It is very likely that heavy precipitation events will intensify and become more frequent in most regions with additional global warming. At the global scale, extreme daily precipitation events are projected to intensify by about 7% for each 1°C of global warming (high confidence). The proportion of intense tropical cyclones (Category 4–5) and peak wind speeds of the most intense tropical cyclones are projected to increase at the global scale with increasing global warming (high confidence).”
Rather specific, and certainly not inconclusive.
A3.4 says in summary:
There’s a better than even chance major tropical cyclone occurrence increased since 1980 but we dont know what they’ll do long term. And we dont know what lesser cyclones will do long term either.
We expect more precipitation but haven’t measured it globally.
That aligns with the Table 12.12 entry for cyclones which is that the science hasn’t measured a change yet (with sufficient confidence to attribute it) and isn’t expecting to, either.
B2.4 says in summary:
We’ve measured nothing worth mentioning but we expect it to get worse.
Yep, that aligns with the precipitation entry in table 12.12 too. We haven’t measured it yet but regional attributable events happen in the models by 2050 using RCP8.5
How can one have a fractional storm? That is like being slightly pregnant. Round the estimate to the nearest integer and be done with it. Maybe this explains why their numeric models perform so poorly.
The history of predictions is filled with instances where some phenomena, the randomness of which was essentially stationary, but where a longer and longer time frame presented more record-setting events interpreted as dire. Is this because a longer record explores more completely the extreme tails of a distribution, or are the essential parameters of the process drifting? It takes a very long record indeed to decide this question.
Six-sigma can only be proven with mass production.
‘He [Mann] points to Milton and Helene as evidence, even citing studies that argue for the necessity of a new “Category 6” hurricane classification.’
Pretty clear where Mann’s going with this, i.e., storm strength inflation based on the difference between measuring wind speeds on the ground historically vs. airborne instruments today. Wouldn’t it be leave less room for data tampering if we compared historical storms to current storms on the basis of on-land pressure readings?
This has been my question. Are we measuring storms the same way we did 10, 30, 60, 90…years ago.
The tropics aren’t warming much. The Arctic is warming more. Therefore if we regard the North Atlantic as a giant heat engine, transferring heat energy from the tropics (and no doubt the sea surface) to the Arctic, and doing work by creating Accumulated Cyclone Energy, the work output is Energy_in (from tropics)*Carnot efficiency (which is 1-Tc/Th), which will drop as the two heat reservoirs (tropics and Arctic) equalise in temperature, even though in a warming world there will be more heat energy in the Tropics, the amount that is turned into Northern Hemisphere ACE will drop. On the other hand the Antarctic isn’t warming much so I’d expect an increase in SH ACE as the tropics warm.
Sadly for that theory the latter is also dropping, but at least the idea that Carnot efficiency plays some part may help explain why increasing the air temperature does not necessarily equate to increasing ACE.
https://tropical.atmos.colostate.edu/Realtime/index.php?arch&loc=southernhemisphere is a great resource for windy weather.
Many people are waiting for hurricane storm frequency to return to it’s historic levels, especially the 1940s ant 1950s.
Mann is trying to benefit by catching hurricane frequency return to mid 20th Century.
My understanding is that wind speed measurement was made by measuring pressure and estimating wind speed, not actual wind speed measured over 1 minute.
Nor is it unusual for hurricanes to spin off tornadoes and that leaves one wondering just how do they know the pressure change they measured is from the hurricane and not a tornado spinning up?
With the advent of AI being a climate scientist will be much easier. Input the results that you want and AI will construct the model that produces that output. No more tedious hours of inputting the false temperature data provided by NOAA and the MET. No more modifying code to fit the past.
“the so-called Madden-Julian oscillation or simply “MJO” to its friends.”
Is Mann implying that the MJO is controversial, possibly a conspiracy theory?
Story Tip.
WHY by condo’s at inflated prices in Miami when you can start investing in beachside properties in or around Portland, Maine at a fraction of the cost, and, in a few years time ocean temperatures will be just perfect!? /s
Ocean warming has more than QUADRUPLED over the past 40 years
Buy (not by)!
I’m 72. In 40 years I expect to be dead. In the meantime, it’s f***ing cold. That’s why I’m not investing in beachside property in Portland, Maine. I prefer the warmth now.
This is a great article. Another way of framing this is that Mann’s model over-predicted the correct number by 83%. Where did the range of +-6 storms come from? Is there some statistical basis? If that’s one standard deviation from the mean he missed by 2.5 standard deviations, a pretty rare occurrence 🙂 How can you base policy on climate models that are always wrong and always miss in the same direction?
These are my
principlesmodel predictions. If you don’t like them, I have others.Often attributed to Groucho Marx, but a longer history about politicians.
If Mann’s predictions influence catastrophic and maritime insurance coverage, and they must, then insurance and re-insurance contracts are mis-priced. Far beyond the damage caused by the weather there is an efficiency cost due to reliance on bad predictions. This efficiency cost each year is dozens of billions, possibly hundreds, and is born not by Mann the predictor, but by insurance market participants. The question I have is how big is Mann’s cut?