Press Release from The Heartland Institute

It is wrong to blame human activity and ‘climate change’ for strength of hurricane
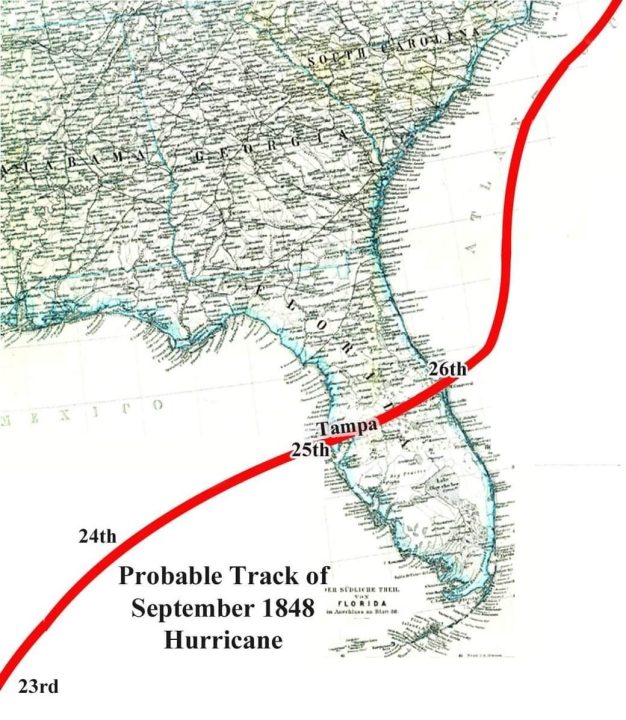
Storm of similar size and strength hit Tampa Bay area in 1848 and 1921 when human contributions to carbon dioxide in atmosphere was negligible
Even the United Nations’ Intergovernmental Panel on Climate Change (IPCC) says there’s no climate signal in tropical storms
ARLINGTON HEIGHTS, IL (October 8, 2024) – Hurricane Milton is on track Wednesday to be one of the biggest storms to ever hit the Tampa Bay, Florida area, and is one of the few Category 5 hurricanes on record in the satellite era (1966-onwards). It may join Hurricane Michael in 2018 as the only Category 5 hurricanes to form in the Gulf of Mexico in October and make landfall at that strength.
While the history of Gulf hurricanes growing this strong and making a direct hit on Tampa Bay shows this is a rare occurrence, it is not unprecedented and “climate change” driven by human emissions of carbon dioxide is not to blame.
Climate and environment experts at The Heartland Institute – James Taylor, Anthony Watts, H. Sterling Burnett, Linnea Lueken, and Steven Milloy – are available to the media to provide historical context for this storm.
They provide quotes below the following facts and perspective section of this release. To reach them for comment, please contact Vice President and Director of Communications Jim Lakely at media@heartland.org or call/text 312-731-9364.
FACT: Milton not without precedent
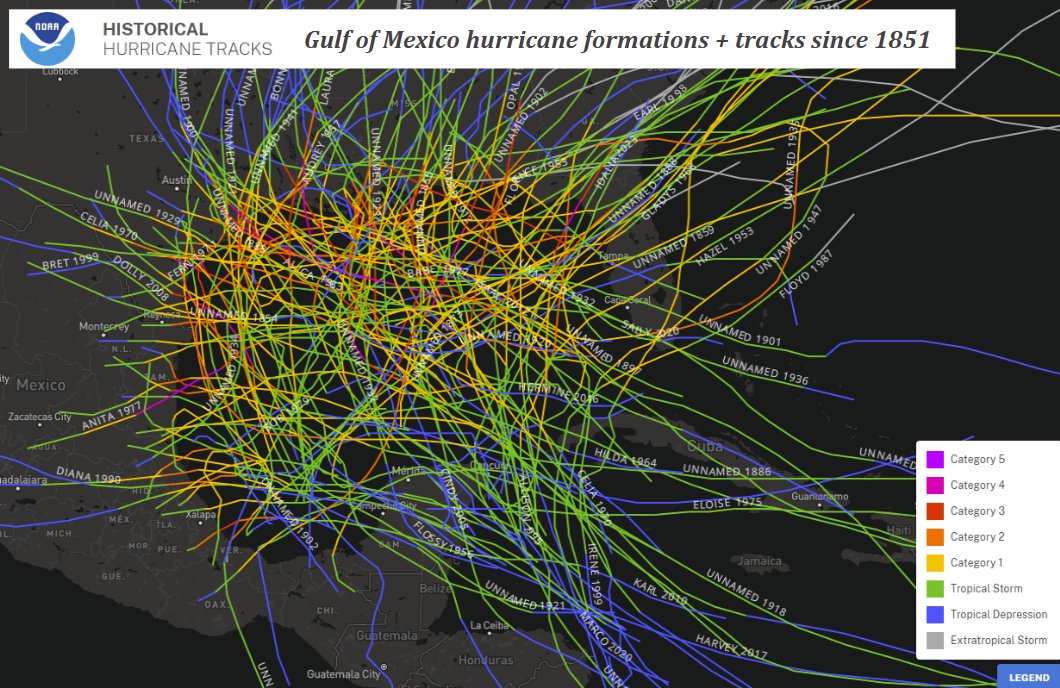
Storms of similar size and strength struck the Tampa Bay area in 1848 and 1921. And the National Oceanic and Atmospheric Administration has tracked at least 146 hurricanes that have formed in the Gulf since 1851.
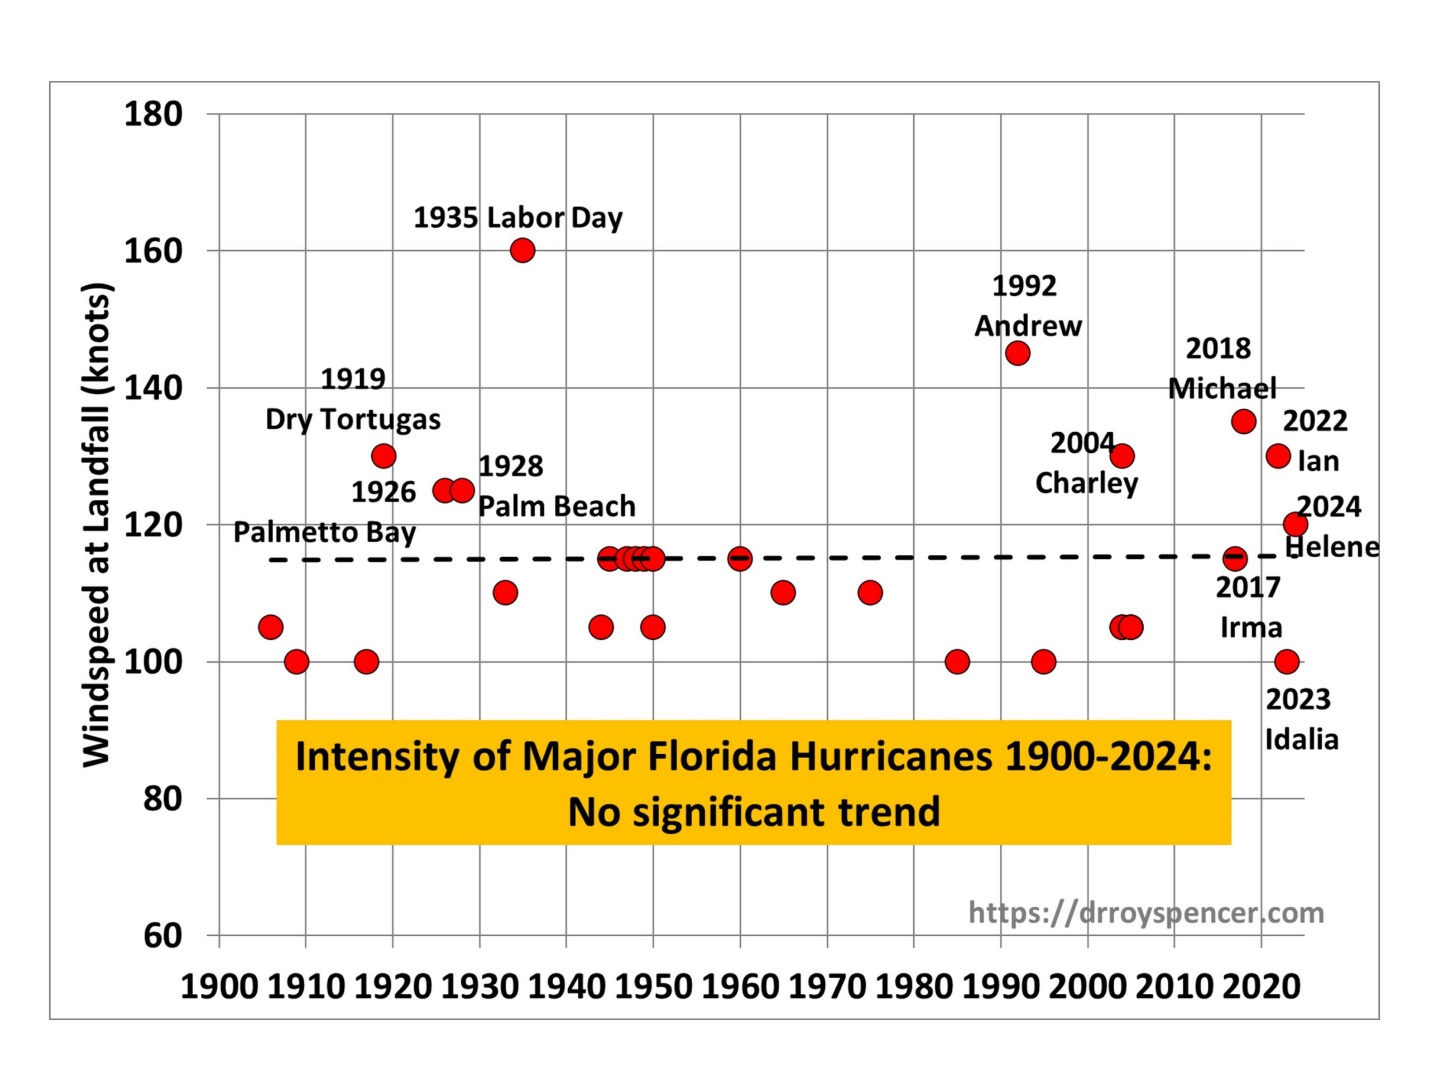
Historical data show there has been little to no long-term trend since 1900 in Florida major hurricane activity through Hurricane Helene, which hit the panhandle last month.
People born in the 1950s or later did not experience the record-high hurricane activity of the 1940s, and the early 1900s activity was likely under-reported as virtually no one lived in Florida in 1900.
The following plot shows the intensity of major hurricanes (100 knots or greater maximum sustained wind speed) striking Florida since 1900, updated through Helene:
FACT: No trend in hurricane “intensification”
Many may claim that the rapid intensification of Milton is unprecedented. That is also false. As the chart below shows – based on a study in the journal Geophysical Research Letters – there is no significant upward trend in “rapid intensification” in hurricanes that form in the North Atlantic and Gulf of Mexico in the last 33 years.

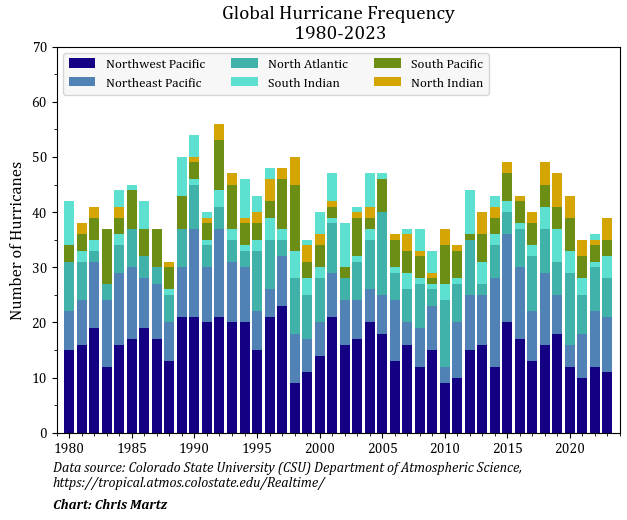
FACT: No upward trend in hurricane activity
There is also no upward trend in global cyclone activity since 1980.
FACT: IPCC says no climate signal in tropical storms
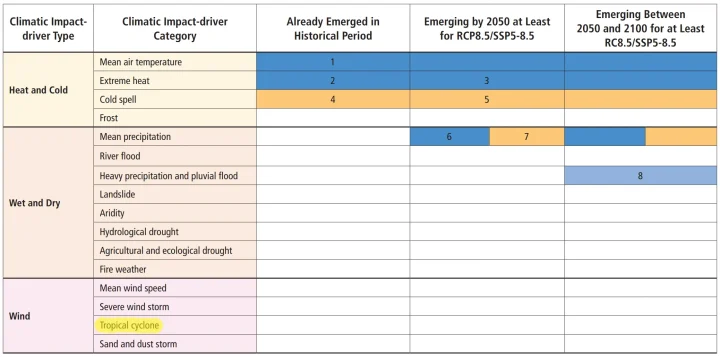
Climate science itself says there is no connection between climate change and hurricane strength or frequency. In Table 12.12 on Page 90 – Chapter 12 of the UN Intergovernmental Panel on Climate Change (IPCC) Sixth Assessment Report (2023). Emergence of Climate Impact Drivers (CIDs) in time periods, shows no indication of a connection in the present, nor in the future.
The color in the table below corresponds to the confidence of the region with the highest confidence: white colors indicate where evidence of a climate change signal is lacking or the signal is not present, leading to overall low confidence of an emerging signal. Note the colors for Tropical Cyclones in the table screencap below:
The following statements may be used with attribution. For more information about historical trends, please visit The Heartland Institute’s Climate at a Glance website.
- Florida, and especially the Tampa area, has been enjoying a golden age of hurricane avoidance.
- The Tampa area is uniquely vulnerable to hurricane strikes and a major hurricane strike will likely be catastrophic, even apocalyptic. Scientists tell us it is remarkable that no major hurricanes have struck Tampa for more than a century, and Tampa has long been overdue for another major hurricane.
- The fact that such a remarkable streak without a major hurricane strike may finally come to an end is not an indictment of climate change, but an illustration of how hurricanes are becoming rarer as the planet modestly warms.
- Climate scammers will undoubtedly attempt to link Hurricane Milton to climate change. However, hurricane activity – affecting Florida and America as a whole – is less frequent and severe than was the case decades ago. Climate change may not make all hurricanes disappear, but hurricanes are becoming less frequent and severe as the planet modestly warms.
- Meteorologists report that upper atmosphere wind shear will likely disrupt Hurricane Milton and reduce its power and speed before its Florida landfall. Scientists have long connected warmer global temperatures with stronger upper atmosphere wind shear inhibiting hurricane formation and strength. This is why warmer water temperatures have not “supercharged” hurricanes.
- Florida recently underwent an 11-year period without a major hurricane strike (ending in 2017), which is by far the longest such period in recorded history.
- Florida recently underwent a 10-year period without a single hurricane strike of any size (ending in 2016), which is by far the longest such period in recorded history.
- From 2009 through 2017, the U.S. experienced fewer hurricane strikes than during any other time period in recorded history.
- The United States recently underwent a record 11 years without a major hurricane strike of Category 3 or higher (2005-2017).
James Taylor
President
The Heartland Institute
“We, of course, don’t know at this stage how powerful Milton will be when it makes landfall or where precisely it will strike, but if it hits Tampa Bay as is forecast, it will cause massive destruction. If it does, however, neither the hurricane itself in terms of strength or speed of formation, the timing in the hurricane season, nor the location will be unprecedented as so many stories have claimed. Neither data, nor the IPCC’s most recent assessment, provide any support for the claim that climate change is causing a worsening of hurricanes.
“Rather, the damage Milton wreaks in Tampa Bay, or wherever it ultimately makes landfall, will be the only unprecedented thing about it and that is not due to changed climate conditions but rather changed demographics. There is simply more people, property, and infrastructure in and around Tampa Bay than there was when similar hurricanes made a direct strike on the city in 1921 and 1848 – 103 and 176 years of global warming ago respectively.
“In 1921, Tampa Bay’s population was 135,000. Now it sits at more than three million. Hopefully, most people will heed the early warnings afforded by available technology and get out of harm’s way so fatalities, if any, will be low. But you can’t move homes and infrastructure, so the damage will be quite high – not due to the changing nature of hurricane, but to the expanding bulls-eye effect: more people and stuff in harm’s way means more damage.
“I pray wind shear knocks it down and/or it strikes a less inhabited area of the nation.”
H. Sterling Burnett, Ph.D.
Director, Arthur B. Robinson Center on Climate & Environmental Policy
The Heartland Institute
Managing Editor, Environment & Climate News
“While many in the media have been painting Hurricane Milton as ‘unprecedented’ with it being ‘juiced’ by climate change, a review of the factual record and scientific literature say otherwise. Tampa Bay has experienced major hurricanes in 1848 and in 1921, well before climate change was ever conceived.
“Further, the Intergovernmental Panel on Climate Change (IPCC) in their most recent report showed clearly, they found no signature of climate change affecting hurricanes in any way. Milton’s 897mb lowest pressure isn’t even unprecedented, being the fifth lowest on record. While Milton remains dangerous, the attempt to paint it as a monster driven by climate change just doesn’t hold up under scrutiny and is unhelpful to those affected.”
Senior Fellow
The Heartland Institute
“Undoubtedly the focus of the media after Hurricane Milton will be on the climate change angle, despite the facts, and rapid-attribution con ‘studies’ will quickly come out to support the media narrative. It is a shame that instead of focusing on things that would actually help decrease the impact of natural hurricanes – such as storm resilient infrastructure and dispatchable power – the media will almost certainly promote fake news in order to generate even more fear and confusion.
“In the past, Florida’s government (especially recently) has been pretty good about responding to these disasters quickly and staying focused on helping people rather than wasting time playing the climate change card and shifting responsibility onto the people for daring to demand stable and affordable power. Let us hope this trend continues.”
Linnea Lueken Research Fellow
Arthur B. Robinson Center on Climate and Environmental Policy
The Heartland Institute
“The Tampa Bay area has been hit by mega-hurricanes at least twice before (1848 and 1921), there is no trend in hurricanes hitting Florida, no aspect of hurricanes is outside the range of natural variability, and it’s impossible for emissions to affect hurricanes in the first place since emissions physically can’t warm the oceans. Blaming hurricanes on emissions is an absolutely bankrupt claim.”
Steven Milloy Senior Policy Fellow, E&E Legal
Policy Advisor, The Heartland Institute
The Heartland Institute is a national nonprofit organization founded in 1984 and headquartered in Arlington Heights, Illinois. Its mission is to discover, develop, and promote free-market solutions to social and economic problems. For more information, visit our website
Give everyone at the Heartland Institute an extra ration of chocolate.
“FACT: IPCC says no climate signal in tropical storms”
No, they didn’t. Here is what that same Ch 12 of the AR6 said about N America:
Seems to be pretty much what we are seeing.
Also from AR6 Ch 11.7.1.2 “Observed Trends”:
No data given to support their speculation.
This is their summary of the section on global trends. As usual with IPCC, the section itself is full of links to data.
Data shows no trend.. so anything the IPCC puts forward is just pure propaganda… that you slurp up.
”
Tropical cyclone intensities globally are projected to increase (medium to high confidence) on average (by 1 to 10% according to model projections for a 2 degree Celsius global warming). This change would imply an even larger percentage increase in the destructive potential per storm, assuming no reduction in storm size. Rapid intensification is also projected to increase. Storm size responses to anthropogenic warming are uncertain.The global proportion of tropical cyclones that reach very intense (Category 4 and 5) levels is projected to increase (medium to high confidence) due to anthropogenic warming over the 21st century. There is less confidence in future projections of the global number of Category 4 and 5 storms, since most modeling studies project a decrease (or little change) in the global frequency of all tropical cyclones combined.https://www.gfdl.noaa.gov/global-warming-and-hurricanes/
Yes, Alarmist Climate “Science” is made up completely of speculation, assumptions and unsubstantiated assertions about CO2 and the Earth’s atmosphere and weather.
That’s all we have here. That’s all we have had for the last 50 years.
When you don’t have the facts, you resort to “confidence” levels. You try to narrow your speculations down. Even so, speculation is not established scientific fact. Pretending it is, like the IPCC does, is a Big Lie.
There are two sections there. One from Ch 12, which is actually the one Heartland was citing, and which involves projections. The other is Ch 11, on observed trends.
And what did they cite for the observed trends? Which paper has observed these trends? Or are these trends merely for the last 4 decades? 😉
Or perhaps it is Basin specific?
“Moreover, they observed an increasing TC intensity trend in the western North Pacific but a decreasing trend over the North Atlantic. The TC intensity in the North Atlantic may be linked to the decreasing trend in mid-tropospheric relative humidity, mainly south of the North Atlantic.”
https://phys.org/news/2023-05-trends-tropical-cyclones-cope-destruction.html
If the total decreases, and the number of high Cat remains the same.
Of course the proportion increases.
How much more disingenuous malinformation can you manage. !!
Likely = Pure Speculation
That is not what we are seeing. It is CliSciFi climate model projections based on the wholly unrealistic RCP8.5 scenario used only to scare the ignorant. Please note the use of the words “Projections indicate … medium confidence …” [a 50/50 chance based on the use of RCP8.5 in climate models that are proven to run hot] “… projected to shift … also holding the potential …”
If you say that this Socialist UN propaganda are reliable indications for future eventualities you are either a brainwashed CAGW ideologue or a liar.
It was WUWT/Heartland that chose to claim IPCC support
“FACT: IPCC says no climate signal in tropical storms”
I point out that it isn’t true.
That’s your opinion, which just happens to be wrong. What part of Table 12.12 on Page 90 – Chapter 12 do you NOT understand, or are you just being your usual self – obtuse for hire?
It isn’t my opinion. The IPCC was invoked, and I pointed out exactly what they said. Here it is again, from AR6 Ch 11.7.1.2 “Observed Trends”:
That isn’t the IPCC saying there is no signal in tropical storms.
So what about Table 12? The key thing is,what are they tabulating. It isn’t a meteorological variable, like number or strength of storms. It is the Climate Impact Driver. And impact takes into account the exposure of the population. From 12.1:
“Impacts of climate change are driven not only by changes in climate
conditions, but also by changes in exposure and vulnerability
(Cross-Chapter Box 1.3).”
IOW, if you get worse hurricanes the impact will be higher. But if you build better buildings, the impact will be lower. So it is a lot more complicated to calculate, and Table 12 just says that they aren’t sure which way the impact will go.
What did they have to say during the 11 year major landfall drought? A broken clock…
I would like an explanation of what “very likely, medium or high confidence” and other similar predictions actually mean in more than just conversation. Some of these are in the claimed 1/3 or 2/3 range based on variable amounts of data. I was just talking to my medically, including statistically, astute doctor about a test where I questioned the error margin. He smiled, thought a minute and said a few percent. We then had a brief discussion about statistics when he brought up the fallacy of using two p tests agreement with each other for proof. I remarked about the criticism p tests were getting, although I have used p but don’t put much confidence in it by itself. I read too many marine science papers where the model validation is either not there or difficult to understand.
High ocean heat is often claimed for hurricane strength importance but is it low, medium or high confidence among other factors? In the GOM of Mexico the Loop Current comes in warm, then with my somewhat out of date understanding about unpredictable eddies, goes out warmer or cooler with some confidence depending on other factors.
“I would like an explanation of what “very likely, medium or high confidence””
Well, what is does not mean is
“FACT: No trend in hurricane “intensification”
or
“FACT: No upward trend in hurricane activity”
or
“FACT: IPCC says no climate signal in tropical storms”
The IPCC gives the following note in the SPM:
Each finding is grounded in an evaluation of underlying evidence and agreement. A level of confidence is expressed using five qualifiers: very low, low, medium, high and very high,
and typeset in italics, for example, medium confidence. The following terms have been used to indicate the assessed likelihood of an outcome or result: virtually certain 99–100%
probability; very likely 90–100%; likely 66–100%; about as likely as not 33–66%; unlikely 0–33%; very unlikely 0–10%; and exceptionally unlikely 0–1%. Additional terms
(extremely likely 95–100%; more likely than not >50–100%; and extremely unlikely 0–5%) are also used when appropriate. Assessed likelihood is typeset in italics, for example,
very likely.
Probabilities plucked out of thin air from baseless and unvalidated models.
It is as vacuous as Kamal talk.
What is hilarious is that N. Stokes is acting like a Pitbull over what the IPCC says while he ignored all the rest of this article showing there is nothing unusual going on.
Jeez Nick, you are so brainwashed you can’t even see the data for what it is. Either that, or you are a paid shill, which I’ve always suspected.
Most importantly though, your posted opinion here is irrelevant.
I quoted, and showed, what the IPCC said. It isn’t my opinion.
Tell us in plain English
“Each finding is grounded in an evaluation of underlying evidence and agreement. A level of confidence is expressed using five qualifiers: very low, low, medium, high and very high,”
If they had the evidence, they wouldn’t need to use “CONfidence” levels.
The IPCC was tasked with finding a human cause for climate change. They can’t find it. So they resort to guessing and make it sound authoratative by calling their guesses “CONfidence levels”.
If you don’t have the facts, dazzle them with word salad.
The IPCC can’t prove a gd thing about CO2 and the Earth’s climate and weather. They have to bastardize science with their “CONfidence” levels, to keep their paychecks rolling in.
Translations: Put 100 people to review the evidence.
3% agree, very low confidence
… intermediate levels …
97% agree, very high confidence
That is the consensus at work.
You forgot to highlight “projections”. Projections are not data. 😉
Projections based on curve fitting are worthless.
One of the major pluses about the IPCC WG-I assessment reports is that once you get past the SPM they contain reasonably complete descriptions of the scientific literature, including caveats and expressions of “uncertainty”.
A major dis-advantage is that this provides opportunities for activists / extremists, on both sides of the debate, to “cherry pick” specific elements that, taken out of context, appear to support their “side”.
Let us look more closely at “section 11.7.1” — title “Tropical Cyclones” — which heads the list of “supporting citation” in your first underlined highlight.
It turns out that the relevant section is actually 11.7.1.2, “Observed Trends”. A screenshot of the start of this sub-section is attached below.
.
Paragraph 1, Global trends from before “the ‘satellite period’, which is generally limited to around the past 40 years” :
“… either the quality or the temporal length of the data is not adequate to provide robust trend detection statements …”
.
Paragraph 2 : There are “ongoing efforts” looking for “positive trends” in the most recent 40 years worth of (satellite enhanced) data.
.
Start of paragraph 3 : For the “reliable subset” limited to the USA since 1900, there is “no trend in the frequency of USA landfall events” but there is “an increasing trend in normalized USA hurricane damage, which accounts for temporal changes in exposed wealth”.
For the other “reliable subset” the IPCC highlights, however, they conclude that there is :
“… a decreasing trend in Eastern Australia since the 1800s (Callaghan and Power, 2011), as well as in other parts of Australia since 1982”
.
People can find pretty much anything that they start looking for to produce a “The IPCC says …” headline / summary within those 2 and a half paragraphs.
“One of the major pluses about the IPCC WG-I assessment reports is that once you get past the SPM they contain reasonably complete descriptions of the scientific literature, including caveats and expressions of “uncertainty”.”
Yes, they do. And the results are not always consistent, and nor are the expressions of uncertainty. But another major plus is that they provide a clear concise summary of what they think it all means. That is much harder to cherry pick. And that is what I quoted. It is at the end of the section you showed, and here it is again:
So when they say ” It is likely that the global proportion of Category 3–5 tropical cyclone instances and the frequency of rapid intensification events have increased globally over the past 40 years. “
they aren’t saying it is certain. But they certainly aren’t saying that:
“FACT: IPCC says no climate signal in tropical storms”
Medium confidence = pure speculation.
Coin flip. Heads they got it right. Tails they claim they got it right.
So, IPCC contradicts itself and provides test rather than data for politicians to chew on.
change test to text, typo alert.
Where is the contradiction?