Surface ocean temperatures are plunging rapidly around the world with scientists reported to be puzzled at the speed of the recent decline. Less puzzlement was to be found when the oceans were ‘boiling’ during the last two years. Plebs flying to Benidorm for an annual holiday and causing ‘global heating’ was a favourite explanation, although mainstream media put it in marginally more polite terms. For almost two years, this boiling ocean trope has been a reliable standby for every alarmist spiv promoting the Net Zero insanity. But expect the scare to be parked for a while along with coral reefs, polar bears and Arctic sea ice. It is a very good bet that nobody in mainstream media is going to report the oceans are cooling at what are remarkably dramatic rates. Few fear-mongering points will be on offer for drawing attention to this inconvenient news.
Until recently, the surface sea temperature (SST) graph below showing measurements up the Arctic and down to Antarctica was rarely out of the public prints.

This year the temperature shown by the black line flatlined until April compared with the substantial rise in orange for 2023. It then fell more sharply than last year and is now 0.2°C lower.
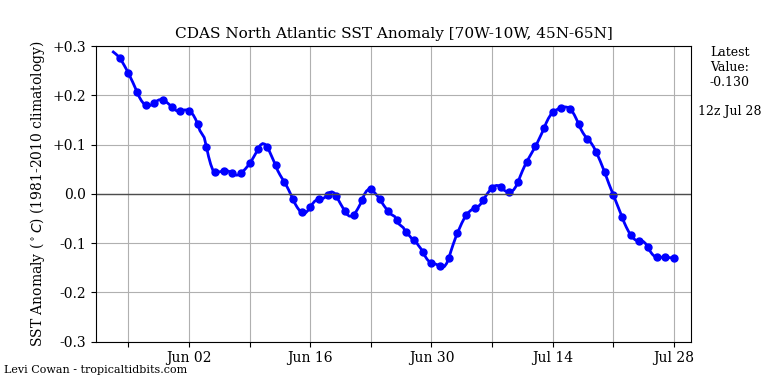
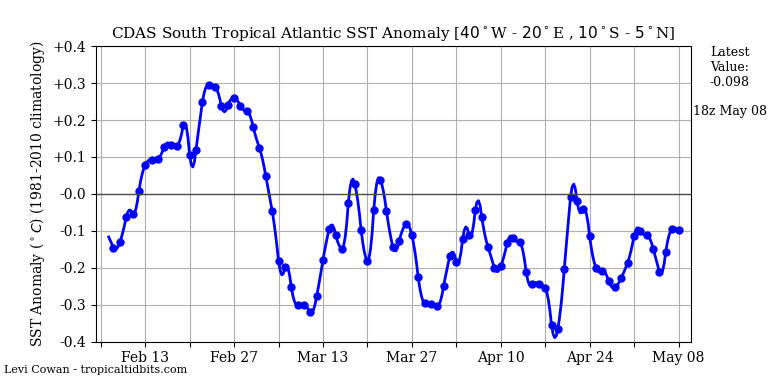
In the Atlantic, the turnaround has been even more dramatic. Temperatures have cooled quickly since May and in the central equatorial region are up to 1°C colder than average for this time of year. The American weather service NOAA notes that the high SSTs at the start of the year were the strongest warm event since 1982. The rapid transition from warm to cold SST anomalies (current temperatures compared over a longer past trend) was said to be remarkable. “Never before in the observed record has the eastern equatorial Atlantic swung so quickly from one to another extreme event,” observes NOAA.
It is not unusual for waters in these parts of the Atlantic to cool in the summer months as seasonal southern winds drag surface waters away from the equator and expose deeper colder water. The process is called ‘upwelling’, but this year it coincided with a weakening of the trade winds which should have led to warmer anomalies. “As of now, these atmospheric conditions… are quite perplexing.” NOAA says it will need to dig deeper to reveal the exact causes of this “seemingly unusual event”.
These days we must of course welcome any outbreak of scientific head-scratching in the usually ‘settled’ climate business. Temperatures suddenly go down and scientists are seemingly clueless as to why it happens. Yet temperatures go up and it is all due to global warming and humans must return, instanter, to a pre-industrial societal and economic hellhole. In fact, scientists have little idea how a great deal of weather suddenly changes and how the sea and atmosphere warms and cools. Over 100 super-computer models are simply not up to the job of explaining natural variation in a chaotic, non-linear atmosphere. The fact that some scientists are perplexed when temperatures go down, but full of fear-mongering explanations when they go up, says it all.
It is not only in the Atlantic that surface temperatures are plunging. In the Pacific, a strong El Niño natural variation that warms the ocean and affects weather across the planet has dissipated. The higher SST anomalies recorded over the last year have fallen sharply as the latest figures below from NOAA show. The blocks record the anomaly on a rolling three-month basis with the last figure of 0.2°C referring to May, June and July 2024. As the latest figures along with records that go back much further show, recent changes in SSTs due to El Niño are nothing out of the ordinary. It is shameful how the figures have been used incessantly to whip up unnecessary alarm and anxiety around the world. Everyone from UN Secretary General Antonio ‘Global Boiling’ Guterres to GB News climate comedy turn ‘Jim’ Dale should hang their heads in shame.

The recent El Niño was powerful although the natural distortion in the centigrade anomaly record was not as large as those produced by a previous El Niño around 2015-16. Over the last 25 years, all of the global temperature boosts – apart from those retrospectively added by state-funded compilers – have occurred at around the same time as El Niño formations. Strong oscillations have been recorded in 1998, 2016 and 2024. As we have seen, alarmists have taken full advantage of the changes wrought by the latest El Niño effect, particularly the warmer ocean temperatures that have arisen. As with most natural variation, that process is being reversed – what goes up, usually comes down.
According to NOAA, SSTs in three of the four locations around the Pacific used to determine the presence of an El Niño are now below the long term trend. Temperatures have also dropped considerably in many parts of the Pacific down to 300 metres as the graph below for the central and eastern area shows.

Meanwhile, spare a thought for narrative-driven messengers such as the BBC’s Georgina Rannard. Last August she claimed that while scientists have known that the sea surface would continue to warm up because of greenhouse gas emissions, “they are still investigating exactly why temperatures have surged so far above previous years”.
What a difference a few months makes in the climate alarmism business.
Chris Morrison is the Daily Sceptic’s Environment Editor.
“The fact that some scientists are perplexed when temperatures go down, but full of fear-mongering explanations when they go up, says it all”.
The inconvenient truth is that these individuals are not scientists at all.
Double, double, toil and trouble.
“”remarkably dramatic rates””
The speed or rate of change has always been their go to for claiming an anthropological influence or cause.
“”Climate change is occurring 10 to 100 times faster than in the past and ecosystems will find it hard to adjust”
https://www.scientificamerican.com/article/todays-climate-change-proves-much-faster-than-changes-in-past-65-million-years/
“”Computer simulations, known as climate models, have been used to show what would have happened to temperatures without the massive amounts of greenhouse gases released by humans. They reveal there would have been little global warming – and possibly some cooling – over the 20th and 21st Centuries, if only natural factors had been influencing the climate. Only when human factors are introduced can the models explain increases in temperature.””
https://www.bbc.co.uk/news/science-environment-58954530
They now have a tricky problem on their hands….
“”Surface ocean temperatures are plunging rapidly around the world with scientists reported to be puzzled at the speed of the recent decline.””
Now, why would they be so puzzled when the science has been settled for some time now? It is settled, is it not?
“” “As of now, these atmospheric conditions… are quite perplexing.” “”
No, it isn’t anywhere close to being settled on any level. But that doesn’t stop the anguished cries of the alarmists
“”U.N. Chief António Guterres: Fossil Fuels Are ‘Cooking Our Planet’””
https://www.breitbart.com/environment/2024/08/27/u-n-chief-antonio-guterres-fossil-fuels-are-cooking-our-planet/
Clearly, the Gutwrencher didn’t get the memo.
Science is never ‘settled’ there is always more to learn.
Activism on the other hand………..
“Sea Temperatures Plunge Around the World”
Here is the graph again. It is nothing like that:
It reached an all time record in April, for any season, then dropped about 0.2°C into May. Since then it has been steady, and now stands about 0.1°C below last year’s max level, and 0.2°C above any year before 2023, at this time.
A lot of the fall from April to May is just the regular seasonal drop in SH autumn.
“”As of now, these atmospheric conditions… are quite perplexing.” NOAA says it will need to dig deeper to reveal the exact causes of this “seemingly unusual event”.””
Have they been in touch with you, Nick?
“”A lot of the fall from April to May is just the regular seasonal drop in SH autumn.””
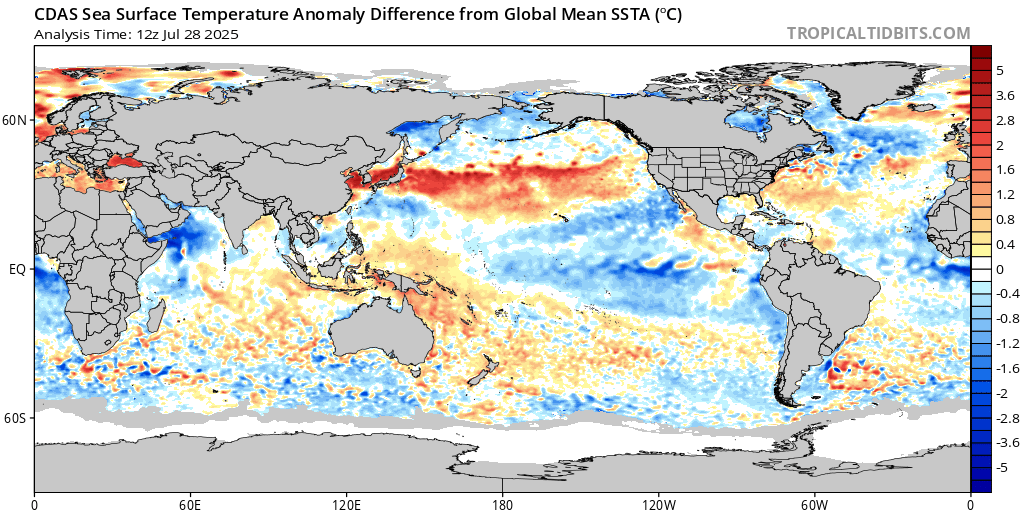
Your quote is from a NOAA discussion of a cool spot appearing in the Eastern Equatorial Atlantic. It is a curiosity, but far from global:
You didn’t answer the question. It’s a simple binary; yes or no….
No. They have not been in touch with me.
As so often with Chris Morrison, there is nothing there.
I’m intrigued.
The NOAA seem utterly clueless and you appear to have the answers; and they haven’t been in touch.
Funny old world.
I back up what I say. And I back it up with NOAA maps and data.
Showing tropical regions of both the Atlantic and Pacific cooling fast.
Reinforcing Chris’s post… well done.
Local Spot ?

Another small region. The lead claim is “Surface ocean temperatures are plunging rapidly around the world with scientists reported to be puzzled at the speed of the recent decline.”.
Even the evidence presented by Chris of the global average says that isn’t so, and of course, there is no evidence presented of puzzled scientists. Here is another global average from NOAA:
I’ve ringed the recent drop in anomaly, which is actually 0.04°C. Do you really think scientists are puzzling about that? Evidence?
Three different regions 😀
Or take that:
Of course a map is static; it can’t show a “global plunge”. But your map shows anomaly values with current warmth subtracted, so has to average to zero overall. Here is the proper anomaly map:
Note: they are still using 1981-2010.. starting at the coldest period in probably a century
As always, just not true. Here is the record of the last century with the anomaly base marked
Still looks to be 82C or so below boiling.
The fact they give ocean temperatures back to 1924 shows that chart is a complete FAKE.
There are no actual measurements to support the FAKERY much before ARGO in 2005.
Indeed. Why go to all the trouble and expense of measuring things when you can simply make stuff up?
Other than the blue ‘Musashi’ style waves in the eastern Pacific along the Equator being a little muted, I don’t see much difference. What is the point you are trying to make?
Getting it right. But what is the point he was trying to make? As I said, a static month can’t show a plunge. But it could show whether it was warmer than usual. But if you subtract out that month’s mean, as in his version, then it can’t even do that. The mean of the ressiduals, as shown, is sure to be zero.
“Getting it right.”
And failing stupidly, as usual.
Your mind is too twisted and drown in AGW BS to ever get anything “right”
I wonder if that cooler Atlantic water will put a damper on Hurricanes?
Hurricanes have been rare this season. Maybe the cooler water will continue that trend.
Just one storm now in the N. Atlantic with peak season only 10 days away.
The hurricanes are taking a long-needed rest and will wake up in time to make it to the finish line for an extraordinary season, just as the hare beat the tortoise to the finish line.
Except the hare lost the race.
He lost due to hubris.
Nick, are you disputing the NOAA comment “never before in the observed record…”? I’m doubtful you want to turn on NOAA as they tend to toe the party line.
Nick’s remarks are exactly aligned with the NOAA’s comment, which reads in full, “Never before in the observed record has the eastern equatorial Atlantic swung so quickly from one to another extreme event.” Emphasis mine.
The cold plunge is a patch of water in the Atlantic, not the global oceans.
It’s hard for me to believe that all of you aren’t being intentionally disingenuous and deceitful here, because there is simply no way every single contrarian commenter in this thread genuinely has such low reading comprehension.
“no way every single contrarian commenter“
97% would be a good approximation.
Actually, just as there is DTS, there is a NS syndrome.
I find both amusing.
It is impossible not to realise you are totally dishonest, deceitful and brain-washed in your comments .
Data clearly shows tropical regions of both the Atlantic and Pacific cooling rapidly.
Get over it.
“A lot of the fall from April to May is just the regular seasonal drop in SH autumn.”
NOAA should have just come to you for the explanation. Then NOAA wouldn’t be puzzled by this development.
Yeah, well, how much of the “fall”? How would anyone know? Three weeks worth?
How many negative atomic bombs does the global drop in ocean temperature represent? I have always like the atomic bomb energy metric. Now we can invent the negative atomic bomb energy equivalent to measure cooling.
I doubt the oceans cooled enough to cause such a big dip in temp. It has to be upwelling of colder water and subduction of the warm surface water. In short, the enthalpy of the oceans didn’t change much at all, we are just measuring different scoops of it. If we had known the temperatures below and reported the total energy in the system, there would be nothing to crow about. If the surface average drops 0.2 degrees, what does that tell us? Nothing. It is a fact, but not a useful one if the idea is to track ocean heat content. The oceans can’t cool 0.002 degrees in two months. No doubt the surface temperature magnitude of change is dominated by cloud cover changes.
We have had a large number of solar wind gusts this year, so we should expect more cloud formation and a consequential drop in the surface temperature, which is what happened.
Bigger news is the fabulously incorrect claim we would have a record hurricane season this year. The Old Farmer’s Almanac is more skilled than NOAA and only costs $10.
The Farmer’s Almanac is available on line. I recall that the Almanac has an 80% accuracy.
“Then NOAA wouldn’t be puzzled”
There is absolutely zero evidence that NOAA was puzzled.
“zero evidence that NOAA was puzzled”
Ok.. they are “perplexed”… not puzzled.
Talk about a moronic nik-pick !
They were neither puzzled nor perplexed about “sea temperatures plunging around the world”. Because they didn’t.
“…and 0.2°C above any year before 2023…”
I think you mean any year before 2023 and after, what, 1981, or 2003, or…
The point remains that the data are unsuited to making any claim about the climate or what drives it, and the “science” is as unsettled as the weather. It is all fun and games throwing up favored charts to justify disparate opinions, but the planet itself is not following the alarmist script and I suspect it has many more surprises in store.
Spot on Mark.
The shockingly bad probity and provenance of all the “data” being fed in to “global average” climate constructs render them totally unfit for scientific research purposes.
It’s like presenting a monkey’s finger painting as classic artwork.
Except for a background trend of .13 C per decade in UAH and RSS since the start of satellite readings (CO2, land use, RH, cloud cover, volcanoes, UHI effects on the temp record, all variously blamed for the .013 degrees per year)…. surface temperature excursions have generally returned to their pre-elNino temps in 18 months or so. It is likely that the 2023 temp spike is headed for a steep decline for the next dozen or so months. Not surprisingly, “Global cooling” will not be covered by the general media lest it give a platform to rationalists…or whatever they are derogatorily calling them this month…
BTW, the derogation for the other side, “alarmist spiv” used in the first paragraph is great. I’m gonna steal it…
Nick,
Very surprisingly (at least for me), this is one instance where I find myself agreeing with you.
The first graph in the above article, which you reproduced in your post, falsifies the claim in the article’s first sentence that “Surface ocean temperatures are plunging rapidly around the world with scientists reported to be puzzled at the speed of the recent decline.”
The profile of the black line at the top of the data trends, representing 2024 YTD, is very similar to most trends for years prior to 2023, represented by the lower grey lines. If any trend is somewhat anomalous in profile it is the orange curve that represents year 2023 . . . note that it starts rising for the second time in the year around the first of June, which is much earlier than the averages shown for years prior to 2023 (the dashed black lines).
Also, do I really need ask what the measurement/derivation uncertainty range is for a claimed precision of 0.1 °C “below last year’s max level”?
Bringing “Uncertainty range” into climate pontificating is like bringing a knife to a gunfight.
I get your point, which is spot on, but I think it is more like bringing a disintegrating ray gun to the gunfight . . . few people there would understand it nor its real effect.
“Also, do I really need ask”
You can ask but all you are going to get for an answer is “all measurement uncertainty is random, Gaussian, and cancels”.
There is nothing regular at all about the drop, it is crashing because of smoke particulates in the Stratosphere counter acting the remaining HT water vapor in the mid stratosphere.
You are incorrect.
Average worldwide sea surface temperatures as indicated by the first graph in the above article are NOT “crashing”.
Please cite evidence—any evidence at all—that supports your claim of “smoke particulates in the Stratosphere counter acting the remaining HT water vapor in the mid-stratosphere”.
Simple questions for you: where are the smoke particles coming from and how and when did they get transported into the stratosphere?
ROTFL.
Intense forest fires in Australia and Canada often inject large amounts of smoke particulates into the Stratosphere. The Canadian Forest fires of 2nd half of 2023 injected substantial amounts of brown carbon into the Stratosphere which stayed in the polar vortex until spring and as the cold dome was released during the early spring a substantial drop in atmospheric transmission was detected at Mauna Loa.
Transmission was just starting to recover from the intense Australian fires and the black carbon stratospheric emissions from 2018 – 2021. The freak floods in Dubai and other areas throughout the northern hemisphere in spring and early summer were a result from this.
Brown carbon is more complex because it can mix with oxygen and water vapor and create even more particulates through continuous cycles of sublimation for almost two years.
“Pyrocumulonimbus clouds (pyroCbs) generated by intense wildfires can serve as a direct pathway for the injection of aerosols and gaseous pollutants into the lower stratosphere, resulting in significant chemical, radiative, and dynamical changes. Canada experienced an extremely severe wildfire season in 2023, with a total area burned that substantially exceeded those of previous events known to have impacted the stratosphere (such as the 2020 Australian fires).”
EGUsphere – Investigating the vertical extent of the 2023 summer Canadian wildfire impacts with satellite observations (copernicus.org)
I understand your skepticism, there is not one bit out there about the effects that we are still feeling and will definitely be felt this winter. A drop in Transmission of that magnitude will have lasting effects. Changes in Stratospheric chemistry have powerful radiative effects, the Polar Vortex should be quite wobbly this winter.
I took this on the way to Mexico City in mid July, probably about 400 nautical miles south of Brownsville Texas is where they seemed to end. By August, they had made it all the way down to Cancun.
Here is the link for Mauna Loa, I tend plot the data myself, it helps when you are building climate models.
ESRL Global Monitoring Laboratory – Global Radiation and Aerosols (noaa.gov)
Your comment “Intense forest fires in Australia and Canada often inject large amounts of smoke particulates into the Stratosphere” is just wrong.
The subsequent text you provide that references pyrocumulonimbus clouds and the graph you attached refer to particulates in the troposphere, not the stratosphere. As is well documented, above the tropopause, temperature stratification in the stratosphere means that that there is little/no convective air motion above the tropopause, meaning that there is no natural “injection” of any significant quantity of smoke particles—even those originating from an asserted overabundance of forest fires—into the stratosphere . . . atmospheric diffusion being a painfully slow process.
You are quite the unknowledgeable troll, aren’t you? You could try to learn something instead of pretending to know everything. You just got your ass handed to you on a silver platter and you can’t take it.
Take your medicine boy, and the voices in the chemically altered melon you call a brain will subside.
ACP – Australian wildfire smoke in the stratosphere: the decay phase in 2020/2021 and impact on ozone depletion (copernicus.org)
Not worth a reply . . . but this will do:
From the article that you referenced:
“One should emphasize that these retrieved stratospheric lidar ratios must be regarded as rough estimates. In this combined AERONET–Polly approach, we ignore an underestimation of the stratospheric smoke AOT from AERONET sun photometer observations up to 20 %–30 %, as discussed by Ansmann et al. (2018).”
(my bold emphasis added)
Hmmm . . . how convenient for the assertions contained therein.
Of course, I’m still trying to learn regarding such things.
Actually, I have to thank you, LT3, for giving me additional incentive— above and beyond your ad hominem attack—to research this subject further and to reach the following explanation of related measurements and (likely) unintended misinformation being propagated by both NOAA and copernicus.org.
Indeed, there are several scientific papers available at various websites, not just one at copernicus.org, that refer to both convective and “self-lofting” of smoke particles to altitudes normally associated with the lower regions of the stratosphere.
The stratosphere as defined by Wikipedia (https://en.wikipedia.org/wiki/Stratosphere ):
—“The stratosphere is composed of stratified temperature zones, with the warmer layers of air located higher (closer to outer space) and the cooler layers lower (closer to the planetary surface of the Earth) . . . This vertical stratification, with warmer layers above and cooler layers below, makes the stratosphere dynamically stable: there is no regular convection and associated turbulence in this part of the atmosphere.”
(my bold emphasis added)
The stratosphere is defined by the AMS (https://glossarytest.ametsoc.net/wiki/Stratosphere ):
—“The stratosphere is characterized by constant or increasing temperatures with increasing height and marked vertical stability.”
—“While the major constituents of the stratosphere are molecular nitrogen and oxygen, just as in the troposphere, the stratosphere contains a number of minor chemical species that result from photochemical reactions in the intense ultraviolet radiation environment.“
(my bold emphasis added)
However, the tropopause as defined by Wikipedia (https://en.wikipedia.org/wiki/Tropopause ):
—“the atmospheric level where the air ceases to become cool with increased altitude and becomes dry, devoid of water vapor”
—”It is also possible to define the tropopause in terms of chemical composition. For example, the lower stratosphere has much higher ozone concentrations than the upper troposphere, but much lower water vapor concentrations, so an appropriate boundary can be defined.
—“. . . Brewer-Dobson circulation. Because gases primarily enter the stratosphere by passing through the tropopause in the tropics where the tropopause is coldest, water vapor is condensed out of the air that is entering the stratosphere. This ‘tropical tropopause layer cold trap’ theory has become widely accepted. This cold trap limits stratospheric water vapor to 3 to 4 parts per million.“
—“The tropopause is not a fixed boundary. Vigorous thunderstorms, for example, particularly those of tropical origin, will overshoot into the lower stratosphere and undergo a brief (hour-order or less) low-frequency vertical oscillation.”
(my bold emphasis added)
The tropopause as defined be the AMS (https://glossarytest.ametsoc.net/wiki/Tropopause ):
—“The boundary between the troposphere and stratosphere, usually characterized by an abrupt change of lapse rate . . .The change is in the direction of increased atmospheric stability from regions below to regions above the tropopause.”
(my bold emphasis added)
So, in reality, to remain consistent with the above terminology, what the above-referenced scientific papers on forest-fire-originated soot being uplifted “into the stratosphere” describe is more properly characterized as the tropopause being temporarily expanded in vertical extent as a result of forest fire convection currents originating in the underlying troposphere (including pyrocumulonimbus clouds).
Heck, even data presented in the copernicus.org paper that you referenced shows that smoke perturbations “into the stratosphere” did not extend much above 25 km altitude whereas the stratosphere is commonly defined to extend to 50 km altitude . . . why is that?
In particular reference to, and documentation of, this last observation and question, see the paper’s Figure 10(a), Table 3, Figure 12 and Figure 13.
All this from the “boy” that is still learning . . . and without benefit of chemical additives. 😉
How about you?
Science 101 … If the observations do not match your hypothesis – your so called “scientific hypothesis’ … your hypothesis is wrong!
So what is the hypothesis and what are the contrary observations?
Here was I under the impression that those making the claims of climate meltdown had to come up with hypotheses to explain their claims.
You haven’t answered that simple question.
That question is for you climate fretters to address Nick.
Whacha got ??
Google it.
Problem is: there are observations, and then there are (other) observations.
The author of the above article, Chris Morrison, has apparently “observed” that the trend line is anomalous (aka “surprising”) for 2024 daily sea-surface temperature, based on his review of the first graph (from NOAA) that he presents. However, he fails to observe that the 2024 data profile is quite similar to many sea-surface temperature trends seen prior to 2023.
Other people, myself included, have “observed” that the really anomalous profile present in that same graph is the one for 2023 (the orange trend line), not the one for 2024 YTD.
So, yes, one must objectively conclude that Chris Morrison’s conclusion (hypothesis) is just plain wrong.
Unless my eyes deceive me, that chart shows recent sea surface temperatures to be the second-highest on record for the time of year. By a country mile.
Some ‘plunge’!
I don’t see why there should be any surprise at all.
As we can tell from speed and duration of the atmospheric response to the 2023 El Nino, one heck of a lot of energy was released from the oceans.
SST’s had to start dropping sooner or later.
Already significant around the ENSO region, (about -2.5C since December.. see last graph)…
…. cooling will gradually spread out and probably settle to a near zero trend for a while, just a bit above the pre-El Nino level.
Hadn’t notice before, but how often to both the Pacific and Atlantic have strong +ve Nina regions at the same time, like seems to have happened last year.
Atlantic was near neutral in 2016, iirc.
Will search for data in the morning if someone doesn’t get there first.
This is the best I can manage this early, found two graphs and tried to align the dates.
Seems this is the only time strong +ves have aligned in the Atlantic and Pacific.
I wonder how this has affected the 2023 El Nino.
Global boiling leading to record hurricanes might be a slight exaggeration.
Yes, and when Climate Alarmists, like the UN Secretary General, talk about the oceans boiling, they are implying that the entire global ocean is boiling and above average in temperature and it’s all because of CO2.
But that’s not true. Just as here, some parts of the ocean are warm and some parts of the ocean are cool, and our scientific “betters” don’t understand how it all works.
The Science is not settled.
Have others than António Manuel de Oliveira Guterres, Al Gore, and James Hansen made the “boiling oceans” comment? Hansen’s comment was years ago. The recent fuss may have come from that small lagoon (Florida ?) report last year or so.
Anyway, Guterres seems more interested in being an important World (Dear) Leader than understanding anything about weather and climate.
Found it:
How To Push a Climate Crisis Hoax: Florida’s Record Ocean Temperature – Watts Up With That?
I was in Florida a couple of weeks ago and it was really quite pleasant when swimming. Downing waterfront shrimp and cold beer was quite nice also.
https://www.tripadvisor.com/Restaurant_Review-g34300-d1765279-Reviews-The_Freezer-Homosassa_Florida.html
You went to Florida? OMG, weren’t you afraid of being drowned by the impending surge of hurricanes lining up out in the Atlantic, like airplanes queuing up to take off? /s
Which raises an interesting point. Hurricanes don’t spawn in the Gulf or on the shore in Florida. They start as ‘disturbances’ in the Atlantic closer to the Equator and work their way north. With the normal season peak only a couple weeks away, shouldn’t we be seeing a flotilla of disturbances unfurling their sails to make the hurricane forecasts come true?
It has been claimed that Saharan dust has damped hurricane hurricane spawning. Now we learn about a pool of cold water in the Atlantic on the Equator, which isn’t going to support the strengthening of disturbances. Just how are these forecasts arrived at? Wishful thinking?
Some do actually form off the SE coast mostly along old stalled cold fronts offshore from Cape Hatteras to Jax along the Gulf Stream and in the GOM. These typically aren’t the Cat4/5 variety, but they can cause a lot of havoc and heavy rain. Additionally mostly in late Sept to early November N’Easters can cause more damage than a hurricane.
Source: I’ve been involved in quite a few.
Not sure why the euphoria here on surface sea temperature trends. Looking at the chart, and checking the website’s interactive chart, sea surface temperature has been increasing “steadily” since 1982. In March 2023, it climbed in an anomalous jump to the highest levels since 1982 and well above 2020-2022. And has stayed very elevated, even with recent temperature “drop”.
Maybe we should see where things sit in December.
If by then the temps drop close to the range of a few years ago, it’ll be interesting to speculate on the cause of the recent “blip”.
If this “puzzling” cooling were to continue, I’m fully confident that World top climate scientists will double down blaming human activity, be it Sam’s livestock farts and burps, mom bringing the children to school with her pickup or uncle Joe’s barbecue, discarding from the outset (climate science is settled isn’t ?) any natural phenomenon as volcanoes, (multi) decadal oceanic cycles, Milankovicth cycles, galactic rays, Sun activity, cloudiness, all this meaningless stuff being pure climate deniers’ fantasy.
The subtext of the comments here is that ocean warming is caused by the increased radiative forcing of rising CO₂.
There’s no no evidence for that case, and no physical theory of the climate making that the case.
What does a “physical theory of the climate” look like, in your perspective?
It would look like a complete physical theory of the climate.
What would it look like to you.
I use ‘would” rather than “does” because there is as yet no such theory.
That’s a vague answer, isn’t it? What is a “complete” theory in science? What is missing in our current understanding that prevents us from having a theory of climate?
A model that is based on theories that don’t require parameterization in the model in order to even get close to matching reality.
A set of theories that don’t require ignoring a complete set of full statistical descriptors for the measurement data used to validate the theories. This would include abandoning the the idiotic meme that all measurement uncertainty is random, Gaussian, and cancels.
Pat has done as much as anyone to provide a plausible alternative working hypothesis and call into doubt the reliability of the existing paradigm. Part of the problem is that the promoters of the existing paradigm avoid the hard questions of how to deal with data that goes against the computer predictions. One needs to consider all the data, not just that which supports the paradigm.
Thanks, Clyde but so far it’s all just been physical error analysis, for me.
One would not have thought that basic field calibration and instrumental resolution would be so controversial, or so hard to accept, but it seems that the basics are not basic to consensus climatology.
If we knew the missing physics, it wouldn’t be missing would it. Really. Alan, that should have been obvious.
Known unknowns include cloud response to changes in tropospheric thermal energy flux.
Likewise Hadley cell.
So if we had a better understanding of cloud radiative feedback and some Hadley Cell dynamics, you’d be satisfied that we had a “complete” theory of climate? Those are the things precluding an understanding of the radiative greenhouse effect and its ability to drive ocean warming in your view?
No theory in science is ever immune from the discovery of previously unknown phenomena – that is part of science. By this reasoning we cannot use any scientific theory to inform us about anything in the natural world.
“No theory in science is ever immune from the discovery of previously unknown phenomena “
It’s not just unknown phenomena that’s at issue. Cloud radiative feedback is a KNOWN phenomena that is characterized by basic climate physics. It’s a parameterized GUESS.
Models predicting anomalies can’t even tell us what is actually happening because they are based on incomplete data to begin with, i.e. daily mid-range temperatures. When two different climates can have the same daily mid-range temperature then the mid-range temperature is a useless metric for trying to analyze climate!
When climate science can properly put forth theories concerning enthalpy, how it varies globally, what causes different enthalpies even in “close” geographic locations then maybe climate science will be able to put forth actual physical theories. Meanwhile, climate science is just a big data matching glob of equations that don’t really mean anything in the physical world.
(hint: temperature is an intensive property)
So the fact that the multi-model means of the CMIP ensembles closely match real-world observations is just a coincidence?
It’s a consequence of parameter tuning.
That would only apply to historic simulations, not future projections.
It would apply so long as the historical trend continues.
Each ensemble relies on different assumptions and parameterizations. Why would averaging their results provide useful information? This is a matter of physical science, not statistics.
Climate scientists think you can average multiple wrong things and get a correct answer. How in Pete’s name can you know?
Not surprising. I’ve raised this point elsewhere: many people, I suppose, forget that air temperatures recorded by thermometers are influenced solely by immediate weather conditions.
Local environmental factors like soil composition, vegetation, and topography also play a role. When daily temperature readings are averaged into a monthly mean, this average, and all subsequent calculations, inherit these very localized, non-climatic effects. You definitely don’t want your metric for tracking global climate change to be inheriting them.
many people, I suppose, forget that air temperature recorded by thermometers are *NOT* influenced solely by immediate weather conditions.
There was a study done by Hubbard & Lin in 2002 about this. They found that *any* adjustments to temperatures recorded by a measurement station has to be done on a station-by-station basis. No regional adjustments. Meaning homogenization and infilling done by climate science does nothing but make measurement uncertainty worse instead of better.
This is because of the different microclimates at every station, which is what you are describing. Humidity, pressure, elevation, terrain (your topography), and geography all play a major role in the microclimates. The microclimates between San Diego and Ramona, CA are very different yet they are only 30 miles apart. This would make them candidates for infilling or homogenization when one is a coastal city and the other an inland town on the other side of a mountain range. Temp differences can be 30F to 40F different during the day.
Even averaging the daily mid-range values of these two locations is impossible. Since temperature is an intensive property you can’t assume a continuous gradient exists between the locations that changes at the same rate. Yet climate science does exactly that averaging.
Pairwise homogenization relies on a recursive testing strategy to detect changes in the statistical properties of the differences between neighbor and target stations. The statistical thresholds used by the algorithm can fail to capture subtle physical changes, especially since the method already obscures short-term variations by focusing on anomalies.
Think of a thermometer placed in a densely foliated area of a garden, where temperatures are slightly cooler compared to more open sections. The algorithm might erroneously treat this as an acceptable comparison because the minor temperature differences do not exceed the statistical significance threshold it uses. Like you say, this oversight means that the algorithm could implicitly propagate these localized, contextually significant variations into data from stations with entirely different microsite.
Unfortunately, AlanJ and I are at an impasse. He is a strong advocate of Menne’s methodology and supports his approach.
Daily temperature distributions at different locations have different variances. In order to compare those distributions you have to weight them so you are comparing apples and oranges. Recursive testing for breakpoints does not take this into consideration thus it only contaminates the station data being adjusted.
As an extreme example think northern hemisphere and southern hemisphere temp data. Colder temps typically have a higher variance than warmer temps. Yet climate science jams NH and SH temp data together with no attempt at proper weighting at all. Hell, they can’t even tell you what the variance of the data is! They never calculate it! They just assume its always Gaussian and iid!
AJ typically has no idea what he is talking about. He just repeats religious dogma that usually has no basis in reality.
False. Even Gavin Schmidt admits that the models run far too hot.
Cloud feedback is an emergent property of models, it is not a parameterized input. Other aspects of cloud behavior are parameterized because they occur at scales smaller than the model’s resolution, and these parameterizations produce uncertainty in model estimates of cloud radiative feedback. But nothing about this prevents scientists from understanding how the CO2 greenhouse effect influences ocean temperatures.
Daily mid-range temperatures are also not a model input, so it isn’t clear what exactly your misconception is based on there.
“how the CO2 greenhouse effect influences ocean temperatures.”
Radiation physics is not a theory of climate.
If cloud behaviour is parameterized then *that* influences the cloud feedback “emergent property”. That, in turn, means that the emergent property is *NOT* theory based but is nothing more than a guess used to make results come out to match pre-conceived assumptions.
“Daily mid-range temperatures are also not a model input, so it isn’t clear what exactly your misconception is based on there.”
Of course they are a model input since they are what the climate models attempt to data match! If they aren’t an input then why are the models trained to match past temperatures?
Who in Pete’s name do you think you are fooling on this?
Your paragraph 1: no
Your paragraph 2a: true
Your paragraph 2b: wrong
Thanks for nonsense.
So, specifically, what do you think is needed in order for us to understand the radiative greenhouse effect and its ability to force a change in ocean temperature? For someone demanding a complete theory of climate, it doesn’t seem like you’d know one if you saw it.
How can a reflective body (CO2) warm a heat source (the ocean) to a temp higher than the ocean started with?
If a bucket being filled from a tap has a leak at the bottom, making the leak smaller will make the water level in the bucket higher, even though making the leak smaller isn’t adding any water back into the bucket. If you can wrap your mind around this concept, you are well on your way to a breakthrough.
“isn’t adding any water back into the bucket.”
Yes, it is. It’s adding the water that once escaped through the leak, but now does not.
Good insight. The atmosphere is adding energy that once might have escaped directly to space, but now does not.
The same amount of energy escapes into space now, as did before.
The story with CO₂ is that the energy escapes at a slightly higher altitude. The constant (average) lapse rate means the surface becomes a bit warmer.
Here: spend 20 minutes with Chris Essex. He discusses climate models, the computational problems they face, and certain problems with the physics.
He also mentions in passing why agreement among models is specious, as is their agreement with the historical record.
Because the system has warmed up.
I can boil the video down for anyone who doesn’t have 20 minutes: climate models are complicated and it is important to understand their limitations. This is probably news to Essex’s Heartland Institute audience, but is not novel to the scientists who actually work with these models.
“If a bucket being filled from a tap has a leak at the bottom, making the leak smaller will make the water level in the bucket higher, even though making the leak smaller isn’t adding any water back into the bucket. If you can wrap your mind around this concept, you are well on your way to a breakthrough.”
Thus the leak isn’t making the water height temp higher than the original input! The height of the water is based on the water tap input. The height won’t go higher than what the water tap allows!
If you can wrap your mind around this concept then you are well on your way to a breakthrough!
Nether is a leak in the bottom of a bucket the same as a reflective body with respect to heat and temperature.
If a reflective body like CO2 could actually raise the temperature beyond what the sun’s input allows then temperature would go UP at night instead of going DOWN.
If you can wrap your mind around this concept then you are well on your way to a breakthrough!
The input allows any height of water in the bucket – if there were no leak or drain, the water would fill until it flowed over the top. The sun has a limitless supply of energy to give. The diameter of the leak is what determines how high the water level will actually reach.
There is no solar input at night. The water tap has been turned off. The water will drain out of the bucket at whatever rate the leak or drain allows.
Of course there are differences, what matters are the similarities. Understanding those is what will allow you to have a breakthrough.
“The input allows any height of water in the bucket – if there were no leak or drain, the water would fill until it flowed over the top.”
All this shows is that you have absolutely no basic understanding of the thermodynamic physics of the earth and the sun.
The earth radiates heat every single second of every single minute of every single day – even when and where the sun is shining and it radiates MORE during the day when the temperature goes up. The sun’s input is greater than the “leaking” energy from the earth which is what forces the temperature up during the day. If the earth would become like Mercury *then* you would see metals melting on the earth where the sun would be shining all the time – i.e. the bucket overflowing.
“The sun has a limitless supply of energy to give.”
Then why hasn’t Mercury been vaporized over the existence of the solar system?
“There is no solar input at night. “
That’s correct. That means there is NO FORCING at night. If CO2 was a *forcing* agent then the earth’s temp *would* go up at night!
“Of course there are differences, what matters are the similarities. Understanding those is what will allow you to have a breakthrough.”
What similarities? You keep speaking of CO2 being a radiative *FORCING* which causes the earth’s temperature to go up. Water leaking out of the bottom of a bucket is *NOT* a forcing and neither is CO2. The water in the bucket doesn’t keep rising when the tap is turned off and the earth’s temperature doesn’t keep rising when the sun is turned off.
You can’t even figure out whether it is maximum temps that CO2 drives up or if it is minimum temps. You are a perfect example of climate science today. No understanding of basic physics at all.
Yes, and the bucket drains from the leak every second of every minute. When the tap is off, the water level drops, when the tap comes back on, the water level goes up. How far it drops and how far it goes up is a function of how large the drain hole is. Thus, the diameter of the drain can be seen to control the equilibrium level of the water line. If you can understand that the equilibrium temperature rests on the balance of incoming vs outgoing energy, you will start to grasp the basic driver of the earth’s climate.
That’s not what a forcing is – making up your own private definitions of common terms and doggedly adhering to them is one of the reasons you’re confused all the time. A forcing is a process that modifies the energy balance of the planet – it either modifies the outgoing flux of terrestrial energy or modifies the incoming flux of solar energy. Either will force the equilibrium temperature to a different state. A forcing is not something that raises the planet’s temperature without sunlight.
Forcing function:
external influences or inputs applied to a system that drive its behavior or response
“How far it drops and how far it goes up is a function of how large the drain hole is. Thus, the diameter of the drain can be seen to control the equilibrium level of the water line.”
For the earth the size of the drain hole is an exponential function. It starts off VERY large at sunset because the temperature has gone up. If the earth was a black body the exponential factor would be T^4. Then the drain hole gets smaller and smaller as the temperature falls. What matters then is the *amount* of leakage under the exponential curve – which is NOT* equal to any kind of linear “average” value. It is greater.
When the sun is not shining there is *NO* equilibrium point. There is only a continual radiation of heat – until the sun comes up again.
Since CO2 is *NOT* a heat source there can be no “equilibrium” point at night. The heat just keeps on leaking according to the exponential curve.
“ If you can understand that the equilibrium temperature rests on the balance of incoming vs outgoing energy, you will start to grasp the basic driver of the earth’s climate.”
Again, CO2 is *NOT* a heat source. It can only reflect back part of what it receives. Therefore there is *NO* incoming energy. That could only come from a heat source.
“That’s not what a forcing is – making up your own private definitions of common terms and doggedly adhering to them is one of the reasons you’re confused all the time. A forcing is a process that modifies the energy balance of the planet – it either modifies the outgoing flux of terrestrial energy or modifies the incoming flux of solar energy.”
It is climate science that has corrupted the word “forcing”.
What you are speaking of is ENERGY FLOW. That is *NOT* a force. It is this misunderstanding that leads to the climate science thinking CO2 can RAISE the temperature of the earth. It can’t. It’s what drives the misunderstanding that the temperature at night can reach an equilibrium – which you keep claiming with your bucket analogy. The only “incoming” energy flux is REFLECTED energy from a heat source – i.e. the earth. Reflected energy can’t cause an equilibrium point since it is not a heat source and can only reflect a portion of what is received from the heat source.
If you and climate science would start using ENTHALPY instead of temperature this would become immediately obvious – which is one of the reasons climate science doesn’t want to move to using enthalpy even though they’ve had the capability of doing so for over 40 years!
How can your clothes keep you warm?
You clothes don’t keep you warm. Your metabolism does! Your clothes aren’t a heat source, your body is. Clothes can’t raise your temperature higher than what you metabolism provides for.
Stand naked outside and feel how cold you get. Put on clothes and watch your body temperature magically go up. In Tim’s world, the laws of physics have just been violated. Somehow, he thinks, the clothes are putting energy into his body!
Stand outside in sub-zero temps overnight with nothing on but a shirt and pants and see just how cold you get!
Clothes are *NOT* a heat source. The only heat source you have is yourself.
It’s pretty obvious you’ve never watched an episode of “Naked and Afraid”. Especially one taking place in freezing temperatures.
It seems that most of those defending climate science, at least here, have little to no actual experience in reality. No understanding of measurement practices, no understanding that clothes aren’t a heat source, and no understanding that the earth doesn’t reach an equilibrium temperature at night. Unfreakingbeliveable.
I started to get chilly last night so I went and threw on a sweatshirt and felt nice and warm after. Are you saying I imagined that? Would it have kept me just as warm to strip down instead?
Your understanding of thermodynamics is sadly lacking. Without the clothes the heat source, i.e. your body, can’t keep up with the heat loss to the colder surroundings. The clothes are *NOT* a heat source and, therefore can’t warm you. What they do is slow the heat loss to the surroundings so your heat source, i.e. your body, can keep with with the heat loss.
Again, the clothes are NOT A HEAT SOURCE. They can’t warm you. They can’t raise your temperature. All they can do is slow the heat loss to the surroundings so that your heat source can warm you and raise your temperature.
You are *still* trying to rationalize your belief in the existence of perpetual motion.
Your body and your clothes represent mostly conductive heat loss. The formula for this is q = -kA dt/d, where q is the rate of heat transmission, A is the area normal to the direction of flow, k is the thermal conductivity of the material under consideration, and dt/dL is the gradient (i.e. the change of temperature with the change in distance.
When you put on clothes.all you do is change k, the thermal conductivity and, therefore the rate of heat transmission.
This does *not* apply to radiative heat loss so your analogy is, as usual, sadly lacking in relevance.
There you go. You’re so close to getting it, if only you could wrap your head around the very things you yourself are saying.
Of course it applies to radiative heat loss. If I reduce the flux of radiative energy from my body, my body’s temperature will increase. This is an arbitrary constraint you’ve imposed in order to maintain your denial.
For you, Nick. Chris Essex on climate modeling.
If you put clothes on a statue, does the statue warm up?
Climate science, at least as espoused by AJ, believes it will. Clothes are a heat source that can raise the temperature of nearby objects. Same for CO2.
Radiation physics is not a theory of climate. No one knows whether a radiative greenhouse effect can force a change in ocean temperature. Including you.
I’m demanding no theory. I’m merely noting its absence. Unlike you, I will not force a conclusion in the face of ignorance.
Radiative physics is not the physical theory of climate in the same way that organic chemistry is not the theory of biology—it is a fundamental component that underpins and explains key processes within the broader scientific framework. Anyone with a basic understanding of thermodynamics understands that the radiative greenhouse effect can force a change in ocean temperature.
Radiation physics doesn’t tell us anything about the climate. It only informs us of the behavior of CO₂ with radiation, in a gas mixture.
Electromagnetic radiation is the fundamental driver of planetary climates. Understanding how radiation interacts with the constituents in the atmosphere is fundamental. Your comment is like saying that organic chemistry doesn’t tell us anything about biology, it only informs us of the behavior of organic molecules in chemical reactions. It’s beyond reductive.
Unfortunately it is misapplied.
“Anyone with a basic understanding of thermodynamics understands that the radiative greenhouse effect can force a change in ocean temperature.”
It can’t FORCE anything! Anyone that understands Planck at all understands this.
CO2 is a REFLECTIVE surface, it is *NOT* a heat source. Only a heat source can *FORCE” a temperature change.
In order for the reflective surface to have heat to reflect the source must first have *lost* the heat and sent it toward the reflective surface. All the reflective surface can do is send some of that heat back making the net flux less negative at the source – but it can’t *force* the net flux to become positive at the source thus raising the temperature of the source.
It’s interesting, I can see exactly where your thought process is going wrong, but it’s difficult to explain the error in a compelling way because the misconception is so deeply ingrained in your thinking and you are steadfastly determined not to ever have your mind changed.
The sun is a continual input of energy to the whole-earth system. It never stops providing energy. On the nighttime side the energy stops flowing for a few hours, but comes back (like turning the tap off and then right back on again). The amount of energy the sun can provide is limitless. Therefore if the atmosphere “reflects” some outgoing energy back to the surface, that returned energy adds to the energy from the sun, so the energy content is higher than it would otherwise have been. This is simple, basic accounting.
My company pays me 100 dollars a day. I throw 100 dollars a day away. I have zero dollars in my pocket at the end of every day. My wealth never grows.
Bob picks up one of the dollars I threw away and gives it back to me the next day. Now I get 101 dollars that day and throw away 100. My wealth has increased by 1 dollar. That dollar didn’t magically appear out of thin air, it was returned from the money I threw away from my employer. If my goal is to stay broke I’ve now got to throw away 101 dollars.
“The sun is a continual input of energy to the whole-earth system.”
So that’s how I got a sunburn last night watching the stars?
“The amount of energy the sun can provide is limitless. Therefore if the atmosphere “reflects” some outgoing energy back to the surface, that returned energy adds to the energy from the sun,”
That reflected energy is energy that was already lost by the earth. Do you understand how to integrate over time?
In essence you are trying to explain how a perpetual motion machine works.
It’s obvious you don’t understand radiative flux at all. If you are an example of a typical climate scientist then it’s no wonder climate science is as screwed up as it is.
My guess is that you simply don’t understand what Pat Frank tried to tell you about the same amount of energy being sent out into space – if it wasn’t the earth would have become Mercury a long time ago. The lapse rate causing a higher temp means a higher rate of energy is sent out from the surface of the earth – resulting in the same amount going out into space regardless of CO2 amount.
It’s like the climate science logic that as the TOA goes up as CO2 goes up means each CO2 molecule radiates less so the energy loss to space goes down. Totally missing the obvious point that as CO2 goes up there are *MORE MOLECULES” radiating so each one doesn’t have to radiate as much to get the same total rate of energy being sent into space!
Nor does it matter how much energy the sun has available, it might just be limitless. What matters is the rate at which energy is received by the earth – and *that* is not limitless. It’s determined by the temperature of the sun meaning how much energy it is generating at any point in time, not how much it might be able to produce before it goes dark.
My math might be rusty, but I’m pretty sure that $99.25 is more than $99.00. You’re richer with Bob in your life than you are without, and money didn’t have to be created from nothing.
The sun is a perpetual energy generator on any timescale relevant to human existence.
At equilibrium, there is always the same flux of energy to space. Energy in must equal energy out. But adding CO2 puts the planet out of equilibrium. There is more energy in than energy out. So the temperature goes up to compensate. After the temperature goes up, the fluxes are balance and equilibrium is restored.
Too bad the climate models include no electro-magnetic fields and waves math.
Oh God no that looks like a graph of a close coupled chaotic system. We’re all doomed!
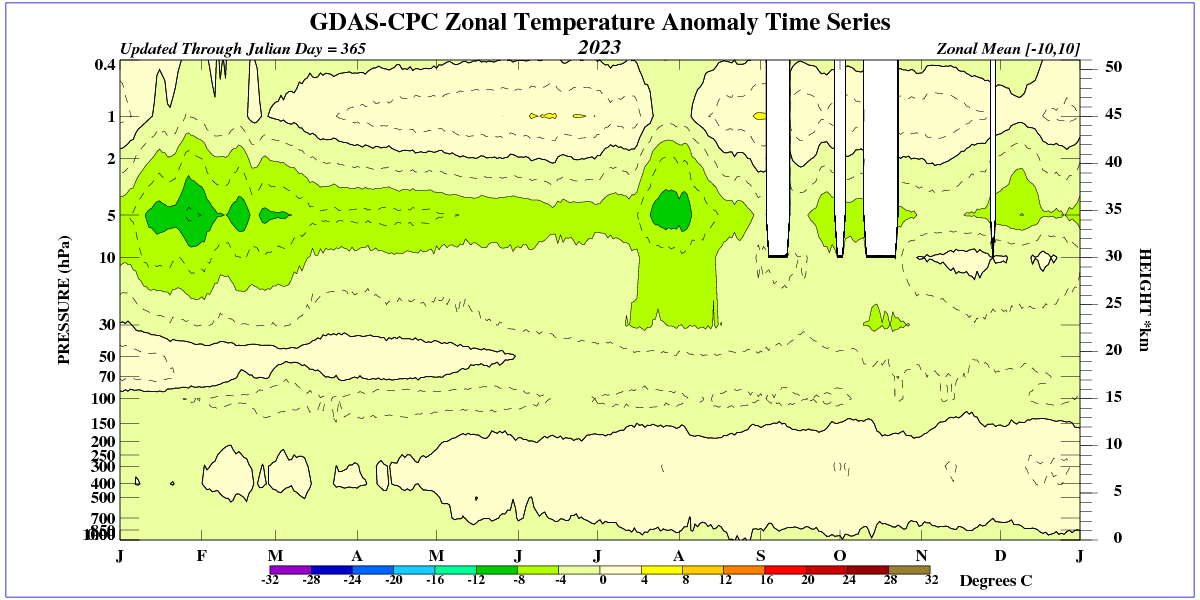
In my opinion, there is a growing role for high-energy UV radiation, which may increase with a decrease in ozone production in the stratosphere (as can be seen from the decrease in temperature in the upper stratosphere). Therefore, in summer, surface temperatures and water vapor over the ocean can rise sharply. However, they will decrease sharply when the angle of incidence of solar radiation changes.


The calculation starts with measurements of current total ozone amounts over the entire globe, obtained via two satellites operated by the National Oceanic and Atmospheric Administration. These data are used to produce a forecast of stratospheric ozone levels for the next day at many points across the country. A computer model uses the ozone forecast and the incident angle of sunlight at each point to calculate the strength of UV radiation at ground level. Sunlight angle is determined by latitude, day of year, and time of day (solar noon). The strength of UV radiation is calculated for several wavelengths between 280 and 400 nm, the full spectrum of UVB (280-314 nm) and UVA (315-400 nm) radiation.
That was the stop-reading point for me.
I’m not sure about the reliability of the above UV Index map. Yesterday, near Dayton (OH), there was a solid cloud deck most of the day. I doubt that the UV Index got up to the indicated range of 8-9, even at the peak.
“Less puzzlement was to be found when the oceans were ‘boiling’ during the last two years.”
Apartfrom all the articles saying how puzzling it was.
Natural processes are at work; we don’t yet know about many related to the Sun. The smaller the particles reach the Earth, the more their properties are unpredictable, and at sufficiently low temperatures their properties throughout their mass become stable (individual particles cannot be distinguished).
http://www.bom.gov.au/cgi-bin/oceanography/wrap_ocean_analysis.pl?id=IDYOC007&year=2024&month=08
We’ve been hearing that nonsense for years, decades maybe, on this ridiculous site.
Who remembers David Archibald and his imminent cooling (because the sun); or Don Easterbrook and his imminent cooling (because the oceans); both around the same time ~15 years ago? Both heavily featured here.
They’re predictions were demonstrably wrong.
The IPCC projections of ~+0.2C per decade warming from around the same time have proven to be reliable; a slight under-estimate as things stand, in fact.
Talk about ridiculous. Your lack of self awareness is peaking today isn’t it.
Puzzlement was when the climate clowns thought 100F in a lagoon was “boiling”..
No puzzlement that you cannot produce any human causation for the main climate events of the last 2 years… HT and the El Nino..
They are both totally natural have zero human causation.
“As of now, these atmospheric conditions… are quite perplexing.”
Mother Nature has a sense of humor.
NOAA: ‘“As of now, these atmospheric conditions… are quite perplexing.”’
One would think that NOAA would know that weather, atmospheric conditions, and climate is extremely complex. What is so perplexing about that? It’s complicated!
It is only perplexing to NOAA “scientists” that have the hubris to think the science about climate is “settled”.
Right. NOAA scientists think they have it all figured out, and then they discover surprises, and are perplexed.
Don’t let Mother Nature fool you! It’s still climate change and bad for the planet!
Humor. A difficult concept.
— Lt. Saavik
Gosh do you suppose it could be just the natural variability of WEATHER??? But nooooo, so many “climate scientists” look at one year to the next and proclaim the sky is falling. Perhaps even the rule-of-thumb 30 years is too high a resolution for real climate change…
I’m surprised we don’t hear from them each day about how much it has warmed up from early morning to noon, and we’re all going to die!
Not a good sign, most major earthquakes happen on a steep downslope of SST.
Well, if sea surface temps went down then it’s obviously due to climate change, right? None of this stuff actually constitutes normal variation or “weather”, right?
“Heads, I win, tails you lose”.
Temps go up – “climate change” … temps go down “climate change”. Extreme weather in any part of the world on any given day, “climate change”.
It’s like a very good drinking game line. Whenever anybody says, “it’s climate change” … now pour me another!
The Atlantic changes may very well be a sign of an AMO phase change which likely will take a couple of years to complete. In addition, we have El Nino moving towards La Nina and the dissipating effects of the Hunga-Tonga eruption.
All of these are likely to create cooling. Going to be very interesting the next 2-3 years. Of course, the media will tell us the cooling is all due to humans using fossil fuels (they just haven’t figured out the narrative yet).
Given the unprecedented nature of the Hunga-Tonga eruption, shouldn’t we predict that the next few years will be more unpredictable than usual?
They aren’t talking about it because they haven’t yet been provided the alibi/narrative, they will ignore it until they have the narrative then the CoveringClimateNow.org star chamber will propagate it around the planet in 8 seconds
But surely, we will be informed that Hunga-Tonga was caused by – ummm – Climate Change [TM] – so we must all drive electric cars at all times, and eat bugs.
Note, my crystal ball is a bit cloudy, but the ‘eat bugs’ bit comes through strongly!
Auto
Very nice, good information.
It has been a very cloudy summer here in my part of Canada , S. Ontario. I suspect this is a more widespread phenonemon. It is estimated that the Tonga eruption ejected 150 million tons of water into the atmosphere.
Meanwhile, snowing west of Calgary at this moment, single digits temps in calgary
was at a Pirates game last night, 34C.
Anticipating shrinkage as I fly home
When ocean surface temperatures increase there is more evaporation. That should lead to more cloud cover. More cloud cover leads to less sunlight reaching the ocean surface thus causing a decrease in ocean surface temperatures…. Just a thought
That seems to always escape climate science’s notice. When the evaporation occurs it also takes heat with it – i.e. a cooling effect. Most people would consider this to be a negative feedback. Climate science considers it to be a positive feedback that increases the water temperature (i.e. GHG action from the increased water vapor in the atmosphere).