By Steve Goreham
Originally published in Master Resource.
Energy prices are skyrocketing in California. The state’s electricity, gasoline, and natural gas prices are amongst the nation’s highest and rising. Green energy policies are the primary cause for high and escalating California energy prices.
California electricity prices increased by 98.2 percent over the last 15 years, the highest rise in the nation. No other state comes close in terms of price increases. US average electricity prices rose 30.6 percent over the same period. California power prices rose to a level that is the second highest in the nation, only lower than Hawaii. In contrast, prices in Texas have actually declined since 2008 due to a focus on retail competition and a decrease in natural gas prices.

California is the epicenter of green energy in the United States. The state established the first renewable portfolio standard in 2002, mandating that 20 percent of electricity be from renewable sources by 2017. Governor Arnold Schwarzenegger instituted a 33 percent renewable requirement by 2020. In 2018, Governor Jerry Brown signed an executive order mandating 100 percent zero-carbon electricity by 2045.
The transition from traditional power plants to renewables has been a top priority for California for the last 20 years. By the start of 2023, California’s grid contained more than 6 gigawatts(GW) of wind, 17.5 GW of utility-scale solar, and 14 GW of residential rooftop solar.
Over the last two decades, the state retired 11 coal-fired power plants and converted three other coal plants to burn biomass fuel. The San Onofre Nuclear Generating Station closed in 2013 and the Diablo Canyon Power Plant, the state’s last nuclear plant, has been scheduled for closure.
In 2022, natural gas provided 42 percent of California’s in-state electricity generation, with other sources providing: solar (27%), nuclear (8%), hydroelectric (8%), wind (7%), geothermal (6%), and biomass (2%). The state imports about one-fifth of its electricity from surrounding states.
Solar and wind generators are more expensive than traditional coal, gas, and nuclear generators. Wind and solar occupy huge amounts of land, perform poorly during winter months, and suffer from intermittent output.
Vaclav Smil’s book Power Density points out that wind and solar systems use about 100 times the land area of traditional generators to produce the same electricity output. Renewable facilities also tend to be far from population centers, requiring expensive buildouts of transmission systems. Land and transmission costs boost the price of electricity from these generators.
The intermittency of wind and solar generation has the largest cost impact. Cloudy days and nights eliminate solar output and windless days idle wind turbines. Winter solar output drops to about half the available summer output. About 90 percent of traditional coal or natural gas generators must be maintained as backup for intermittent wind and solar systems, boosting power prices.
California leads the US in deployment of grid-scale batteries. The plan is to use batteries to store electricity when wind and solar generation is high and then release the stored power back to the grid when wind and solar output is low. Wind and solar plus battery systems are being deployed as a low-carbon alternative to coal and gas power plants.
But the use of grid-scale batteries to backup renewable generators multiplies the cost of electricity. Utility-scale solar systems cost about $1 million per megawatt (MW) of rated capacity. Grid-scale batteries with four hours of discharge duration cost about $1.5 million per megawatt of capacity. These batteries can back up solar for only about four hours.
To replace a gas-fired power plant, a battery system would need to back up a solar installation for one or more days. A battery that can back up a $1 million one-megawatt solar facility for a single day would cost about $9 million. Grid-scale batteries only have a 12-year lifetime, about one-half of the solar lifetime. Adding batteries to backup solar for a single day boosts the total capital cost by more than a factor of ten.
February 29 found California regular gasoline prices at $4.74 per gallon, the highest in the nation. California drivers pay 40 percent more than the national average. The state has its own blend of gasoline, and claims that the blend will emit fewer greenhouse gases when burned. Higher gasoline taxes and a shortage of local refineries also factor into the high prices.
California also consistently ranks in the top 10 in natural gas prices. Prices are high because the state imports more than 90 percent of its gas from other states and has a shortage of gas storage facilities.
Green energy policies affect not only electricity and fuel prices, but also housing utility and construction costs. Many regulations aim to reduce greenhouse gas emissions from buildings. The California Air Resources Board passed a regulation outlawing new residential gas heaters by 2030. San Francisco, Los Angeles, and other cities have voted to ban gas appliances in new construction. Only electric heat pumps, water heaters, and stoves may be used. These measures further boost the cost of energy for homeowners.
Housing prices are rising because of green energy mandates. The 2020 California Solar Mandate requires newly constructed homes to have solar panels and wiring for electric appliances. The California Building Standards Commission enacted standards that require electrical conduit for level two EV charging in single-family homes and parking facilities with EV chargers for multi-family homes and hotels. These additional requirements make the cost of housing less affordable for low-income residents.
Southern California Edison, Pacific Gas & Electric, and San Diego Gas & Electric, the big California utilities, have all asked for 2024 rate increases, in part needed to bury hundreds of miles of transmission lines to reduce the threat of forest fires. Residents already pay $300-500 per month for energy. There seems to be no end in sight to rising California energy prices.
California leaders know that rising prices are a huge problem. The state is now considering a plan to tie utility rates to personal income so that the rich pay more and low-income residents pay less.
But affordable energy is clearly not as important as efforts to try to stop global warming. Costly California looms as an example of poor energy policy.
Steve Goreham is a speaker on energy, the environment, and public policy and the author of the new bestselling book Green Breakdown: The Coming Renewable Energy Failure.
What was that about renewables being cheaper than conventional?
Tom, it was always just unmitigated leftist propaganda.
Manipulated, tortured, cherry-picked numbers.
If you look up LCOE, you get a picture of a steaming pile of bullshit.
I was being sarcastic.
I knew that.
Now we know why wacko-woke, DEMOCRAT-RUN California has been losing 300,000 plus/y of long-time, hard-working, law-abiding, tax-paying families, who are moving to Texas, Florida, Idaho, etc.
California is gaining people living, deficating on sidewalks, thanks to the Biden cabal just-walk-in open borders, so Democrats can register these unvetted folks to vote, to give Democrats permanent majorities in the US
The end of the US; ruined from within, without firing a shot,
The US people are sooooo screwed
My great grant aunt moved with 18 other family members to Idaho in 2020.
Only two stayed behind, because they have very good jobs.
She said, we should have done that in 2010
Tom, the same people that believe that also believe Biden is doing a good job.
You like already read Ed Hoskins, but if not, here is one of his posts that clearly demolishes the “renewables” are cheaper nonsense – and I know you are being sarcastic.
https://edmhdotme.wpcomstaging.com/a-few-graphs-say-it-all-for-renewables/
“California is the epicenter of green energy in the United States.”
No. Here (EIA data from here) is how things stood in 2022:
These are the states that produce the most total renewable energy (millions of megawatt-hours), according to the U.S. Energy Information Administration:
Texas (33.95)
Washington (25.01)
California (19.52)
Iowa (13.30)
Oregon (13.11)
Texas is way ahead, despite smaller population than Cal. And in Texas electricity prices went down.
As did their reliability Feb 2021 thanks to non functioning renewables, a lack of necessary fossil generation capacity, and a massive peak demand that was 15% over prior all time high peak
The claim here is that renewables put prices up.
It was actually gas generation that failed in Feb 2021.
No Nick.
It was the mandated electric pumps for the gas supply that failed.
No Mr. It was the failure of prioritizing those “electric pumps” that failed.
To Cliffie Clavin, it was much more than just the “electric pumps”. The whole Texas natural gas to electricity supply chain, from the sand face to the generator, is now almost entirely electrified. From chemical pumps to dehydration to liquids removal to remotely monitoring and controlling, the system is much more reliable than 40 years ago, due to this electrification. It’s not going away, and can be easily supported in the most adverse weather conditions, with proper prioritizing and common sense weatherization. Many colder states have done so for decades.
Renewables do put prices up
1998 CA electricity rates 9¢ -11¢/kWH
California 2006 renewables mandate instituted
2010 rates 19¢ – 22¢/kWH
2016 rates 26¢ – 32¢/kWH
2023 rates (TOU) 36¢ (off peak) – 54¢/kWH (on peak)
All since the 2006 ruinables mandate
Bryan, Texas decided on November 7, 2023, that unreliable and intermittent wind and solar had resulted in the death of enough of their citizens and passed into law a Bill providing $10 billion of incentives for the construction of natural gas-fired electrical generation. Noteworthy is the legislation specifically prohibits funding battery storage, an even worse waste than wind and solar.
There’s signs of sanity in Texas
Washington has water power, that is, dams.
NWD-CBasinDams.jpg (500×547) (umn.edu)
And WA sends energy to CA via the Pacific DC Intertie – Wikipedia
What also hasn’t been mentioned is the effort to remove the dams that enable production of hydro based electricity.
Washington??? Really Nick??
THAT is all HYDRO, that existed BEFORE the wind and solar scam even started.
How much of Cali is Hydro???
How much of Oregon is Hydro???
What an @ssh@t you are.
California specifically excludes all large hydropower generation from being classified as “renewable”, while the EIA does not.
Nick chose to gaslight everyone instead anyway with a newspaper article that does not mention this.
The point is that Texas has by far the most renewables, and no hydro. Yet in the graph shown here, its electricity prices went down 10%.
And California’s prices went up 98% in 15 years while not counting large Hydro as a renewable. Sounds like a management problem to me.
Lets see. What are the obvious differences in energy management policy with California vs Texas?
See Spain this year – a huge decrease in energy prices due to renewables.
Huge savings during the gas crisis due to renewables.
https://www.iea.org/reports/renewable-energy-market-update-june-2023/how-much-money-are-european-consumers-saving-thanks-to-renewables
We will see this more and more with each passing year.
Even China is building massive amounts of renewables for that reason.
“Electricity demand in the EU’s industrial sector fell by an estimated 6% in 2022 and again in 2023”.
“Prices of electricity for energy intensive industries in Europe in 2023 were almost double those in the US and China and the gap widened putting EU energy intensive industry competitiveness under pressure”
IEA ‘Electricity 2024 Analysis and forecast to 2026’
EU industry is relocating elsewhere because of the high electricity prices in Europe.
Prices coming down from the high caused by gas, and the failure of nuclear energy in france 2022. Would be far worse without renewables.
The high price of gas was because of the war in Ukraine and the slow down and then complete interruption of supplies from Russia to Europe.
Price caps, mylittlepony, not renewables as such. Huge savings mandated by the Spanish government.
Still no proof why the price was far below the cap, i guess?
Don’t argue with Nick-al-ass; he is the world’s ex-burt in everything (in his own mind )
If you disagree with him, you must be wrong … that’s just how it is !!!
According to the eia here renewables make up 39% of California’s utility-scale electricity generation while for Texas the figure is 27%.
Renewable energy consumption as a share of state total in Texas is 9% while in California it is 18%.
re: ” renewables make up … Texas the figure is 27%. Renewable energy consumption as a share of state total in Texas is 9%
NONE of these numbers shown are to be believed (White man speak with forked tongue), except under rigorous stipulation of the ‘case’ being presented – RIGHT NOW, this is how it is in Texas with wind supplying 44% of the grid in Texas (the sun has set, so solar is not contributing).
One day! Cherrypicking on stilts.
Again, NONE of those ‘eia’ numbers shown above are to be believed, except under rigorous stipulation of the ‘case’ being presented. QED.
Maybe you’re just partially innumerate?
(Dumb asses becoming MORE and MORE prevalent in everyday life.)
If you are going to stoop to insults at least have the balls to use your real actual full name.
Stilts is a great way to pick cherries, works for apples as well (:-))
So that means that fossil fuels are contributing 47.3%, so more than the 44% for renewables? On exactly one day, big deal.
re: ” renewables make up … Texas the figure is 27%. Renewable energy consumption as a share of state total in Texas is 9%
Again, NONE of these numbers shown above are to be believed, except under rigorous stipulation of the ‘case’ being presented
NOW let’s do the computation when solar was producing about 1:30 PM CT this afternoon:
26.7 % Solar
35.8 % Wind
——-
62.5 % ‘Renewables’ total
Chris Hanley,
I can’t see those figures on the page linked. But if I go to this associated EIA page, I read
“Renewable energyCalifornia is second in the nation, after Texas, in total electricity generation from renewable resources. The state is the nation’s top producer of electricity from solar energy and geothermal resources. “
Mr Nick Stokes please look harder.
The linked page is headed CALIFORNIA, under Profile Data you should find ‘Supply and Distribution’, open it by clicking you should find subheading ‘Utility-Scale Net Electricity Generation (share of total) California’ Renewables: 39.2%.
Then go through the same process for Texas, don’t thank me it was a pleasure.
And to the right of those figures, it tells you the period of the data – November 2023. A single month.
Also your linked page is dated April 2023, my link is dated March 2024.
Now Nick will suffer a cognitive dissonance migraine…
Well, it’s another thread you’ve totally beclowned yourself in. Must be a day ending in “y.”
Huh … “tomorrowy” is a new word.
No, tomorrow never comes so cannot be a day but ‘today’ ends in a ‘y’, always does.
Reminds me of a “Joe’s Crab Shack” restaurant I saw that had painted on one side, “Free Crabs Tomorrow!”. 😎
Raw pricing is not the best indicator – at least, its not the best indicator of the relative costs of generating electricity by gas, coal, nuclear, wind, solar or whatever.
Whether all costs are bundled into the price is a political choice. In the UK, as a for instance, which has been well documented by Paul Homewood, a great many of the costs are bundled, but a great many are not.
In addition, gross amount of power produced by different technologies is a bad indicator. You would not expect total produced by wind or gas or whatever to be the driver of prices. The important production variable is probably percentage of power generation from the different sources, and even then this may be misleading, because the question is whether they delivered what the generated when it was needed.
The only way to do the comparison properly is to start out with the same product specification in terms of supply. You have to specify what you require in terms of scheduled and unscheduled downtime, consistency of output , point of delivery of supply etc.
You then cost what will be required for each of the technologies to deliver to that standard. In the case of wind, this means counting the gas plant needed to cover calms, the transmission required to get power to where its needed.
Every time I have seen this attempted it has shown that both wind and solar are not cost effective. Absent compulsory purchase, constraint payments, ability to deliver on an as-available basis with backup costs incurred elsewhere, no liability for transmission charges, that is, absent being excused half the real costs, no-one would be able to justify using wind or solar.
In economic terms, done properly, the business cases are bust. This is the central point, and arguing on irrelevant indicators like raw pricing or raw totals of generation obscures the point.
Any large company has staff in the finance department able to do this in their sleep, given the data. All you need is a copy of Excel or an HP12C. But as far as I know, no green advocates have ever done it. Including Nick.
Noting above that CA is relatively heavy on solar as its source of “renewable” energy may be a mistake since that is what grew the most over 15 years when they screwed the pooch on their price promises. That and some other things like dependence on other states and a total war on carbon (as opposed to Texas’ inclusivity) might explain most of it. At any rate, things were supposed to get better under the CA brand that emphasizes “green” uber alles and went completely the opposite direction.
The chart shows a 10% decrease for Texas, yes, but the underlying numbers in the spreadsheets don’t support that claim. (That almost never happens…) Residential average electricity price in Texas in 2009 was 12.38 cents/kWh, and in 2022 (the most recent year in the spreadsheet) it was 13.76 cents. That represents an 11% increase, not a decrease. The chart appears to be lying, and Nick ran with it. Good job Nick!
A better question would be: how much cheaper (and more reliable) would Texas’s electricity price be today, without all those expensive unreliable generators they built?
“The chart appears to be lying”
AS so often here, the term lying gets thrown about when there is just a failure to read. The chart is headed “All sectors, 1908-2023”. You have looked up residential, 2009-2023. The chart which Steve Goreham put up is correct.
So for all sectors, in Texas, I am getting a 7% decrease specifically from 2008-2022. (Not quite 10% as shown in the chart. And the chart title is “2008-2023” and not “1908-2023″ as you wrote.) You are correct about that, give or take the difference between 2022 and 2023, which I can’t tell from the spreadsheets. However, looking closer, if you pick a different start year, e.g. 2007, you get a 0.5% increase. From 2009, a 3% increase. From 2010, a 9% increase. So 2008 seems to have been a bit of a spike, an outlier. Indeed it was the most expensive year for electricity in Texas since 1990. (By comparison, since 1990, the all-sectors price has doubled. A 100% increase.) Is there a bit of cherry-picking going on? This statistic is not even a little bit robust.
In other words the all-sectors decrease shown in the chart consists of an increase for residential customers, but a larger decrease for commercial and industrial ones, only for that particular choice of two specific years.
Therefore I’m still going to call the chart a lie. (Not Steve Goreham’s lie, to be sure.) More precisely, a good example of how to mislead with cherry-picked statistics.
(When residential prices go up, but commercial and industrial prices go down, it makes me suspect that someone is putting their thumb on the scale and squeezing the residential customers in order to subsidize commercial and industrial ones, possibly on the theory that residents are less likely to pack up and leave than big businesses, and that the latter would be worse for the state than the former.)
Are you going to answer the more important question, as I mentioned, which was “how cheap would Texas electricity be today, if they hadn’t wasted all that money on expensive unreliable so-called renewable generators” ?
Diablo Canyon produces a constant stream of 2283 MW hourly 24 hours a day (Guaranteed Daily) and cost $15B in 2022 adjusted dollars
The generation facilities sit on 12 acres with 750 acres surrounding it for security.
Topaz Solar sits on 4700 acres with a nameplate of 550MW and capacity factor of 26.6% so produces an average of 146.3MW hourly for 4 hours a day. (Average not guaranteed daily or hourly)
The dollar/MW for Solar and Battery mentioned above would cost $16M/MW with 1902MW of battery storage required for 24 hours of supply. At that cost Solar plus Battery costs $36.528B and would require 73,300 acres just for the panels plus additional concrete acreage for the 1902 MW of storage batteries…
re: “Diablo Canyon produces a constant stream of 2283 MW hourly 24 hours a day”
Diablo Canyon produces a constant stream of 2283 MW
hourly24 hours a dayOops, doesn’t affect the bottom line though
You were potentially on the path to bastardizing/conflating/confusing MW and MWh … the average reader here can be mislead by such close misuse of terms.
The average reader here couldn’t give a flying fig whatever the hell you write, quite frankly.
It takes a lot of other people’s money to deliver substandard energy.
“California leaders know that rising prices are a huge problem. The state is now considering a plan to tie utility rates to personal income so that the rich pay more and low-income residents pay less.”
Under a flat tax regime, the rich will always pay far more in taxes, even under the exact same rate (ten percent of a million is a lot more than ten percent of 10,000). Likewise, the “rich” are almost always going to use more energy than the bottom income tiers, and therefore pay a lot more. If you create a progressive regime not only for taxation, but also for pricing overall for energy, then California’s exodus of industries and wealthy entrepreneurs will accelerate. On top of that, by focusing on making your domestic energy production and supply come from the most expensive sources-green renewables- is asking for economic harakiri. Just please stop fleeing to red states, thanks.
The plan is to use batteries to store electricity when wind and solar generation is high and then release the stored power back to the grid when wind and solar output is low.
Own 6.64kW nameplate rooftop solar array like I do in an ideal Med climate Adelaide in Oz and you know immediately that’s utterly delusional. In ideal temp and sunny weather in autumn and spring it can produce 44kWhrs for the day but cop a cloudy wet day in winter and it’s as low as 1.8kWhrs for the day. You simply can’t hide from the truth with your solar inverter connected to a phone app but the deniers are everywhere.
More good news. I don’t think wind and solar should be allowed to use fossil fuel and nuclear for backup. Make this one rule and wind and solar go away.
I’ve got no problem with solar and wind with a level playing field instead of the State sponsored dumping now. Just legislate that no suppler of power to the consumers’ communal grid can supply anymore than they can reasonably guarantee 24/7/365 (ie short of unforeseen mechanical breakdown) along with FCAS or keep them and use them for themselves. I’m a level playing field kinda guy.
Each wind and solar system should include a power plant that fills in all power up to 80% of rated capacity, MW, of the wind/solar systems, plus Owners must be charged for connecting their remote plants to the HV grid, by the grid operator
That way variability and intermittency would disappear, as far as the grid operator is concerned
Yes, only way to do it. Set a spec, which should normally be what a modern coal or gas plant delivers, then take bids from anyone who wants to tender to it.
Compare apples with apples, and wind and solar are non starters.
All you need is an HP12C and a copy of Brealey and Myers.
I agree with you, I have no problem with wind and solar but it should not be connected to the grid. Anyone who builds and pays for their own wind and solar generators has my blessings. The grid is far too important to be put at risk by intermittent energy sources especially expensive ones like wind and solar.
We should also require that wind and solar energy collectors be manufactured by using only wind and solar power for the mining and manufacturing processes.
I don’t know how those figures for Texas were derived (‘Electricity Price Increases’, EIA 2009, 2023) but, I did NOT pay 10% less in 2023 than I did in 2009 … WHY are these people ‘pissing on my leg yet telling me its raining’?
And CA is higher than Hawaii
CA 2nd tier usage 56¢/kWH
CA TOU peak demand 54¢/kWH
Hawaii 41.6¢/kWH
Damn. I just signed a 3 year contract for 4.87¢/kWH. I live in Ohio.
Oops – my bad. That’s the rate for the actual gas. Add in delivery charges of a little under 8¢/kWH, so 12.87-ish… Still factor of 4.
Here in Ohio we have what’s called ‘Energy Choice’. One provider to the home, but you can choose from a large number of gas providers (20+), each with different costs, contract lengths, etc. Since the base charge is non-negotiable, I tend to think of things in terms of the actual gas cost.
Sorry about that.
Good question. According to their own figures from the relevant spreadsheets, residential average rates in Texas in 2009 were 12.38 cents/kWh and in 2022 were 13.76 cents. That sounds like an 11% increase to me. What kind of math are they using?
do you have to pay extra for them to tell you it’s raining?
This was not the reason California had it’s own blend of gas. The Los Angeles smog basin is the reason. California first added MBTE to gasoline to replace tetraethyllead which caused lead pollution and ruined catalytic converters that reduced NOx smog.
Both were added to raise octane levels and improve burning. MBTE was all good until levels rose in groundwater and then it was bad. Ethanol is now the oxygenate of choice, but none of these were introduced to reduce greenhouse gas emissions.
And since they reduce gas mileage, they probably INCREASE greenhouse gas emissions.
The sad thing is that oxygenates are no longer required with modern engine control systems. Combustion is controlled to ensure excess oxygen (that’s what the O2 sensor in the exhaust is for). Ethanol is just another political boondoggle.
I thought much of that smog was caused by trees.
Is the heading picture the Ivanpah power plant? If so with the hundreds of watts of energy being emitted downward by CO2 does it work at night?
Powered by taxes-
‘Any freight company’ will take electric trucks subsidised by Australian taxpayer (msn.com)
We’ll see how that goes down with cost of living worries.
I’ll do something risky -make an economic forecast.
The truck company or companies who “take” the taxpayer funded, worse-than-useless electric trucks will tout its “green” credentials, the virtue signaling idiot true believers will buy the stock and drive up it price, the original “investors” will dump their stock and realize the speculative gains, then the company or companies will swiftly enter bankruptcy when the worse-than-useless electric trucks don’t “perform as (unreasonably) expected.”
Labor all hat and no cattle-
New study on renewables should make for ‘sombre reading’ for Chris Bowen (msn.com)
California proudly burning its forests to support a GR$$N agenda. The question is becoming: Will the planet survive the GR$$NS’ destructive practices?
More of California will be a desert, with major runoffs during big rains
Will the rich even notice when their solar panels allow them to charge power back to the power companies at retail when the power companies can’t use it?
The rich need their ethical and sustainable rare earths for that-
Federal government to invest $840m in Arafura rare earths project in Central Australia (msn.com)
What? Me worry? California can buy nuclear- generated power from Arizona as and when needed.
The power generated by Palo Verde Nuclear Generating Station is used within Arizona. There isn’t any spare base load capacity available to sell.
to ban gas appliances in new construction
I dont’ know how these laws are written but from my experience, this usually applies to renovations as well as newly built houses. Anyone know for sure if that’s the case?
You can check out any time you want, but you can never leave, unless you are wealthy and smart enough to get going before the entire transportation system collapses.
California electricity prices just got worse. Here’s the latest and greatest solar + storage Project.
Copied: The $1.7 billion ($2.525 billion without subsidy) Edwards & Sanborn Solar + Energy Storage project, California, 2024 is a true renewable energy behemoth, spanning 4,600 acres, comprised of 1.9 million First Solar panels. It holds a capacity of 875 MWdc solar, and nearly 3.3 GWh of energy storage. It has a 1.3 GW interconnection capacity.
Comment: Calculations Solar + storage
$1.7 billion, 3300 MWh of storage and 875MW nameplate of solar x 26.5 CF =230 MW Net
Net capacity 230 MWH, in 24 hours = 5520 MWh, 230MW/hour, 3300 MWh total storage/230= 14 hours of storage minus in and out losses = 12 hours of battery storage
.
3300 MWh storage x $500,000/MWh= $1.65 billion for the storage.
At $1,000,000/MW x 875 MWdc= $875 million for solar panels
$1.65 billion for storage +$875 million for the panels =$2.525 billon
$2.525 billion x 70% (after tax credit) = $1.7675 billion ($1.7 billion)
Note: Storage cost for a mere 4 days (100 hours rounded) = $500,000/MW x 100 hours x 230 MW net output = $11.5 billion.
$11.5 billion/$0.875 solar panel cost = 13 times more $cost for storing 100 hours of plant net output vs solar panel cost.
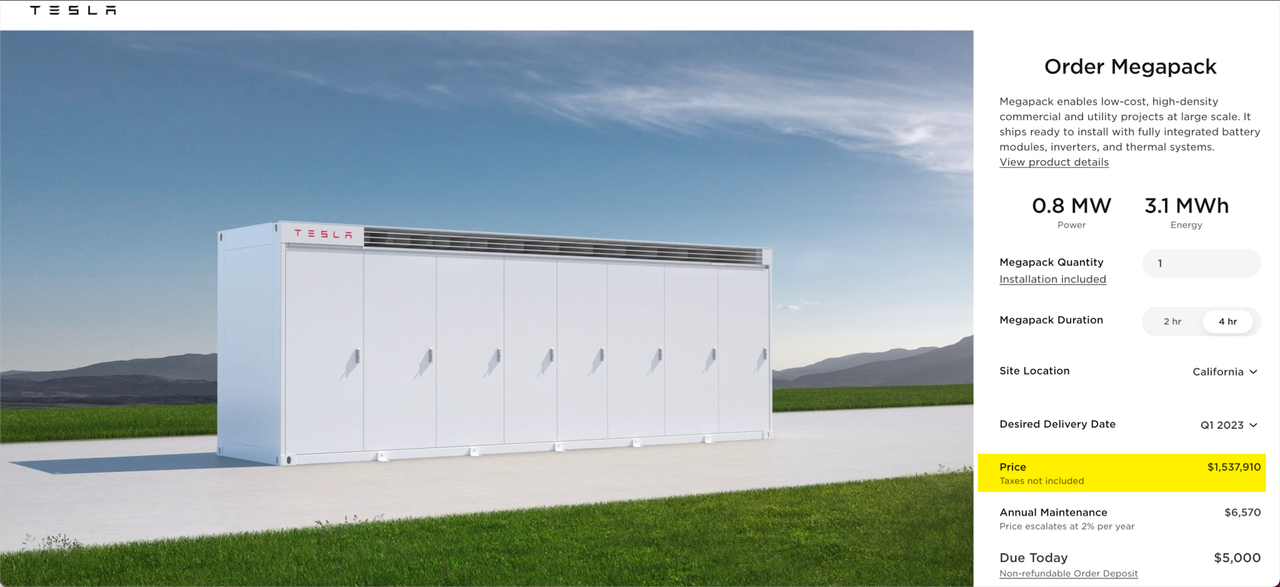
“Utility-scale solar systems cost about $1 million per megawatt (MW) of rated capacity.
Grid-scale batteries with four hours of discharge duration, rated 1 MW/4 MWh, cost about $1.5 million per megawatt of capacity. These batteries can back up solar for only about four hours.”
That statement is just talk and no analysis by a journalist type, not an engineer
I inserted the proper rating of his battery.
Here are more meaningful real-world numbers
Turnkey Cost of Large-Scale, Megapack Battery System, 2023 pricing
 ?itok=lxTa2SlF
The system consists of 50 Megapack 2, rated 45.3 MW/181.9 MWh, 4-h energy delivery
Power = 50 Megapacks x 0.979 MW x 0.926, Tesla design factor = 45.3 MW
Energy = 50 Megapacks x 3.916 MWh x 0.929, Tesla design factor = 181.9 MWh
Estimate of supply by Tesla, $90 million, or $495/kWh. See URL
Estimate of supply by Others, $14.5 million, or $80/kWh
All-in, turnkey cost about $575/kWh; 2023 pricing
https://www.tesla.com/megapack/design
https://www.zerohedge.com/commodities/tesla-hikes-megapack-prices-commodity-inflation-soars
Annual Cost of Megapack Battery Systems; 2023 pricing
Assume a system rated 45.3 MW/181.9 MWh, and an all-in turnkey cost of $104.5 million, per Example 2
Amortize bank loan for 50% of $104.5 million at 6.5%/y for 15 years, $5.484 million/y
Pay Owner return of 50% of $104.5 million at 10%/y for 15 years, $6.765 million/y (10% due to high inflation)
Lifetime (Bank + Owner) payments 15 x (5.484 + 6.765) = $183.7 million
Assume battery daily usage for 15 years at 10%, and loss factor = 1/(0.9 *0.9)
Battery lifetime output = 15 y x 365 d/y x 181.9 MWh x 0.1, usage x 1000 kWh/MWh = 99,590,250 kWh to HV grid; 122,950,926 kWh from HV grid; 233,606,676 kWh loss
(Bank + Owner) payments, $183.7 million / 99,590,250 kWh = 184.5 c/kWh
Less 50% subsidies (ITC, depreciation in 5 years, deduction of interest on borrowed funds) is 92.3c/kWh
At 10% usage, (Bank + Owner) cost, 92.3 c/kWh
At 40% usage, (Bank + Owner) cost, 23.1 c/kWh
Excluded costs/kWh: 1) O&M; 2) system aging, 1.5%/y, 3) 19% HV grid-to-HV grid loss, 3) grid extension/reinforcement to connect battery systems, 5) downtime of parts of the system, 6) decommissioning in year 15, i.e., disassembly, reprocessing and storing at hazardous waste sites. The excluded costs add at least 10 – 15 c/kWh
NOTE: The 40% throughput is close to Tesla’s recommendation of 60% maximum throughput, i.e., not charging above 80% full and not discharging below 20% full, to achieve a 15-y life, with normal aging
Tesla’s recommendation was not heeded by the Owners of the Hornsdale Power Reserve in Australia. They excessively charged/discharged the system. After a few years, they added Megapacks to offset rapid aging of the original system, and added more Megapacks to increase the rating of the expanded system.
http://www.windtaskforce.org/profiles/blogs/the-hornsdale-power-reserve-largest-battery-system-in-australia
COMMENTS ON CALCULATION
Regarding any project, the bank and the owner have to be paid, no matter what.
Therefore, I amortized the bank loan and the owner’s investment
If you divide the total of the payments over 15 years by the throughput during 15 years, you get the cost per kWh, as shown.
According to EIA annual reports, almost all battery systems have throughputs less than 10%. I chose 10% for calculations.
A few battery systems have higher throughputs, if they are used to absorb midday solar and discharge it during peak hour periods of late-afternoon/early-evening.
They may reach up to 40% throughput. I chose 40% for calculations
There is about a 20% round-trip loss, from HV grid to 1) step-down transformer, 2) front-end power electronics, 3) into battery, 4) out of battery, 5) back-end power electronics, 6) step-up transformer, to HV grid, i.e., you have to draw about 50 units from the HV grid to deliver about 40 units to the HV grid, because of a-to-z system losses. That gets worse with aging.
A lot of people do not like these c/kWh numbers, because they have been repeatedly told by self-serving folks, battery Nirvana is just around the corner, which is a load of crap.
Will, my numbers were calculated based on what this article contained. The project was completed in two stages beginning in 2021 my $500,000/MWh storage is awfully close as is the solar panel cost.
.
Copy: Financing for the first phase was closed in 2021 and included $804 million senior secured credit facilities. This includes $400 million construction and term loan facility, a $328 million tax equity bridge facility, and a $76 million construction and revolving letter of credit facility. J.P. Morgan is providing the tax equity commitment for the initial phase of the project, with Deutsche Bank leading the construction and term financing.
In 2022, Terra-Gen closed a nearly $1 billion project financing for the second phase of the project.
Largest US solar-storage project goes online
A new 875 MW solar project in California features nearly 2 million solar panels and offers more than 3 GWh of energy storage.
JANUARY 22, 2024 RYAN KENNEDY
Meanwhile here in Georgia:
I was going through old files recently and found I had failed to shred all my old Georgia Power bills and found one from 2011 covering Oct 17 through Nov 15.
Total kWh: 1,438
Total bill: $190.22
price/kWh: $0.1323
Note the published rate is considerably lower: shown above is the fully-bundled price, including all taxes, fees, administrative charges, etc.
Fast forward to 2023 and for the period Nov 15 – Dec 16 I have:
Total kWh: 1,454
Total bill: $208.14
price/kWh: $0.1432
This bill has considerably more detail, so I see all the various fees, surcharges, etc., including $62.32 in fuel charges, $17.10 in “Environmental Compliance Cost” and $4.36 in “Nuclear Construction Cost Recovery” (i.e., Plant Vogtle). Otherwise the two bills are very comparable — covering almost exactly the same consumption at the same time of year.
So in 12 years my effective “all-in” rate has gone up roughly 8.2%.
But in the same time the cumulative inflation has been 38%. So my 2011 bill would be $262.43 in 2023 dollars — over $70 more than I actually paid.