From Heartland Daily News

YOU SHOULD SUBSCRIBE TO CLIMATE CHANGE WEEKLY.
IN THIS ISSUE:
- New Research Further Demonstrates Problems with Surface Temperature Records and Models
- Video of the Week: Mann vs. Steyn: Climate Trial of the Century Continues – Guest: Phelim McAleer
- Global Hurricane Update: No Detectable Change Despite Warming
- Urban Agriculture Produces More Carbon Dioxide than Conventional Agriculture
- New Deep Sea Coral Reef Surprises Discoverers
- Podcast of the Week: Climate Change on Trial: Mann’s Failing Grade
- Climate Comedy
- Recommended Sites
Miss Anything at Heartland’s Climate Conference? No Problem.

New Research Further Demonstrates Problems with Surface Temperature Records and Models

Climate Change Weekly has long detailed the severe problems with surface temperature records, driven largely by the Urban Heat Island (UHI) effect compromising the integrity of the vast majority of temperature stations.
In two studies for The Heartland Institute, meteorologist Anthony Watts detailed the extent to which the surface station record in the United States is compromised by station siting that violates the National Oceanic and Atmospheric Administration’s (NOAA) own standards for the proper, unbiased, siting of surface stations. Watts’ initial 2009 study found that 89 percent of the surface stations in NOAA’s and the National Weather Service’s (NWS) system were poorly sited and biased. After the study, NOAA/NWS closed some of the most severely compromised, ridiculously sited stations highlighted in report. Indeed, NOAA had already recognized the problem and had prior to the first study’s release established the U.S. Climate Reference Network (USCRN), consisting of 137 climate observing stations with the best equipment, existing in stable locations unlikely to ever be compromised by nearby development. At the same time, however, NOAA also added thousands of previously unregulated stations established and maintained by others to its system.
The larger system provides more comprehensive coverage, but the vast majority of the stations are, unsurprisingly, poorly sited. As a result, Watts’ follow up survey of NOAA’s surface station network found 96 percent of the stations used to determine U.S. average temperatures are biased upward due to poor siting. The UHI has compromised them.
How bad is the problem? As explained in an article in The Epoch Times, the U.S. Environmental Protection Agency has estimated that “daytime temperatures in urban areas are 1–7 degrees Fahrenheit higher than temperatures in outlying areas, and nighttime temperatures are about 2–5 degrees Fahrenheit higher.” Whereas the temperature record from the USCRN indicates little or no temperature change during its 18 years of existence, the broader network supports claims that the U.S. is warming. By the way, as detailed in previous Climate Change Weekly posts, what’s true for the United States is also true for the global surface station network and, since 2015, for the ocean temperature measurement system. Both are biased by poor siting compromising the validity of the temperatures measured.
A new report from the Heritage Foundation by Roy Spencer, Ph.D., a long-time friend of The Heartland Institute, principal research scientist at the University of Alabama in Huntsville, and currently a visiting fellow in The Heritage Foundation’s Center for Energy, Climate, and Environment, looks at a slightly different problem with temperatures: the difference between measured warming and climate model temperature projections. It is not just that the Earth has warmed less than biased temperature measurements indicate, it has also warmed less than climate models have said it should for the amount of CO2 humans have emitted into the atmosphere.
Spencer’s research found recent warming is likely not due solely to human greenhouse gas emissions, and the warming experienced is substantially less than climate models have predicted—43 percent less, in fact. And that’s even when readings from the UHI-biased stations are included.
Spencer examined summertime temperature readings for 12 Corn Belt states in the United States. Each of the 36 models he compared to measured warming by surface stations, weather balloons, and global satellites overstated the amount of warming experienced, with most of the models off by 100 percent or more. (See the graphic, below)

Spencer is also working on a large-scale study to explain the discrepancy between urban and rural temperature stations globally, and how that plays into recent claims temperatures are setting all-time records. His preliminary data suggests measured warming is strongly correlated to population density. As cities grow, and populations increase and become more densely packed, temperatures in urban and suburban areas rise faster than in the surrounding countryside, once again confirming Watts’ conclusion that the temperature record is compromised by UHI.
If Watts’ and Spencer’s research are correct, not only do climate models “run too hot,” as even some of their proponents have been forced to admit, but the regularly reported surface station record is running too hot as well.
Sources: Heritage Foundation; The Epoch Times; Dr. Roy Spencer
Get your Copy at Amazon TODAY!

Video of the Week
In the second week of the defamation trial, where serial litigator and special climate snowflake Michael Mann sued Mark Steyn and others for libel, the proceedings featured notable developments and surprising revelations. To discuss, Phelim McAleer, a filmmaker and journalist who is attending the trial in a federal court in Washington, DC, joins episode 95 of Climate Change Roundtable.
Thursday afternoon marked a significant moment in the trial, featuring Steyn cross-examining Mann. McAleer will share his observations with host Anthony Watts and panelists H. Sterling Burnett, Linnea Lueken, and Jim Lakely.

Read the brutal truth about how battery production for electric vehicles cause immense environmental destruction and human tragedy.
Global Hurricane Update: No Detectable Change Despite Warming

New research from Professor Roger Pielke, Jr., Ph.D., of the University of Colorado at Boulder, and research meteorologist Ryan Maue, Ph.D., suggests there may have been a slight upward trend in global landfalling major hurricanes since 1970, but there has been no similar trend in minor landfalling hurricanes.
They throw cold water on the idea major landfalling hurricanes have increased due to global warming by looking at longer-term records and trends.
If one begins the analysis in 1950 rather than 1970, in the Western North Pacific and North Atlantic, where we have reliable longer-term data, one finds no upward trend in either major or minor landfalling hurricanes.
As Pielke, Jr. and Maue remark, their research confirms the findings of NOAA in the United States and the U.N.’s Intergovernmental Panel on Climate Change (IPCC):
In technical terms, detection of change has not been achieved—which is fully consistent with the scientific consensus of NOAA and the IPCC. Without detection there can be no attribution under the IPCC framework for detection and attribution. Given the large interannual and decadal variability in tropical cyclones, data are easily cherrypicked (intentionally or unintentionally) to identify spurious trends.
Looking beyond the number of major, minor, and total hurricanes, Pielke, Jr. and Maue cite the work of Phil Klotzbach, Ph.D., examining hurricane severity over time. Klotzbach’s research on Accumulated Cyclone Energy (ACE), a measurement of annual hurricane frequency, intensity or strength, and longevity, found that as the planet has modestly warmed, there has been no increase in ACE since 1980. (see the graphic, below)


No matter who measures it or what metric is used, there is no evidence climate change is causing more frequent or more powerful hurricanes.
Source: The Honest Broker
Heartland’s Must-read Climate Sites


Urban Agriculture Produces More Carbon Dioxide than Conventional Agriculture

Whatever the emotional or psychological benefits of growing fruits and vegetables on small plots of land within cities and urban areas, new research indicates the crops grown there produce much more carbon dioxide (CO2) per serving of food than conventional commercial farms.
The study, published in the journal Nature, was produced by an international team of 13 researchers, from universities and research institutes in the United States, Canada, France, Germany, Poland, and the United Kingdom. Led by scientists at the University of Michigan, the study noted urban agriculture is increasing as people embrace growing food locally for a variety of reasons, including the pleasure of growing ones’ own food, the belief that growing crops in urban environment is more sustainable, uses less energy, and produces healthier food. Another reason often cited is the desire to reduce agricultural emissions to fight climate change. I have discussed the fact previously that there is no evidence locally grown food reduces energy use or that the food produced is healthier. This study is the first to laser-focus on the latter justification given for urban agriculture—reducing farming’s carbon footprint—finding that the crops produced on urban farms and gardens produced six times more CO2, on average, than crops from conventional farms, with exceptions for select vegetables.
As described by Phys.org:
The study … used data from 73 urban farms and gardens in five countries and is the largest published study to compare the carbon footprints of urban and conventional agriculture.
Three types of urban agriculture sites were analyzed: urban farms (professionally managed and focused on food production), individual gardens (small plots managed by single gardeners), and collective gardens (communal spaces managed by groups of gardeners).
For each site, the researchers calculated the climate-altering greenhouse gas emissions associated with on-farm materials and activities over the lifetime of the farm … expressed in kilograms of carbon dioxide equivalents per serving of food, were then compared to foods raised by conventional methods.
After accounting for infrastructure, supplies, energy, and water, and the length of continued operations, the research group found that vegetables and fruits produced through urban agriculture emitted 0.42 kilograms of carbon dioxide equivalents per serving on average, six times more than the 0.07 kg CO2e per serving of conventionally grown produce.
“By assessing actual inputs and outputs on urban agriculture sites, we were able to assign climate change impacts to each serving of produce,” said study co-lead author Benjamin Goldstein, assistant professor at the UM School for Environment and Sustainability. “This dataset reveals that urban agriculture has higher carbon emissions per serving of fruit or vegetable than conventional agriculture—with a few exceptions.”
New Deep Sea Coral Reef Surprises Discoverers

Across dozens of articles in recent years, Climate Realism has noted that coral colonies are doing much better than commonly claimed by the mainstream media, which regularly tout corals’ impending demise, purportedly due to human-caused climate change. Among the findings we’ve discussed are posts on research published in Nature showing that billions of previously uncounted corals spanning hundreds of coral colonies have been recently discovered. Another study found coral colonies thriving in waters deeper and cooler than normally expected.
Now, CBS News is reporting that researchers have discovered and mapped in some detail the largest ever deep-sea coral cold-water reef in the world, off the United States’ Eastern Seaboard.
As CBS reported:
It’s been known since the 1960s that there were massive mounds of cold-water coral off the East Coast, and for years, NOAA researchers say they thought their study area, the Blake Plateau, was “sparsely inhabited.” But more than a decade of mapping and exploration “revealed one of the largest deep-sea coral reef habitats found to date anywhere in the world,” NOAA Ocean Exploration operations chief Kasey Cantwell said.
Researchers found the reef system in a study area of the Blake Plateau nearly the size of Florida, ranging roughly from Miami to Charleston, South Carolina. The underwater seascape turned out to be 310 miles long and 68 miles wide, NOAA said, and covers 6.4 million acres, an area larger than Vermont.
The “million mound” area of corals found coral colonies thriving between 656 feet and 3,280 feet below the ocean surface, absent any sunlight in water temperatures of 39℉.
“‘Many [deep-sea corals] live for hundreds of years, with some colonies living over 4,000 years,’” reported CBS, quoting NOAA. “[T]he latest discovery reveal[ed] nearly 84,000 individual coral mound peak features ‘Over time, these slow-growing corals can build mounds that rise over 150 meters (500 feet) off the seafloor.’”
Derek Sowers, mapping operations manager for the Ocean Exploration Trust, which partnered with NOAA on the study, noted that many more corals could be out there to find because approximately half of United States’ marine waters and 75 percent of the world’s oceans have yet to be mapped.
Source: CBS News; Climate Realism; Climate Realism
Podcast of the Week
Michael Mann spends all day in the witness box facing tough questions from Mark Steyn and Rand Simberg‘s lawyer. Does he have all the answers?
Hear his defense for falsely and frequently claiming to have won a Nobel Prize. Will the jury be convinced by his rather convoluted explanation for this scientific stolen valor?
And does Michael Mann really have a strong case for defamation? He himself frequently spreads false and malicious rumors about colleagues who challenged his science. Listen to his explanation for falsely accusing a female scientist and former colleague of “sleeping her way to the top.”
Subscribe to the Environment & Climate News podcast on Apple Podcasts, iHeart, Spotify or wherever you get your podcasts. And be sure to leave a positive review!
Climate Comedy

via Cartoons by Josh
If anyone ever gets to the comments
Burnett is a great writer and I have recommended every article of his I find, including this one, on my climate and energy blog
But this article had a few issies
The claim that USCRN shows no warming is false
The contradictory claims that NOAA’s NClimDiv has 96% improperly sited weather stations, so can not be trusted, is true, but the belief that NOAA’s USCRN is perfectly accurate, is just wishful thinking.
Either you trust NOAA and ALL their data or you don’t trust NOAA and ALL their data. To trust some of their data makes no sense
The ACE index undercount energy before roughly 1995 so should not be used for more than about 25 years. Tropical storm energy was undercounted before the late 1990’s. Enough to flatten what should have been a declining trend.
I think you can go a little into trusting some of their data. If they have a reputation for exaggerating warming, and their own data shows no warming, it’s a good bet that things have either stayed level, or they have cooled.
If a friend is know for being too pessimistic about everything, and one day announces his investments are doing better than he expected, it’s likely he’s still being pessimistic and his investments are doing great.
NClimDiv with poor siting allegedly produces almost the same numbers as USCRN with allegedly perfect siting.
That is very suspicious.
The believe that we should trust NOAA for USCRN, but not trust NOAA for NClimDiv, is illogical.
We have no idea if either average is accurate.
We do know that NOAA could not care less about improperly sited weather stations when first made public here in 2009. They
NOAA did nothing to fix the siting issues.
Is that trustworthy science?
The only warming in USCRN is from the 2015/16 El Nino bulge.
There was no warming from 2017 to the beginning of the current EL Nino.
Temperatures in 2005 were pretty much the same as in 2022 (0.49F vs 0.52F)
ClimDiv is SPECIFICALLY ADJUSTED to match closely to USCRN.
I trust them to make sure of that.
In other words, the closeness means absolutely nothing because it is totally contrived.
“The only warming in USCRN is from the 2015/16 El Nino bulge.”
Forrest Gump bNasty2000 is data mining to deceive
USCRN has a warming trend about 33% faster than the surface global average temperature warming trend
RG, are those 1-sigma or 2-sigma whiskers?
yawn! dickie-bot is another AGW stall-wart, always using El Ninos to show warming without looking at the actual data and what has caused it. Another bellboy-style trendologist.
Climdiv started a tad higher, and they have gradually honed their “adjustments” to get closer to USCRN. (unless you “believe” the climdiv sites have been cooling themselves in a linear fashion to make sure they match.USCRN)
Comparing local trends when the range is something like 8-10 times as much…
… saying its steeper, then presenting a graph which I showed several weeks ago… showing there is absolutely ZERO statistical difference.
Why do that !!
NOAA provide monthly anomaly data for both USCN and ClimDiv.
That gives a warming trend for USCRN that is “only” about 25% faster than ClimDiv.
Despite the monthly data giving a (slightly) more nuanced picture, 19 years (/ 228 months) worth doesn’t really tell us anything much about “climate change” though.
“ClimDiv is SPECIFICALLY ADJUSTED to match closely to USCRN.”
You have no idea what NOAA does. Both averages could be adjusted. Both could be wrong. Are you suddenly trusting the government bureaucrats at NOAA, who could not care less about station siting for NClimDiv, to tell you the truth?
If so, would you be interested in buying the 25% share of the Brooklyn Bridge that I own?
“would you be interested in buying the 25% share of the Brooklyn Bridge that I own?”
Oh so you were gullible enough to fall for that scam were you !!
Does not surprise anyone.
“Temperatures in 2005 were pretty much the same as in 2022 (0.49F vs 0.52F)”
That’s not how a trend is calculated, dingbat.
Poor dickie.. still using the El Ninos to create a trend.. just like any other AGW cultist/trendologist.
Just plonk a linear trend calculator on the data like a little AGW bellboy.. … don’t concern yourself about what the data actually shows.
Two years, one at either end , unaffected by EL Ninos have the same temperature.
what is so difficult for you to understand ?
“The only warming in USCRN is from the 2015/16 El Nino bulge.”
The El Nino Nutter has arrived. Always ignoring the cooling effects of La Ninas. How biased can you get?
Sorry you are an AGW nutter and can’t see the effect of the El Ninos.
But hey.. They are all you have, so you go on and use them to your hearts content..
Good little AGW trendologist.
And again.. showing you don’t understand La Nina…. not necessary cooling..
I suppose you are like fungal, and think it all acts like a pendulum because it has the “oscillation” in it.
“Spencer examined summertime temperature readings for 12 Corn Belt states in the United States.”
The corn belt is a cherry pick. Here is a map of station trends, unadjusted GHCN V4 data. The corn belt stands out as the low warming region in central USA.
Image here
JUNK DATA ALTER !!!
Just not that much urban warming out there. !
Which is why it should give a better idea of what is real.
Most warming taking place in the arctic, which is where I would expect to see the most warming due to warming having most impact in areas that are cold and don’t get much sunshine. I would expect the warming comes more from increases in minimum temperature than increases in maximum temperature.
Would be nice to see where the reporting stations are located as it looks to me as if there are some artifacts from the gridding process.
Roy Spencer has called out people on the “CO2 can’t be a problem” contingent as well as the CAGW contingent. To me, one of his more interesting comments was time between collisions for CO2 molecules was much shorter than the average time it takes a CO2 molecule to emit a photon (the CO2 molecule makes a lousy transmitting antenna). After giving it some thought, that delay was why CO2 lasers work so well, and was analogous to gamma decay.
I don’t know about all transitions of the CO2 molecule, there are many just within what we’d call the thermal spectrum, but certainly some transitions are very slow compared to collisions with other molecules in dense atmosphere — but, so what? Collisions take energy from some state of CO2, add energy to some diatomic molecules, in turn transfer some energy to H2O, which has collisions in turn…and the collisions themselves have reverse rates, going back to CO2 or H2O and so forth. What matters is the total process which involves who knows how many spectral lines. And, the cooling process involves exactly what photons finally leave the atmosphere way up high which then involves not only the spectra of IR active molecules, but also the temperature/humidity structure of the atmosphere from place to place…
Roy Spencer was rebutting the argument that any radiation absorbed by CO2 would be immediately re-radiated (this only applies to photons in the resonance bands of CO2). Van Wijngarden and Happer cover this in more detail in their 2023 primer on GHGs. This didn’t have much of an affect on my thinking on the actions of GHGs as I already knew the CO2 absorption was fairly well saturated – “energy self shielding” when determining the neutron balance for determining criticality of nuclear reactors.
The interesting part for me going through the thought process of what actually was going on with the CO2 molecule when radiating – keeping in mind that antennas have been an interest of mine. The other was remembering how quantum tunneling was used to get a very accurate accounting for the alpha decay half life’s as a function of decay.
The other aspect of molecular antennas is that the water molecule makes for a much better transmitting antenna than CO2 (due to a strong electric dipole), which makes for broader absorption/emission line, which then makes for a much more effective green house gas.
One more thing, longer times to emission are the flip side of narrower line widths – as would be expected by anyone familiar with modulation.
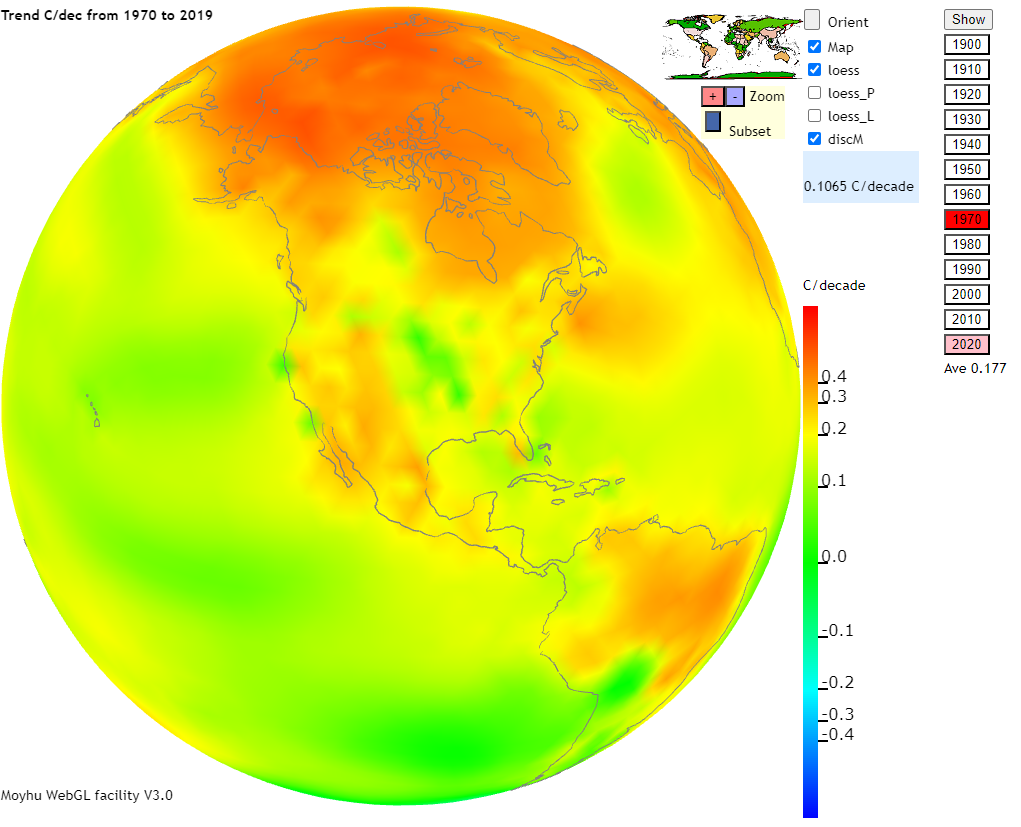
Come on now, Nick. In that image (representing global temperature change over that last fifty years) I see about half of the viewable globe as green.
So the region around the Canadian Rockies is the deepest red. Are they roasting? No. That’s roughly one degree warmer over fifty years (1970-2019). Even the most temperature sensitive wuss (me) could not notice that difference.
The map coloring scheme seems to be designed to scare people.
“Even the most temperature sensitive wuss (me) could not notice that difference.”
but… but… you’re supposed to notice it as an emergency!
And in the retreating glaciers in the high latitude Canadian Rockies one can find rather large segments of logs. Did these come from beneath the glacier, or carried by the glacier and dumped at its temination? No matter. The only way one could possibly observe such a thing is the past Arctic being much warmer than now…
I had to think about this one. Even if the logs were carried and dumped, they had to have originated during a warmer phase and been gobbled up as the glacier widened.
Fun fact: Everyone lives in a cherry picked location and nobody experiences global climate.
😎
If there’s a weather event, “It’s Climate Change due to Global Warming!”
If a part of the Globe doesn’t fit the meme, it’s cherry picking.
It IS NOT a cherry pick. It is part of the CONUS with the same CO2 concentration as the remainder of the globe also nothing special about humidity.
This is where you need to up your game from a trendologist to a scientist. Ask yourself WHY! Then tell us WHY the corn belt shows little warming!
While you are at it, explain why Greenland has a large amount of warming, yet their weather stations don’t show that.
If there is lots of coral in cold water, too deep for sunlight to reach, what is the source of their energy?
In general coral gets energy from sunshine and plankton. But obviously the contribution of sunshine declines with depth. So corals have learn to adapt to greater depths.
https://www.frontiersin.org/articles/10.3389/fmars.2020.566663/full
This paper, somewhat technical, details the mechanisms these oragnisms need to fix carbon from their environment.
As long as there is an agenda surrounding mere thermometer readings which is biased in favour of the horrible heat seeking alarmist money making propaganda then reliable meteorological science will remain largely unattainable. The fact that human beings survived and thrived higher temperatures in the Holocene needs to be satisfactorily answered by the propaganda seeking masses who suggest we cannot survive it again and that 2050 is doomsday. How come, I ask them loudly?
Why must it be so that we should be able to observe increased hurricane/typhoon intensity or frequency in our warming world? The so-called radiative imbalance is a mere 0.6Wm{-2}, which seems difficult enough to substantiate by indirect means itself, but more important these cyclonic storms are fluid-mechanical devices that probably have very wide latitude in their operation. They are likely able to vary how much heat they absorb from the surface and then dump at high altitude and radiate to space without much noticeable variation in observable parameters.
Well is the models don’t agree with reality then reality must be wrong. 🙂
Gather round children as it’s scientist story time-
Second atmospheric river hits California amid ‘life-threatening’ flooding warning | California | The Guardian
it’s both an El Niño story and a climate crisis story.
I showed the first part of the post around with the temp predictions vs measured temps. I got this stuff from realclimate back
https://www.realclimate.org/index.php/archives/2024/01/spencers-shenanigans/
Are these critiques valid?
Based on Gavin Schmidt’s history no, but you can read Dr. Spencer’s reply here https://wattsupwiththat.com/2024/02/01/gavins-plotting-trick-hide-the-incline/ or directly from his blog.
Where can one locate the U.S. raw SAT data to compare with adjusted? USHCN no longer exists? Does climdiv have the raw and final data?