Guest essay by Larry Hamlin
NOAA concocted an array of “Selected Significant Climate Anomalies and Events” for year 2023 that are shown below as prominently featured in their Annual 2023 Global Climate Report.

Of the 25 highlighted entries on NOAA’s “Selected Significant Climate Events” diagram 13 are related to cyclone and hurricane events across the various oceans of the Northern and Southern hemispheres that occurred during the year 2023.
These 13 highlighted isolated events suggest that 2023 experienced many extreme weather hurricane and cyclone events that will no doubt be hyped by climate alarmists with flawed claims of “extreme hurricane and cyclone climate events” having occurred in year 2023.
However, the context of these highlighted events fails to provide a complete and comprehensive global history of the cyclone and hurricane tropical events for the year 2023 with these highlighted events grossly misrepresenting the totality of the year 2023 cyclone and hurricane outcomes across the global oceans.
A prior WUWT article shown below demonstrates that these NOAA highlighted cyclone and hurricane “events” completely misrepresent the very “normal” global hurricane and cyclone year 2023 outcome.

The conclusion of this WUWT article notes:
Unlike the NOAA year 2023 concocted and prominently featured “Selected Significant Climate Events” diagram which falsely hypes the extent of the year 2023 global hurricane and cyclone season outcomes the data from the Colorado State University Tropical Meteorology Project clearly establishes that the year 2023 was a very unremarkable and “normal” year for cyclones and hurricanes across the globe.
Climate alarmist claims that hype the year 2023 hurricane and cyclone season as being an “extreme weather outcome” are absurd and incompetent as is NOAA’s “Selected Significant Climate Events” hurricane diagram portrayal.
Equally disturbing in the NOAA prominently feature “Selected Significant Climate Events” diagram are the highlights noted for both the Arctic and Antarctic global regions.
Instead of identifying the significant 8 yearlong (2016 to 2023) and 17 yearlong (2007 to 2023) inclusive periods of downward temperature anomaly trends respectively for these regions, NOAA hypes sea ice extent issues that are unaddressed in its report.
The reality of the sea ice extent issues for the arctic and Antarctic regions are addressed here and here.
The Arctic Region highest average temperature anomaly was 3.00 degrees C that occurred in year 2016 as shown below from NOAA’s Global Time Series data with a clear downward temperature anomaly trend since 2016 to 2.55 degrees C in 2023 (ignored and concealed by alarmists).
The Arctic’s year 2023 average temperature anomaly was 0.45 degrees C below its prior highest average temperature anomaly year of 2016.

The Antarctic Region highest average temperature anomaly was 0.65 degrees C that occurred in 2007 as shown below from NOAA’s Global Times Series data which clearly shows a downward temperature anomaly trend since year 2007 (ignored and concealed alarmists) .
The Antarctic’s year 2023 average temperature anomaly was 0.50 degrees C below its prior highest average temperature anomaly year of 2007 at 0.15 degrees C.

The Arctic and Antarctic global regional year 2023 long term significant downward temperature anomaly trends of 0.45 degrees C and 0.50 degrees C respectively were ignored in the “Selected Significant Climate Anomalies” diagram while the year 2023 North America and Europe global regional increase and decrease anomaly outcomes of 0.02 and 0.01 degrees C respectively are highlighted as being “Selected Significant Climate Anomalies” merit worthy.
Additionally, NOAA’s prominently featured diagram fails to highlight the largest temperature anomaly change of all 16 global regions with that being the reduction of 0.8 degrees C for the East N Pacific region (over a 9 year inclusive period of 2015 to 2023) as shown below.
Rather than address this large year 2023 average temperature anomaly reduction NOAA’s “Selected” diagram highlight for the East N Pacific global region is adorned with a flawed claim that Hurricane Dora exacerbated the fire in Lahaina with that flawed assessment addressed in more detail here.

Also, the Hawaiian global region large year 2023 average temperature anomaly reduction of 0.66 degrees C is unaddressed in the NOAA’s “Selected” highlighted diagram. This large reduction (over a 9 year inclusive period) of 0.66 degrees C from 2015 is shown below.

NOAA’s year 2023 average temperature anomaly data for its 16 global regions had 4 global regions which had by far the largest incremental changes from their prior record high average temperature anomaly values (all of them reductions) with these regions being:
Arctic – a reduction of 0.45 degrees C from year 2016
Antarctic – a reduction of 0.5 degrees C from year 2007
Hawaiian – a reduction of 0.66 degrees from 2015
East N Pacific – a reduction of 0.8 degrees C from 2015
Yet none of these significantly largest by far year 2023 average temperature anomaly reductions is addressed in the prominent NOAA’s “Selected Significant Climate Anomalies and Events” diagram for any of these regions while upward average temperature anomaly changes as small as 0.02 degrees C (North America) are highlighted.
The NOAA “Selected Significant Climate Anomalies and Events” diagram misrepresents many significant global anomalies and events for year 2023.
NOAA can’t even cherry pick well.
That’s why they call it “selection”.
NOAA can’t . . . etc.
And do not know the difference between climate and weather.
Chalk another one up to “Why we don’t trust our government.”
NOAA are manifesting symptoms of an entity of managerial class output rather than scientific output when it comes to climate.
Downright average administrators doing what they are told to, rather than high integrity scientists doing their best to show us what is true, and their honestly calculated estimation of “how true” ie certainty, to the best of their efforts and knowledge.
In such an environment, people of real talent, curiosity and integrity cannot thrive.
The 2023 Atlantic hurricane season resulted in 12 deaths. The Pacific season resulted in 64 deaths, for a total of 76 deaths.
Annualized, that is 0.2 deaths/day.
OTOH, approximately 25,000 people starved to death every day.
The climate alarmists are like evil magicians. Look at THIS hand that I want you to focus on. Don’t look at the other hand where the fatalities are 125,000 times worse!
Only 76 deaths? I’ll raise you. Even the mainstream media occasionally leaks a truth like the 90 deaths blamed on the recent cold.
https://www.cbsnews.com/news/freezing-weather-united-states-deaths-cold-continues/
Of course it’s always been true that cold-related deaths far outnumber heat-caused ones and NOAA left them out of their carefully selected anecdotal “climate anomalies”.
Reminds of me this Lancet misdirection
Look at the chartmanship going on with the scale
And compare to fentanyl-related overdose deaths. The latest tally from the CDC is over 107,000 people in the 12-month period ending in August 2022. And this does not include the walking dead or just dead while on street taking it.
In just five years, deaths involving fentanyl — the most frequently implicated substance — rose from 6 per 100,000 people to 22 per 100,000, according to the CDC.
Regarding TCs, NOAA keep peddling the “Storms” narrative, as opposed to TCs (ie hurricanes)
Named storms are higher than average in the Atlantic, for instance, but hurricanes are not. This is because NOAA now “name” more tropical storms, not because more are actually occurring.
https://notalotofpeopleknowthat.wordpress.com/2023/12/01/the-2023-atlantic-hurricane-season-was-average-not-4th-busiest/
Seems to me that I remember WUWT pointing out: Now they are naming Tropical Storms when before they didn’t. My short search doesn’t answer when that happened. I’ll keep looking.
Sure looks like they were doing it in 2010
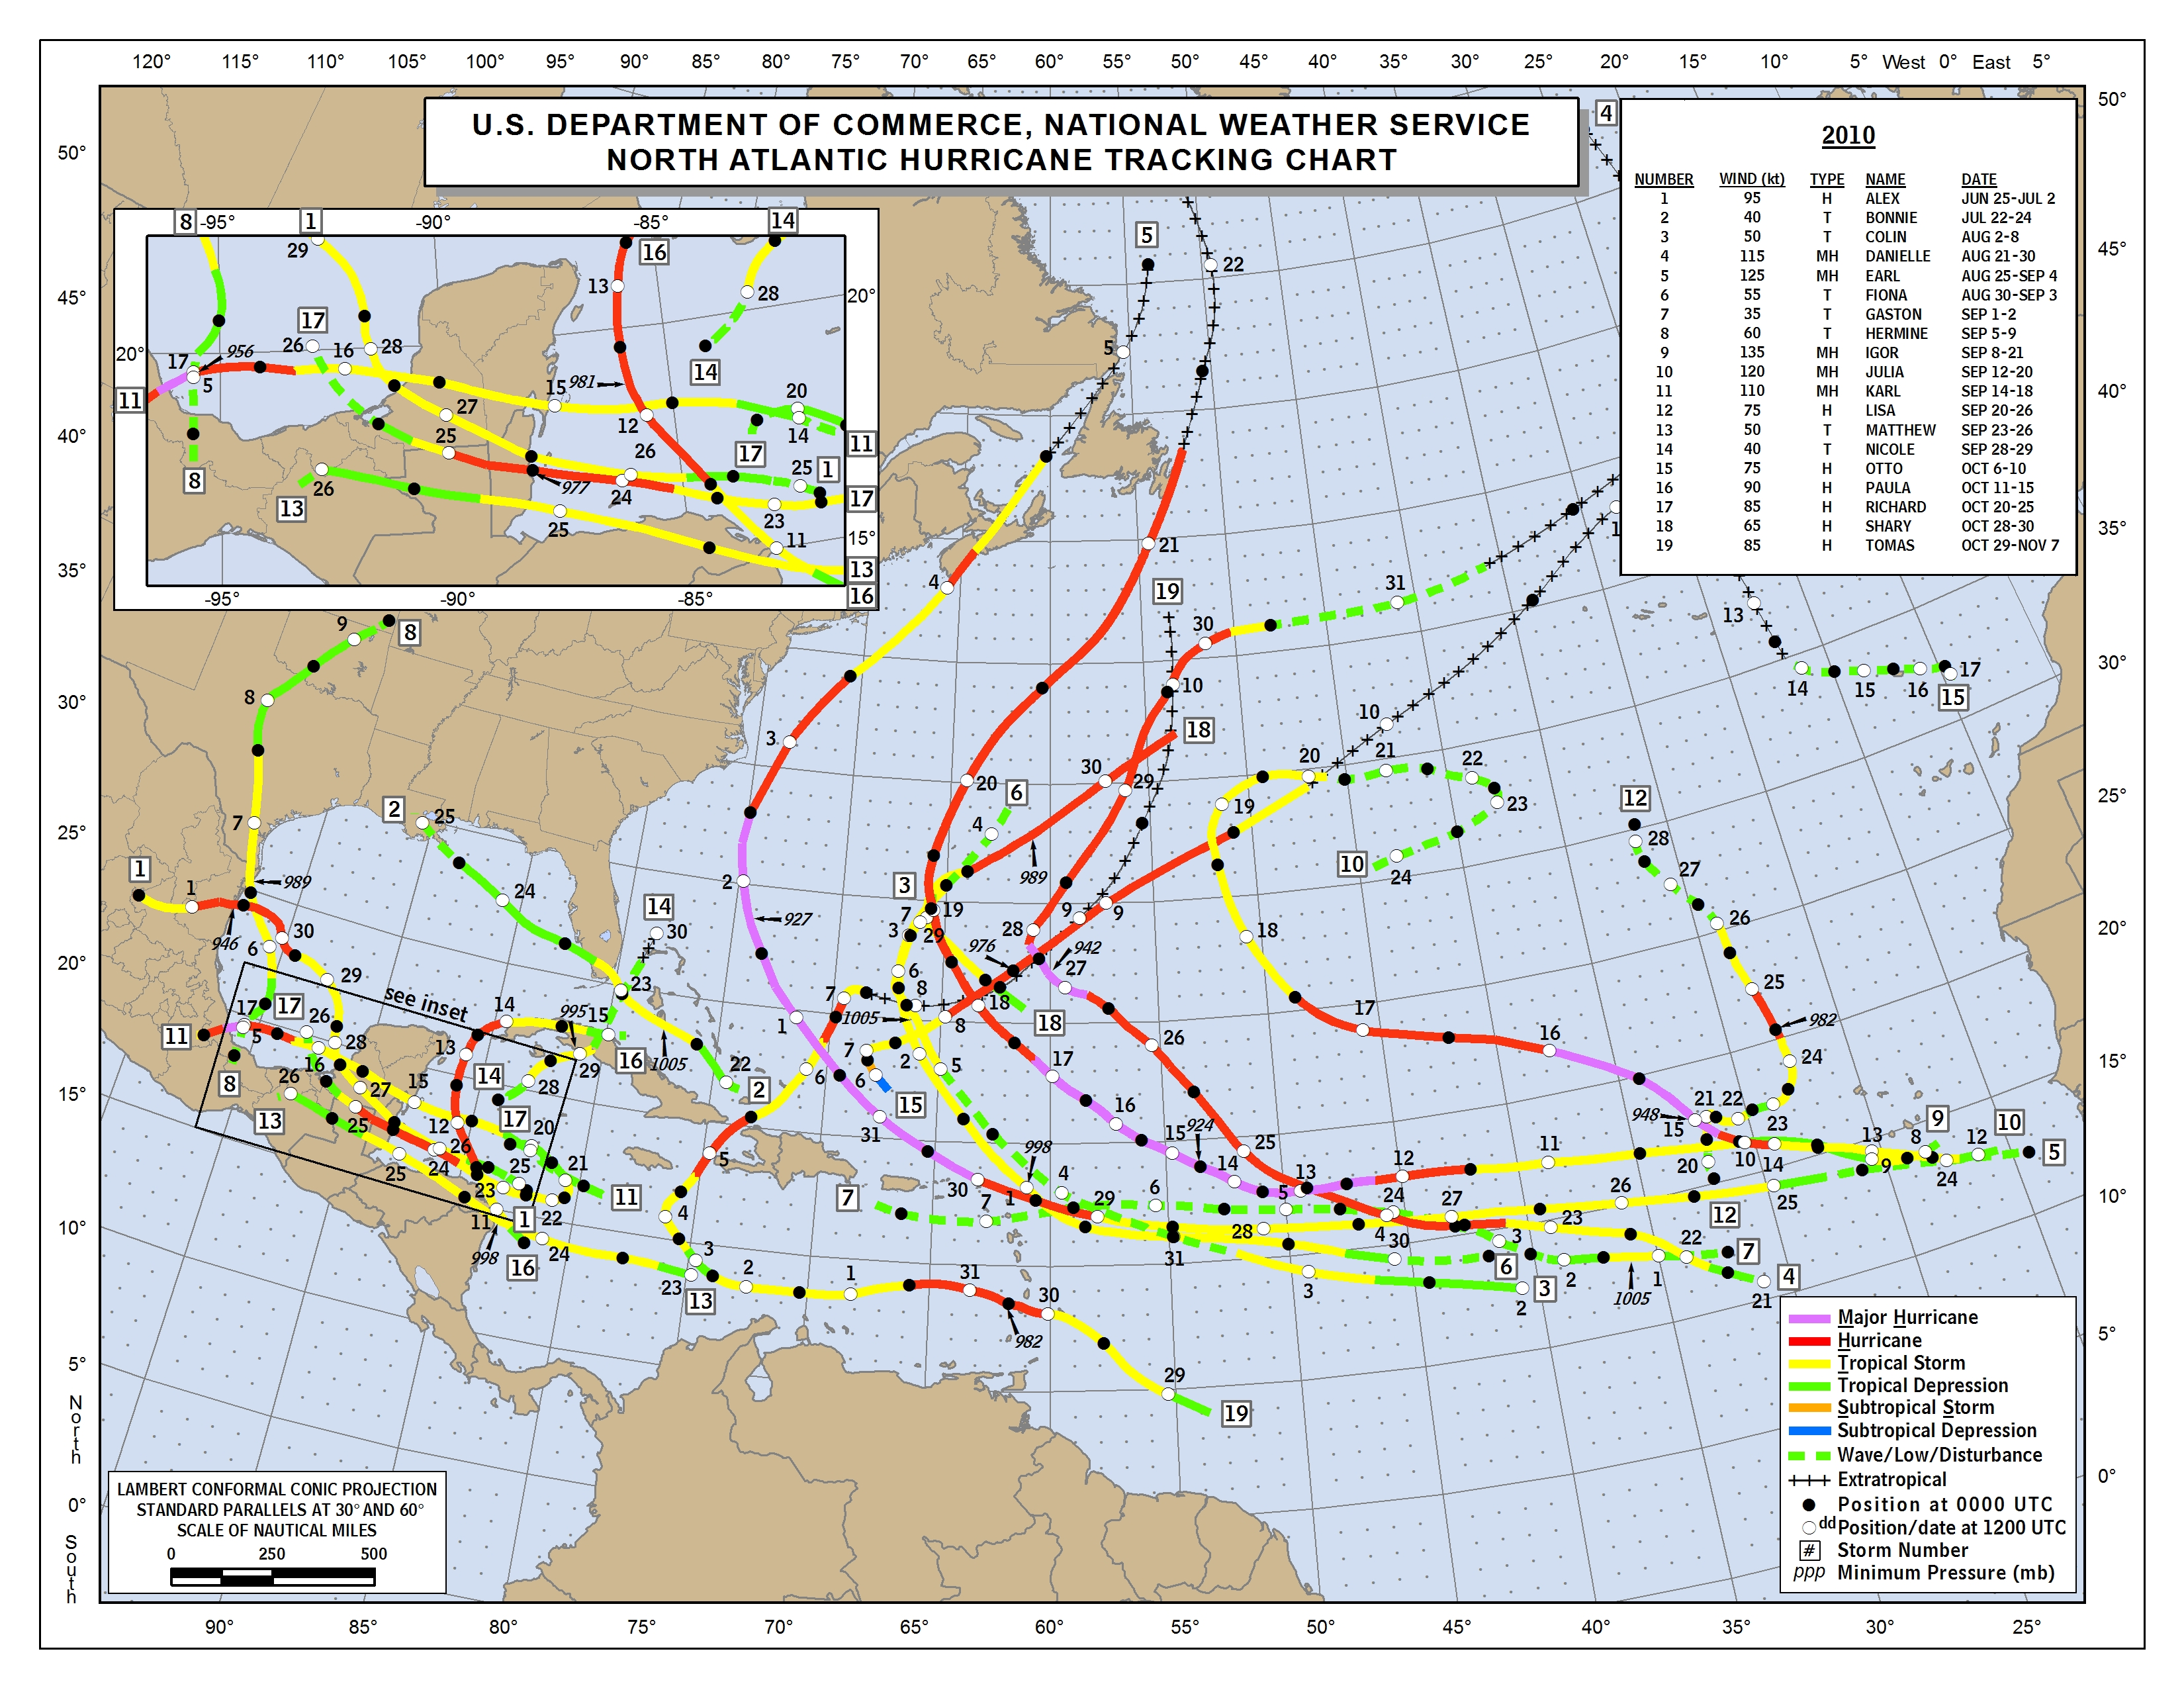
Uhm, dunno all those listed have wind speeds 35 kts or over.
I’ll keep looking
“Selected…”
I, for one, would not expect anything less than the very best cuts.
In the UK neck of the global woods, we’ve had the more or less usual run of winter depression systems (geddit!) coming over from the Atlantic, now given exotic sounding names like: storm “Gerrit, Henk, Isha etc”, it’s never storm Dave, storm Mike, or storm Steve. Even the names are a bit, well, a bit middle class. Will we get to storm Tarquin?
“…none of these significantly largest by far year 2023 average temperature anomaly reductions is addressed in the prominent NOAA’s “Selected Significant Climate Anomalies and Events” diagram”
I think it’s more than fair to say that the narrative is very much a work in progress.
I’m waiting for “Gentle Breeze Eric”…
You missed it… it was that gentle
The temperature scales are wrong. 0 degrees Celsius correspond to 32 degrees Fahrenheit.
Eduard: Nope, you are wrong. Before commenting in the future, read the heading on the graphs. The data are being presented as anomalies.
Regards,
Bob
PS: Welcome to WattsUpWithThat, Eduard.
?
A simple mistake, Eduard.
If you’re here to learn about climate, you’ve come to the right place
NOAA: the sandcastle attempting to stand against the incoming tide.
No doubt as to who will no longer be
standingin good standing at the end.The infographic quite plainly states which regions had above normal activity and which had below normal activity. You are tilting at windmills.
This is not how trends work. There will always be short-term variability expressed in the climate system, particularly for small regions, that does not indicate that there has been a change in the long-term underlying trend.
That variability goes both up and down. Guess which one gets the most attention!
Each region that Larry highlights exhibits a long-term warming trend. That is what deserves attention.
You didn’t answer the question. You just deflected. Typical.
The long term trend gets the attention, and the long term trend is upward. Does that answer your question?
You are talking about piddlingly short-term trends.
The longer term trend, say 3000 years, is DOWNWARDS, everywhere. !
Yes, it has warmed slightly since the LIA.
This an absolutely GOOD THING !!
He is playing with the downvote button again.
The measurement uncertainty is so wide that you can’t KNOW what the long term trend is!
A monkey is capable of taking 30 pairs of numbers and averaging them to obtain some average monthly value. Have you ever studied or had firsthand experience with meteorology? If an average temperature of 25.5°F can represent two different days [(H37, L14) and (H43, L8)], how do you not consider that lunacy?
Not just two different days. Two entirely different climates. If a metric can’t distinguish identifiable differences then it isn’t a good metric. Yet climate science stubbornly clings to using median daily temperature instead of moving to either degree-days or enthalpy.
It is not lunacy at all, if you observe the mean to be changing over time, it might inspire you to investigate the highs and lows to see how they are changing relative to each other. But knowing that change is occurring at all is unquestionably useful.
The mean can represent entirely different days with completely different highs and lows, so what observable change can be noted in that scenario? The highs and lows aren’t even the absolute lowest recordings; they are also hourly averages. The average also ignores crucial details about the day that contributed to the registered temperatures (snow, rain, urban heat island, UV intensity, sea breeze, etc.).
Observing a change in the mean daily temperature over time can let you track the changing seasons. Over longer periods it can let you track changes in the local climate. Convert the mean temperature into the mean anomaly and you can track changes in the regional or even global climate.
You don’t know, without additional investigation, whether a change in the low or high is contributing more to the change in the mean, but the fact that the mean is changing at all is valuable information.
Similarly, if I were to observe an increasing trend in the average height of American males over time, that information is useful. I don’t know from the average alone whether short males are getting tall or whether tall males are getting taller, but knowing there is a directional change happening is useful information.
This is all, like, stats 101 stuff.
Tracking the daily highs and lows would only be informative at a particular station (let’s not forget that near-surface weather station records are highly inhomogeneous); even then, no one thinks to consider the intricate interactions of various factors contributing to the temperature at a given time. Elements like precipitation, UV intensity, and other atmospheric conditions play crucial roles, and reducing this complexity to a single mean value can be misleading. Otherwise, temperature is highly dynamic and varies significantly even over short distances (see the attached image for example). In the case of seasons, the same average temperature can present itself in different seasons; an averaged temperature of 29.5°F, for example, could be the result of an extreme cold front in the spring or autumn, or just a ‘normal’ day in winter. The average ignores, and as a result, increases variance.
Comparing it to tracking the average height of American males is a poor analogy because human height is relatively stable and doesn’t undergo rapid and complex day-to-day changes like temperature. The range of temperature variations across different regions on Earth is, also, far more extensive.
Yes, this is one reason why anomalies are used for combining multiple station records.
Well, of course, a lot of people think about these things, but these things are weather. The thing we are tracking is climate change, which occurs over time periods of decades, where these phenomena are nothing more than background noise. The average anomaly is a perfectly suitable statistic for tracking change over time in the regional climate state. Even when tracking the seasons using an average daily temperature for a single station, the weather on a single day doesn’t really matter because you are tracking change over many successive days, weeks, and years, and the seasonal cycle will eventually win out over day to day variability.
“Yes, this is one reason why anomalies are used for combining multiple station records.”
Anomalies can’t tell you if it is summer or winter. So what good are they in combining multiple station records.
What is the variance of the data distribution associated with those combined station records? Are you ever going to answer that?
That anomalies eliminate seasonality is a feature, not a bug, if you are trying to track climate change.
Anomalies do *NOT* eliminate seasonality! The variance of temperature is different in winter than in summer. Therefore the anomalies are going to also have a different variance in winter and summer meaning the seasonality is *NOT* being eliminated!
You only *think* it’s being eliminated because you ignore the variance of the temperature distributions throughout the year!
And you call ignoring variance in a distribution *science*?
How different a temperature at a given location is from the norm is consistent across seasons, unless there is a change in the climate occurring. You seem to have a preternatural inability to grasp the concept of an anomaly.
“How different a temperature at a given location is from the norm is consistent across seasons, unless there is a change in the climate occurring. You seem to have a preternatural inability to grasp the concept of an anomaly.”
Malarky! That tells me you have NEVER, EVER calculated the variance of winter temps vs summer temps.
Winter temps have a wider variance meaning the anomalies will also have larger variance after the baseline is subtracted!
This has *NOTHING* to do with a change in the climate. Never has, never will.
*YOU* have a preternatural ability to ignore necessary statistical descriptors for a data distribution by just assuming them away.
Oop, Tim! We are talking about the anomaly. Gotta keep track of the conversation, bud.
In other words you have NEVER bother to calculate the variance of the anomalies.
You just ignore them.
Typical for a climate scientist.
What he’s saying is that anomalies ignore variance, and that’s why it increases. Are the details of what’s causing the temperature to increase or decrease not important? Isn’t it crucial to know the recent wind patterns or UV intensity in x location? Temperature is not some static property; it has various influences, all of which act dynamically, determining what the temperature is at a given time and place. The details are equally, if not more, important than the recorded temperature itself. It seems to me that anomalies are being tracked for people to blame CO2 for all changes on Earth, which is, of course, illogical.
The anomaly is the variance, the anomaly specifically measures how much a measurement at a given moment differs from the typical value. If there were no variance, all anomalies would take a constant value, and if there were a change in the climate at this location with zero variance, the anomalies would express as a straight sloped line.
All of the things you mention are important to understand, but it is also important to have a metric that generally tracks how the system is changing. The change in the global mean temperature anomaly can tell us if the planet is in an ice age, for instance. Obviously it is not the only metric we should consider, and scientists monitor a multitude of aspects of the climate system, from changes in sea ice and ice sheet cover, to sea level and ocean heat content, to changes in ecosystems. The global mean temperature anomaly just happens to be one single metric that is useful for its purpose.
Who doesn’t understand “stats 101” here? Check the mirror for the answer.
“ the anomaly specifically measures how much a measurement at a given moment differs from the typical value. “
Typical value? Does that typical value have a measurement uncertainty? In climate science the measurement uncertainty of the average is assumed to be zero, the average is 100% accurate.
Try telling that to a Boeing engineer today.
“If there were no variance, all anomalies would take a constant value”
NO! They would not. The anomaly today can easily be +1C and tomorrow it could be -1C! That’s not a constant value. Those two values contribute to the variance of the data set, they may even define the total range of values the anomaly has taken on over time! The *real* issue is what is the measurement uncertainty of those aomalies? If it +/- 0.5C then their average could just as easily be +1.5C or +0.5C and -0.5C or -1.5C!
The total range could be as large as 3C or as small as 1C. YOU DON’T KNOW! It’s all part of the GREAT UNKNOWN and it’s metric is the measurement uncertainty!
“The change in the global mean temperature anomaly can tell us if the planet is in an ice age, for instance.”
The anomalies can’t tell you if you are in Las Vegas or Miami! or Rio de Janeiro! How can they tell you if we are in an ice age?
“The global mean temperature anomaly just happens to be one single metric that is useful for its purpose.”
It is *NOT* fit-for-purpose because it can’t distinguish one climate from another!
Anomalies are not a measure of variance. Anomalies are a rate of change, like going from 50 mph to 60 mph. That is not the variance in speed of travel. It is more correctly called a ΔT, a rate of change. Temperature anomalies should be dimensioned as “ΔT/T·time” in order to properly compare them when averaging.
Here is an example. You are a car owner in NASCAR. You are at a track testing your two cars. You want to know how quickly they can accelerate down a straightaway. You measure each and find one can accelerate at 20 mph/second. The other one at 10 mph/sec.
Would you choose the first one as your main car because it can accelerate twice as fast?
Tell what another factor might be that is important, and we’ll see if you have a clue.
Now, for temperature. Let’s say Fargo, ND has a monthly anomaly of +1F in July. In the same July, the Antarctic has an anomaly of +1.
On a relative basis does an anomaly of +1 have the same effect in both places?
According to the World Meteorological Organization, climate is weather averaged over multiple decades. So, you can’t dismiss these factors as weather; they affect the recorded measurements, making them impossible to ignore. If you want to track overall energy intake, you would have to find a way to separate the noise from the measurement, but the noise (the weather itself) contributes to the measurement. The factors that go into the recorded temperatures interact dynamically, so there’s no way to separate them. Every single measurement at a weather station has non-random factors that contribute to the temperature at a given time. Would you consider the morning and evening sunrise noise? During the evening, as the sun sets, the thermometer can experience cooling effects (radiative heat loss), and if there are clear skies, the temperature can drop more rapidly.
Would you consider snow depth or snowfall from an ongoing blizzard noise? Would you consider an averaged temperature of 46.0°F at a thermometer near a cave the same as an averaged temperature of 46.0°F at a thermometer near the top of the mountain?
———————-
Can you explain your reasoning as to why you think this response is an effective rebuttal to:
We are talking about the shortcomings of the average and why it isn’t representative of larger regions.
When you average together many months or years of data, you cancel out a lot of the random noise – what you are left with is the climate signal. So, in fact, you don’t care at all about any particular weather event, what you care about is the long term underlying signal. This process of removing random noise by taking many observations is a standard part of statistical analysis.
Any given observation is a combination of underlying signal + random variability + measurement error. We don’t care about the last two, so we don’t care about one single day, we want to observe many, many days. The random parts go away when we do this and we are left with the part we are interested in – the climate signal.
We don’t care about these differences – that’s one reason why the anomaly makes sense. We care about the trend, and as long as we aren’t introducing a spurious trend by combining the two records (by using anomalies), then we don’t care at all about their difference in elevation.
“When you average together many months or years of data, you cancel out a lot of the random noise – what you are left with is the climate signal.”
Malarky! This *IS* the climate science meme: all measurement uncertainty, including natural variation, is random, Gaussian, and cancels. But this is never, AND i MEAN *NEVER*, justified by climate science in any manner!
As Walter points out, this isn’t noise, It’s part of the signal.
You aren’t even using an AVERAGE. It’s a median value of a multi-modal distribution. And it tells you nothing about the actual signal which is the entire distribution, including what you consider to be “noise”.
“So, in fact, you don’t care at all about any particular weather event, what you care about is the long term underlying signal.”
Like Walter says, the weather event *IS* the signal. It is the WEATHER that determines the climate, not the median daily temperature. The median daily temperature can’t distinguish between the climate in Las Vegas and Miami, or Port Barrow, AK and Lincoln, NE, or any other combination of locations!
“We don’t care about these differences”
Who is “we”? Climate scientists with a monied interest in global warming? Who wouldn’t know the variance of a data distribution from a hole in the ground?
The anomaly makes NO sense. If it can’t distinguish between climates then it gives you *NO* information about the global climate. And the global climate is *NOT* determined by the daily median value of a multi-modal temperature distribution.
It’s like teaching a monkey how to use tools.
If all you have is a hammer, then every problem is a nail!
That is not what I said or implied, it is simply the windmill that you are forever tilting against. The random component of error is random, non-random error is nonrandom and does not cancel with greater numbers of observations. Whether it was 3.5 degrees in Boston on Friday, Janaury 26, 2024 and whether it was 3.5 degrees or 4 degrees or 3 degrees or 0 degrees on Thursday, January 26, 2023 is weather and is, for all intents and purposes, random. If there is a change in the mean temperature on January 26ths in Boston over many years then that is not random, it is a shift in the climate, and that is the thing we want to track.
The weather is a combination of signal + noise + error, and we don’t care about the last two, so we reduce them by making many observations over a long time.
“The random component of error is random, non-random error is nonrandom and does not cancel with greater numbers of observations. “
u(total) = u(random) + u(systematic)
Do you know the true value for the temperature at the Forbes AFB measurement device? If not, how do you know the systematic bias it has? If you don’t know the systematic bias then how do you know what the random component is?
As usual, you totally ignore the fact that no one versed in up-to-date metrology uses “error” any longer. The use of error implies you know the true value. How do you know the true value?
The requirement for cancellation of random error requires:
Temperature measurements are:
The temperature data meets NONE of the requirements for assuming cancellation of random errors. NONE!
“weather and is, for all intents and purposes, random.”
You just argued in another message that weather is *NOT* random, that it varies by season! Pick one and stick with it!
“ If there is a change in the mean temperature on January 26ths in Boston over many years then that is not random, it is a shift in the climate, and that is the thing we want to track.”
Malarky! You simply have no way of KNOWING this. You don’t know if one resistor on the substrate of the bridge reading the value of the PTR has changed value, or if someone planted fescue grass instead of Bermuda grass under the measurement station, or if a mud dauber wasp has built a nest in the air intake of the station or if a sandstorm scoured away some of the paint on the station screen, or on and on and on ……
THESE ARE WHAT MEASUREMENT UNCERTAINTY IS MEANT TO ALLOW FOR!
I’ll repeat again, you and climate science want us all to believe
“that all measurement uncertainty is random, Gaussian, and cancels leaving the stated measurement value not as an estimate but as a 100% accurate measurement over time”.
You don’t need to know what the random component of the error is to know that it is reduced by making numerous observations. You can only identify the systematic bias by analyzing the conditions that lead to systematic bias in station sites.
That is, you can reduce u(total) by reducing u(random) by taking many measurements. You can only reduce u(systematic) through investigation and analysis, but you don’t need to know u(total) to identify component of u(systematic).
Of course it does, for a single station in a single location, you very much can assume that a single measurement device is taking multiple measurements of the same thing. You can also assume that daily variance in temperature is orders of magnitude greater than the sources of random measurement error in the device, so the priority is to take multiple measurements over many days to reduce random noise in the dataset.
Pretty silly to claim you have no way of assessing systematic bias in stations when you’re on a website that literally rose to prominence due to an effort to identify systematic station biases.
You enclose this statement in quotation marks as though someone other than you has ever said it. I think you should speak to a doctor about the hallucinations you seem to be having.
“You don’t need to know what the random component of the error is to know that it is reduced by making numerous observations. “
Get a pad of legal paper and write this out 1000 times. Maybe it will sink in.
In order to assume cancellation of random errors it is required:
It is also required that the measurement distribution be Gaussian.
Tmax and Tmin are single measurements of different things even if measured by the same device and the measurement environments are not the same for both so they don’t meet the repeatability condition.
Go spend some time writing these requirements out 1000 times. We’ll wait for you to return.
“That is, you can reduce u(total) by reducing u(random) by taking many measurements.”
No, you can’t. Because you are not measuring the same thing multiple times under repeatability conditions.
“You can only reduce u(systematic) through investigation and analysis, but you don’t need to know u(total) to identify component of u(systematic).”
Does the measurement uncertainty of ASOS stations being +/- 0.3C tell you what the random component of uncertainty is? What the systematic component of uncertainty is? You *know* u(total), what are the component values? Is u(random) the same for every station? Is u(systematic) the same for every station? How about for daytime vs nighttime measurements? Is u(total) Gaussian for every station?
You continue to make unjustified assumptions and try to justify them with handwaving! The meme that more readings means a more accurate average is just garbage. Especially when combining readings from different measuring devices!
“Pretty silly to claim you have no way of assessing systematic bias in stations when you’re on a website that literally rose to prominence due to an effort to identify systematic station biases.”
Give it a BREAK! Identifying that systematic biases exist is a far cry from determining their VALUE! You are just throwing crap against the wall now.
“You enclose this statement in quotation marks as though someone other than you has ever said it. I think you should speak to a doctor about the hallucinations you seem to be having.”
You say it every single time you make a statement that “random error cancels”.
AJ: “You don’t need to know what the random component of the error is to know that it is reduced by making numerous observations.”
AJ: “That is, you can reduce u(total) by reducing u(random) by taking many measurements.”
AJ: “Of course it does, for a single station in a single location, you very much can assume that a single measurement device is taking multiple measurements of the same thing.”
Tmax and Tmin are the same thing? Only a climate scientist would say this! Both humidity and pressure play a part in what the temperature is. Both can change drastically between Tmax and Tmin. You are *NOT* measuring the same thing. You are *NOT* measuring under the same environmental conditions.
Climate science supposedly uses temperature as a proxy for enthalpy. And then ignores the fact that a change in enthalpy can change the temperature!
“You can also assume that daily variance in temperature is orders of magnitude greater than the sources of random measurement error in the device, so the priority is to take multiple measurements over many days to reduce random noise in the dataset.”
But you are *still* measuring different things! Have you *ever* read Possolo’s TN1900, Example 2? Can you list out the assumptions he had to make in that example? Do you understand why he used Tmax as the measurand and not Tmedian?
Again, climate is weather over time. If you eliminate weather then you lose the ability to distinguish climate. It’s why temperature is such as poor proxy for enthalpy. Why do you continue to refuse why Las Vegas and Miami can have the same Tmedian value but vastly different climates? How does Tmedian tell you *anything* meaningful?
They are not measurements of different things, they are measurements of air temperature at a fixed distance from the ground, made using the same device. Your whole philosophy about this is just stupid, according to your position, we can’t measure average streamflow because each molecule of water passing by the current profiler produces a measurement of a distinct entity that can’t be compared to any other molecule of water. It’s asinine. I think you know deep down it’s dumb.
Air temperature measurements are a time series—you get exactly one chance to capture a sample before it is gone—FOREVER. N == one!
By the same token, so are streamgage measurements, but I’m sure you’re not silly enough to try and argue that it is impossible to measure average stream flow using these instruments.
A strawman non sequitur is all you can come up with?
Pathetic.
It is impossible to cancel random errors in measuring streamflow by measuring two different streams using two different gauges and taking single measurements at two different times!
Yet that is what you want us to believe about temperature measurements – you can cancel random error by measuring two different streams (two different volumes of air) using two different gauges (different thermometers) and taking the measurements at two different points in time (Tmax vs Tmin).
“They are not measurements of different things, they are measurements of air temperature at a fixed distance from the ground, made using the same device.”
Your willful ignorance has reached a new height! Unfreakingbelievable.
That’s like saying that measuring the length of two different 2″x4″ boards is measuring the same thing – MEASURING A BOARD!
“Your whole philosophy about this is just stupid, according to your position, we can’t measure average streamflow because each molecule of water passing by the current profiler produces a measurement of a distinct entity that can’t be compared to any other molecule of water. It’s asinine. “
You can’t even get this straight! You don’t measure water flow at the molecule level, at least usually! You are as bad as your compatriots – no experience in physical science at all!
My guess is that you know absolutely nothing about the quantum mechanics of how a PN junction works in a diode or transistor. You don’t measure each electron, you measure at the macro level! My guess is that you don’t even know the difference between the observer effect and the uncertainty principle! Or you wouldn’t have made up such an inane comparison!
If you want to cancel random error in the reading of a tape measure used to measure A single 2″x4″ board you take multiple readings OF THAT SINGLE BOARD using THE SAME TAPE MEASURE EACH TIME, and you take them CLOSE TOGETHER IN TIME.
You can’t cancel random measurement error by taking single measurements of every 2″x4″ board in the lumber yard! But that is what temperature measuring is – measuring the characteristics of a volume of air that changes from second to second making each volume into a separate board! Even worse the measurements can be several hours apart in time meaning different environments as well as different boards. And to top it all off you want us to believe that you can cancel random errors by using two different tape measures!
They are measurements of different things. As many times as NIST TN 1900 Example 2 has been mentioned here along with the GUM, one would expect you to have a better idea of how to handle measurement uncertainty.
TN 1900 shows that when measuring different variations of a measurand (monthly average temperatures) one must evaluate the variance in the data as one component of uncertainty “u”. One should notice that this example excludes both systematic uncertainty and measurement uncertainty. In the real world, these would both be added to the total uncertainty. The GUM addresses this in F.1.1.2. I’ll show it here in case you are unfamiliar with it.
In case you are unsure of what this means. It discusses sampling of a measurand such as daily temperatures over a month’s time. TN 1900 addresses this by finding the variance of the data, modifying it the Standard Error of the Mean, and expanding it to achieve a 95% confidence interval.
The latter part of the GUM statement says to add this the observed variance of a single sample, i.e., the measurement uncertainty of a single measurement determined by multiple measurements of the same thing, by the same device, by the same person, over a short period of time.
Since NOAA has specified a Type B uncertainty for ASOS stations as ± 1.8° F, this should be added to the uncertainty determined from the data. This would make the TN 1900 example have a measurement uncertainty of about ± 3.6° F,
This is a big deal for pilots of heavy aircraft. A 2° C change is equivalent to a 1000 foot change in altitude. This may not sound like much, but on a maximum load in a 747 it does make a difference.
You may have some training in statistics but you don’t appear to have much in making measurements and assessing their uncertainty. Could you tell us what senior level lab courses in physical sciences like physics, chemistry, or electrical you have taken?
Actually, ASOS uncertainty is ±1.8° F.
USCRN is ±0.3° C or ±0.54° F.
Random error in a given observation means the likelihood of positive errors would be equal to the likelihood of negative errors. In the case of measuring temperature, the errors are asymmetrical; if a thermometer is placed in an area consistently exposed to direct sunlight, there’s likely to be a consistent positive bias. The errors also interact with each other, meaning that any measurement has its own context that separates it apart from another. Regarding the climate system, it’s highly non-linear, which means that small changes can lead to disproportionately large outcomes somewhere else. There’s feedback loops too.
Nonrandom error, like siting issues, are not addressed by taking many observations, the way to do that is with the adjustments the people on the site spent inordinate amounts of time railing against. Random weather noise is absolutely reduced by taking many observations over a long period. The mental effort you spend denying this for… no tangible reason that I can discern, is astonishing.
You STILL haven’t bothered to read Hubbard and Lin on station adjustments have you? Why not?
Adjustments can ONLY be made accurately on a station-by-station basis, require an on-site calibration, and can’t be applied to past data.
Weather is not noise – IT IS PART OF THE SIGNAL! You can’t just average it away!
You can disagree with the suite of adjustments applied, that’s fine. We will all look forward to your publican(s) on the subject after they pass peer review. The point is that systematic bias is not being ignored by mainstream climate science.
They’ve already been peer reviewed and published! The article authors are Hubbard and Lin. Go look it up!
Or don’t. We all know you would rather remain willfully ignorant on the subject!
And systematic uncertainty *is* being ignored by mainstream climate science when they use the standard deviation of the sample means as a measure of the accuracy of the mean. The SEM can be 0 (zeor) while being wildly inaccurate. And climate science will never know because they ignore the accuracy metric for the average of a distribution.
Heck, climate science can’t even provide the variance of the data they use! How then can they judge the uncertainty of the average?
They don’t do this. The SEM provides an estimate of the precision of the mean, no one treats it differently.
Malarky! Dividing the average value by the square root of the sample size is endemic in climate science in order to come up a value for the certainty of the average. By definition this is the SEM, it gives the interval in which the average might lie but it does *NOT* say anything about the accuracy of that average.
Whenever you see the words “confidence interval”, it is speaking of the SEM. That is what GISS calculates for their GISTEMP data. It’s how they get such a small uncertainty interval and high confidence value.
Here is what GISS says about station uncertainty:
“The random uncertainties can be significant for a single station but comprise a very small amount of the global LSAT uncertainty to the extent that they are independent and randomly distributed. Their impact is reduced when looking at the average of thousands of stations.
The major source of station uncertainty is due to systematic, artificial changes in the mean of station time series due to changes in observational methodologies. These station records need to be homogenized or corrected to better reflect the evolution of temperature. The homogenization process is a difficult, but necessary statistical problem that corrects for important issues albeit with significant uncertainty for both global and local temperature estimates.” (bolding mine, tpg)
Not a single proof is provided that the data distribution is Gaussian. If it isn’t then assuming an independent and random distribution of error that cancels cannot be justified!
Nor does GISS recognize that station systematic uncertainty can be due to calibration drift that is *NOT* amenable to identification using statistical analysis. Homogenizing one station with measurements from another station assumes the second station has no systematic bias and totally violates what Hubbard and Lin found clear back in 2002! All the homogenization does is spread systematic bias around which contaminates *other* stations.
It is pretty apparent to me, and it is becoming more obvious to more and more people, that nothing in climate science follows well-known metrology principles. It’s a bunch of statisticians and computer programmers who don’t understand the GREAT UNKNOWN and think they can correct everything using statistics. There’s not a single practicing engineer on this planet that believes that. The biggest surprise of all is that climate science has gotten by with this statistical nonsense for so long without being called on it!
A straw man argument with no significance to the current argument. It is an argumentative fallacy.
Try to stay on task and discuss the issue.
Why do you think NOAA has supplied a ± 1.8° F Type B uncertainty for ASOS stations? Do you think this uncertainty cancels when you average two or more readings from different things. If so, you need to go study the GUM some more.
Short-term weather events can have asymmetric effects on temperature. A sudden rainstorm can lead to a rapid drop in temperature, while the dissipation of clouds after a storm could result in a quick temperature rise. Warm and cold fronts bring directional influence; a cold front passing through will lead to a drop in temperature, while a warm front will lead to a rise in temperature. It’s hard to classify what is truly random in the context of a temperature measurement at a given place.
In the case of a weather station located near Anchorage, we know that Anchorage’s climate is much milder and less variable than inland Alaska due to its proximity to the North Pacific Ocean and the Gulf of Alaska. During the winter, the ocean releases stored heat, preventing extreme cold, while in the summer, it acts as a natural air conditioner, preventing extreme heat. This would be a systematic bias, but it’s inseparable from the measurement because it contributes to the measurement combined with a multitude of other factors.
Consider another station located in Fairbanks, Alaska. The area is continental and is located near the Alaska Range, which can cause temperature inversions, act as a geographical barrier, and impact the movement of air masses, precipitation patterns, and temperature distributions. In short, a different but inseparable systematic bias. You can’t quantitatively state the effect the mountains have on the recorded temperature readings because each temperature reading will have its own context. How can you average those two locations together? This is the way our planet works! It’s bizarre how modern-day climate science assumptions do not reflect real-world meteorology conditions. Seems like you are the one in denial.
Nonrandom error, like siting issues, are not addressed by taking many observations, the way to do that is with the adjustments the people on the site spent inordinate amounts of time railing against.
It’s not something you can just adjust. How does an aging thermometer interact with consistent exposure to sunlight? It’s not the same as a brand new thermometer would. How does an aging thermometer interact with all the weather phenomena, as opposed to a new thermometer? These questions don’t get answered. Yet, people think it’s possible to fix that bias; it interacts with the multitude of other variables. I can’t stress multitude of other variables enough to you!
****
No event in the whole universe is technically random, the nature of it is simply so chaotic that we can treat it as random for all practical applications. We don’t care about these singular, quasi-random weather events if we are assessing how much the climate state has changed. This is the point, and nothing in your diatribe detracts from it.
Of course it is. How else would you account for it? You study how the biasing effect impacts the station record, and you devise an approach for removing it. You publish your method so other people can read about it, and you publish the results of your analysis. If someone thinks they have a better way to do it or if they think there is something wrong with your method, they can publish their own. That’s science.
Your argument is beginning to distill down to, “it all feels too complicated for me.” Which is a personal issue for you, it’s not something that bothers actual scientists.
The set of which you are not a member.
In observational analysis, the characterization of a random error are:
The weather is unpredictable, but temperature measurements exhibits characteristics that deviate from a normal distribution, and the temperature distribution varies in each region. The weather also does not demonstrate a balanced likelihood of positive and negative influence; it’s asymmetrical, as I mentioned earlier in my ‘diatribe’. So, random weather variability can’t be classified as random error. If you measure the same thing multiple times, your measurements will cluster around the ‘true value,’ which would be the overall energy uptake. In a temperature measurement, what would be the true value? ‘Random weather variability’ also interacts with conditions at the near surface at that field site that are systematic; you can’t quantify and separate these errors from the true value. It’s completely lost within the noise. There will always be noise, and it will always be distinct in each measurement.
You just deflected from my main point, as usual. Of course, I didn’t mean that no one can try, no matter how nonsensical. How can you remove its effect if it manifests itself differently in every measurement?
Once you understand that not a single person here defending the GAT is a physical scientist, an engineer, or a craftsman/machinest/surveyor/etc the insane assertions they make become more understandable.
They are blackboard statisticians who have never had to certify that a bridge will carry a certain load depending on the measurement uncertainty of the shear strength of the beams making up the bridge. All measurement uncertainty is random, Gaussian, and cancels. Therefore the measurement uncertainty becomes Savg/sqrt(N). Just make more measurements and the average will get more and more precise.
“No event in the whole universe is technically random, the nature of it is simply so chaotic that we can treat it as random for all practical applications. “
That’s irrational. It’s no better than saying the weather is an Act of God, an infrequent miracle!
From Bevington, “Data Reduction and Error Analysis”, 3rd edition, Chapter 1:
“The accuracy of an experiment, as we have defined it, is generally dependent on how well we can control or compensate for sysstematic errors, errors that will make our results different from the “true” values with reproducible discrepancies. Errors of this type are not easy to detect and not easily studied by statistical analysis.”
Taylor, “An Introduction to Error Analysis”, 2nd Ed, Chapter 4:
“As noted before, not all types of experimental uncertainty can be assessed by statistical analysis based on repeated measurements. For this reason, uncertainties are classified into two groups, the random uncertainties which can be treated statistically, and the systematic uncertainties, which cannot”.
If you don’t know the systematic uncertainty component then you can’t know the random component either.
Are you now going to tell us that these two stalwarts of metrology don’t know what they are talking about?
Climate science basically says to ignore anything that might quantify uncertainty. Ignore variance of the data, it’s not important. Ignore systematic bias, we’ll just assume it away with some guessed at adjustments.
It truly is garbage in, garbage out. Ask any Boeing engineer today if you can just assume all measurement uncertainty is random, Gaussian, and cancels.
Here is a graph of temperatures I made several years ago. I was investigating the Central Limit Theory at the time.
Examine the difference in the variances of the stations that were scattered about the U.S. Treating these as 60 samples of size 6 does give a Gaussian shape that can be used to estimated the mean. The standard deviation of the sample means (SDOM) likewise gives a smaller interval of where the mean may lay. However, The value of the uncertainty in measurement is defined in NIST TN 1900. The variance in all the measurements should be used to calculate the measurement uncertainty of the mean value and is quite large when compared to the SDOM.
This also shows that the distributions of station temperatures can not be considered to be Gaussian whereby averaging multiple stations will cancel errors.
If you look at the Santa Barbara distribution of temperatures, you will see an almost perfect normal distribution. That is exactly what you are saying about the Alaska stations.
Climate science don’t do histograms.
or variance
or skewness
or kurtosis
or interquartile ranges
or measurement uncertainty
Another purveyor of Fake Data, just like Mickey Mann.
Calibration drift is not usually random. Electronic components change value as they age and typically do so in the same direction. So it can’t cancel.
Nor can you just assume natural variation is random and cancels as AlanJ and climate science does. Natural variation is PART OF THE SIGNAL. If you don’t account for it and just try to “assume” it away you are losing part of the signal, a SIGNIFICANT part.
u(total) = u(random) + u(systematic)
You can’t assume that the random part cancels since you can only know what the total measurement uncertainty is. If you don’t know the uncertainty component values then you don’t know what cancels and what doesn’t.
AlanJ makes the common mistake so endemic in climate science, measurement uncertainty is *NOT ERROR*. It is an interval which contains the values it would be reasonable to assign to the measurand. You can only identify “error” if you know the true value and the true value is part of the GREAT UNKNOWN.
It’s why the universally accepted JCGM has moved away from using “true value +/- error” to using “estimated value +/- measurement uncertainty”. Some in science are not even using estimated vale any longer and are just expressing the measurement uncertainty interval, e.g. 15.2C to 15.7C, so as to not confuse those unwilling to move to the new concept in metrology – those like AlanJ and those in climate science.
Oops, I never said it could. You’ve gone off and hallucinated again. Gotta be careful with that, Tim.
No one assumes this, nonrandom signals don’t cancel, and there are non-random multi-decadal signals in the climate system that are present in long term surface temperature records. This is not a problem, we want to see such behavior. What we don’t want is the random element of the weather, which we reduce by taking many measurements.
This is completely false and based on nothing, you’ve just made it up whole cloth. It is absolutely possible to identify error without knowing the “true” value.
“What we don’t want is the random element of the weather, which we reduce by taking many measurements.”
Weather is not random. Climate is weather over a long period. Weather is *the* determining factor is climate.
When you do an average you lose the ability to determine climate. It’s why the “average” for Las Vegas and Miami can be the same while their climates are totally different. A metric for climate that can’t differentiate between climates is useless.
u(total) = u(random) + u(systematic)
Every text on metrology is going to be based on that simple equation. There *is* a reason why “u” is used so often to denote uncertainty – because the values are Unknown!
If you don’t know the values of the components, u(random) and u(systematic) then how can you assume one cancels?
I’ll repeat it again:
Cancellation of random measurement errors require:
Please elucidate for us just how the temperature measurements of Tmax and Tmin at two different locations meet these requirements.
My guess is that you will just ignore this request, prove me wrong.
The metric is for climate change, we are not trying to define different climate zones by using the temperature anomaly – there are entire classification systems dedicated to this purpose – we are trying to track if the mean state of the climate in these regions and around the world is changing. This is the point you fail to comprehend over and over and over.
Tim, we really must start at a basic level of understanding if we are to have a productive conversation. Tmax and Tmin are measured by the same device in a single location.
“The metric is for climate change, we are not trying to define different climate zones by using the temperature anomaly – there are entire classification systems dedicated to this purpose – we are trying to track if the mean state of the climate in these regions and around the world is changing. This is the point you fail to comprehend over and over and over.”
Again, if you can’t differentiate different climates with the metric then how do you know if the climate is changing?
You are still stuck trying to clam that some hokey Tavg is *climate*. Temperature, especially a hokey median from a multi-modal distribution, is climate. It isn’t. If it was you could tell the difference between San Diego and Ramona, CA based solely on their respective “average” temperature. The actual truth is that you can’t!
As Walter has tried to explain to you, climate is WEATHER, not median temperature. That’s as true for anomalies as it is for the absolute temps. If an anomaly can’t distinguish between summer and winter temps having different variances, then how can the anomalies tell you anything about climate? And it is *YOU* that are saying the anomalies in Lincoln, NE and Rio de Janeiro can tell you the difference in climates between the two locations in December, not me.
Nope, I’m saying that changes in the Tavg anomaly over long periods of time indicate a change in the climate. That’s it, that’s all, nothing more, nothing less. Nobody uses the global mean temperature anomaly to investigate regional or local climate change impacts.
You don’t know this.
Then GAT is a meaningless number that tells nothing about “the climate”.
Tavg can’t tell you the difference in climate between Las Vegas and Miami. Neither can the anomaly. The anomaly at both can be the same and yet the climates are different. Does the anomaly in Las Vegas tell you about the climate change Miami might be seeing?
What you are spouting is religious dogma taken on faith.
“IT’S A MIRACLE I TELL YOU!”
Again, a change in the rate of change in temperature is not indicative of a change in climate.
Worse, there is a dichotomy between the GAT as an anomaly and the multitude of local and regional locations with little to no warming over a long period of time. How do you explain that?
Lastly, what we are trying to show you is that the claimed anomalies are so far within the uncertainty of measurement that you simply can not make a conclusion. To say that a temperature has increased 0.01 degrees means you must have measurements with a resolution and accuracy to allow a determination of this small value. Temperature measurements nowhere, not even in USCRN have the resolution nor the measurement uncertainty to allow this determination. You are trying to convince folks that averaging different things can provide increased resolution. You need to talk to a machinist and see if they agree that you can do that. You have no concept of tolerances and quality control. These folks know what you are purveying would never withstand in the real world.
Now you are down to just posting lies.
He just gets wilder and wilder with his insane assertions. The difference between a measured value and the “true value” is known as a discrepancy. The measured value is “true value + error” (error may be plus or minus). MV = TV + Err. That means Err = MV – TV. If you don’t know TV then you simply cannot know Err.
When the hand waving starts, you know they are flailing.
The random element of the weather determines the uncertainty of what you are calculating. CLIMATE is the AVERAGE of WEATHER over a long period of time. If you are not examining the entire variance of the weather in climate, then you can’t call yourself a climate scientist! You are merely a statistician whose main goal in life is to obtain a mean value of some data regardless of the signal actually signifies.
Removing the variance (amplitude) of a signal by declaring the different amplitude values as “noise” is attempting to use signal processing language to justify ignoring what the signal is telling you. Do you really think that signal processing is all about limiting the amplitude variations in a signal?
What you are doing is defining the “signal” as the mean value of the signal. That is not “removing” noise!
Every time you try to make excuses you only amplify what you don’t know. You would do better to just admit you have no training in making measurements that must stand in judgement of legal review.
+100
“ If you want to track overall energy intake, you would have to find a way to separate the noise from the measurement, but the noise (the weather itself) contributes to the measurement. “
Somehow climate scientists simply don’t understand this. It’s like a AM radio carrier signal modulated by a time-varying signal. To a climate scientist the modulating signal is noise and only the average frequency of the signal, i.e. the carrier frequency, is of interest.
It’s ignorance of the worst kind because its willful.
I think another factor that plays into it is time. Weather does not operate synchronously with the human calendar; we know that time-of-observation bias exists. Who’s to say the observational period 24:00 – 23:59 isn’t a bias itself? Some days have mornings as the warmest part of the day because of a passing cold front. A ‘once-in-a-century’ heatwave is only termed as such due to the relatively short record of measurements; nothing suggests that these so-called ‘once-in-a-century’ heatwaves can’t occur more or less frequently.
This is why the integrative degree-day metric has always been attractive for me. It will catch, assuming the measurements have sufficient granularity, such changes and will be reflected in the metric.
Spikes like heat waves tend to get damped as far as significance when the entire annual degree-day calculation is added up. That doesn’t happen when a week-long heat wave can have a large impact on daily median values which, in turn, have a large impact on a monthly average value.
Not at all uncommon for my location for the daily high to occur one second after midnight when a deep cold front is passing through.
“in the average height of American males “
Another nonsense analJ-ogy.
“Observing a change in the mean daily temperature over time can let you track the changing seasons.”
No, it can’t. It can’t tell you whether it is summer in the SH and winter in the NH or vice versa!
It’s only Stats 101 if you include the VARIANCE associated with your anomalies! Where is the variance calculation?
The temperature anomaly at a given location is a measure of variance. The distribution of temperature anomalies around the globe at a given point in time is a distribution of variances in temperature for that time. If the mean of the distribution of variances (anomalies) is observed to shift over time, that means the global climate is changing.
Where did you get your training is statistical analysis of experimental data?
The anomaly is *NOT* a measure of variance. The anomaly *HAS* variance associated with it at any given point in time.
KM has coined the term trendologist to describe you. It fits you perfectly. To you the variance is how far a stated value is from the trend line fitted to those stated values — all the while ignoring the fact that those stated values have measurement uncertainty and variance associated with them.
You are caught out with your statement that variance is always random, Gaussian, and cancels. Variance does *NOT* cancel, It is not reading error or anything else.
Variance is a measure of the uncertainty of an average, even in a Gaussian distribution. The anomaly is *NOT* a measure of the uncertainty of anything.
“The anomaly is not a measure of variance, it is a measure of variance.” You have simply got to think about what you write before pressing the Post Comment button.
Oh, that’s not any statement I ever made. That’s a statement you are falsely attributing to me. You need to learn to separate the things people are actually saying with the lies you’ve convinced yourself of, it’s causing you delusions.
Who do you think you are fooling?
““The anomaly is not a measure of variance, it is a measure of variance.””
I didn’t say that. That phrase appears ONCE in this entire article. Yet you put quotes around it like *I* said it.
When you ignore the variance of the data then you *ARE* assuming that the variance somehow cancels. The proof is that you absolutely refuse to give us the variance of the data you are calculating the average from.
THE AVERAGE ALONE IS NOT A COMPLETE STATISTICAL DESCRIPTION OF A DATA SET.
Why is that so hard for you to understand. If you can’t tell us the variance then that means you have no idea of what the distribution of the data is. Any assumption you make about “random” can’t be justified without a complete statistical description of the data.
I’ve never said anything contrary to this, you’re just fighting with ghosts and phantoms.
Then give us the variance of the temperature data from Forbes AFB, Topeka, KS.
If you can’t then you are ignoring it!
And if you ignore it then you are *NOT* providing a complete statistical description of the data!
But you never discuss the other statistical parameters which leads one to believe they hold no significance to you.
Tell us about the variance in a monthly series of temperatures. What is it? How do you obtain an uncertainty from it? How do you average one monthly random variable with another and deal with the different variance of each?
He isn’t rational because he is fully enrolled in the climate cult thus will say anything to defend the impossible since rational people knows there is NO climate crisis occurring.
FACT: NO Hot Spot exists.
FACT: NO Positive Feedback Loop exists.
FACT: Climate cultists ignore these two easily proven AGW conjecture prediction failures thus AGW is a failed pile of shite but that isn’t accepted because it is a religion they must follow.
Who pays you to post this tripe?
It has nothing to do with the variance of anything. It is a rate of change, not a variance.
The variance for an anomaly is actually derived from the two random variables that are used to calculate it.
Var(X – Y) = Var(X) + Var(Y) where:
X = random variable associated with the monthly average, and,
Y = random variable associated with the baseline average.
The associated uncertainty is the √variance.
Climate science doesn’t even recognize random variables and how they are dealt with. If they did, they would recognize that anomalies are not averages, they are the subtraction of two random variables.
When averaging anomalies, the individual uncertainty of each anomaly must be propagated through the entire calculation, just as you would any uncertainty. See the GUM for doing this.
I found this insightful.
No emergency.
The graph shows the increase in the global mean temperature quite plainly.
Absolutely zero evidence of human causation except urban and mal-adjustments.
Warming that wouldn’t even be noticed except for all the chicken-little idiocy that the AGW cultists like you go on with.
Also , BEST is not “global” in any way….. It is purely URBAN.
Mr. J: And you have an expert to establish the cause of the increase shown? There’s a guy here named Greene who will say it, maybe you should look him up?
So what!
Many times, in the interglacial period there have been warming trends…..
Most of the warming is at night and in winter.
What are your professional credentials in trendology?
I can understand what a “climate anomaly” is. Some parameter that can be compared to an average. I do not think that the term “Climate Event” makes any sense. It is invariably used to describe weather events with the strong implication that this event is the new average so it is a picture of the “New Climate”. A hot year averaged with the previous 29 and compared to each of the previous 30 year groupings in the record may give us some climate information if the record is long enough. The Held V Montana trial used this term throughout and was never challenged. All of the young plaintiffs complained of smokey or rainy years yet none of them had even experienced enough weather to comprise one climate data point for comparison.
Anomalies inherit the variance of the parent components ( var(x+y) = var(x) + var(y) ). The variance of a distribution is a metric for how uncertain the average value is. Anomalies are always more uncertain than each of the parent components. Better to look at the parent components by themselves than the differences.
What are x and y in your equation?
Don’t start. You are out of your depth. We’ve been down this road before. When is variance a valid statistical descriptor? Always? Never? Sometimes?
You could have simply said you don’t know.
ROFL!! In other words you have no idea what the variance of the temperature data is. You never have, you don’t now, and you never will. Like climate science you think the average alone is sufficient to describe a data distribution.
The usual manic laughter and deflection.
It’s a simple question. When you are talking about subtracting two random variables, what exactly are those variables? You won’t answer the question because you don’t understand your own argument. I suspected as much, and now your refusal to answer the simple question demonstrates it.
YES! The question *IS* what exactly are those variables!!!
That’s EXACTLY what I’ve been trying to tell you and you adamantly refuse to address!
How do you combine the sinusoidal daytime temperature profile with the exponential decay nighttime temperature profile to come up with an AVERAGE that is meaningful?
That average, actually a median of a multi-modal distribution, can’t distinguish between two different climates so how can it be a useful metric?
When winter temps have a wider range than summer temps, meaning they have a higher variance, how DO YOU combine them to get an “average” global temperature for the same month, i.e. combining SH temps with NH temps?
Why won’t you address what the variance of all these variables is? You simply can’t even describe a Gaussian distribution using only the average – yet you and climate science does!
Don’t try to put this on me. I’ve looked at the variance of the winter and summer temps from my station. I *KNOW* they are different. I don’t do like you do and just ignore that very basic fact!
It’s on YOU to justify calculating a GAT while ignoring the variance of the data at the same time!
“YES! The question *IS* what exactly are those variables!!!”
If you don;t know why do you expect anyone else to?
You refuse to answer that simple question, and it’s easy to see why – so you just try to deflect with your other misunderstandings which have nothing to do with the point.
You say:
I’ll assume you meant var(x-y), given you are talking about anomalies. But you can’t just apply the equation var(X-Y) = var(X) + var(Y), without specifying what the random variables X and Y are. And your problem is you never do state what they are and keep using them to mean different things at the same time.
If X is an individual daily temperature and Y is an individual daily temperature from the base period, you can say that var(X) + var(Y) will be the variance in subtracting one from the other. But then you are saying nothing about the variance of the anomaly or of a monthly average. If X is the monthly average and Y is the average of the base period, the equation still works, but then var(X) and var(Y) are not variances of daily values, they are the variance of the averages.
But you always try to pretend they are the same thing. Hence why you find it so difficult to just say exactly what X and Y mean in your equation.
I’ve spent 2 years trying to get you to understand where your mistake is – but it’s futile because in your mind, and those of your cheerleaders below, you are incapable of being wrong. You think you understand how “combining” random variables works, but everything you say betrays your ignorance on the matter.
“If you don;t know why do you expect anyone else to?”
*YOU* are the one trying to say that var(x+y) ≠ var(x) + var(y) when it comes to temperature. It’s up to *YOU* to identify the variables!
“I’ll assume you meant var(x-y), given you are talking about anomalies.”
Your lack of algebra skills is showing again. “y” can be either negative or positive. You still show it as x + y
“ without specifying what the random variables X and Y are.”
What do you combine to get a temperature anomaly? Be honest. Don’t play stupid. It’s an argumentative fallacy known as Appeal to Ignorance.
If the variance of the monthly average is based on multiple daily values over a decade then those daily values taken as a data set have a variance. Thus the decadal distribution is described by the statistical descriptors of average and variance.
If that decadal monthly average is then used to subtract from tomorrows daily median value of temp then the anomaly inherits the variance of the components – the decadal monthly average and its own variance. Remember, the daily Tmedian is made up of two values representing a data set, a small one for sure but still a data set. And the variance of that data set of two elements will have a variance (Tmax- Tmedian)^2 + (Tmin – Tmedian) ^2. (the denominator of n-1 is 1).
Thus the variances of the two components will add:
Var(total) = Var(decadal monthly avg) + Var(Tdaily-median)
You are a troll, nothing more and nothing less. You can’t even understand the very basics. Give it a break. I’ll not answer you any more on this subject. You don’t know enough about it to make a meaningful comment!
This one still sums it all up completely:
“The only way they can get uncertainty intervals down into the hundredths and thousandths of a degree is by ignoring the uncertainty of the individual components. THE ONLY WAY.
“You can *NOT* decrease uncertainty by averaging. You simply can’t. Trying to discern temperature differences in the hundredths digit by averaging when the underlying data is only accurate to the tenths digit (or even the units digit) is an impossibility.
“It truly is that simple.
“Pat Frank knows more about measurement and uncertainty than you will EVER know.
“*YOU* still think that precision and accuracy are the same thing no matter how many people, including experts, tell you.
“And we are supposed to believe *YOU*?
“*YOU* still think that an average value, a single number, has a distribution associated with it and you can use GUM Eq 10 to evaluate the accuracy of that average value.
“And we are supposed to believe *YOU*?
“You still think that the partial derivative in GUM Eq 10 is NOT a weighting factor for the uncertainty components.
And we are supposed to believe *YOU*?”
— TG
And this one:
“He’s a troll, Tim” — Pat Frank
“This one still sums it all up completely:”
Yes it does. Lots of arguments by assertion and appeals to authority.
“Pat Frank knows more about measurement and uncertainty than you will EVER know”
The Pat Frank who thinks uncertainty and standard deviations can be negative? That authority?
“*YOU* still think that an average value, a single number, has a distribution associated with it and you can use GUM Eq 10 to evaluate the accuracy of that average value.”
For new listeners, it was karlomonte who insisted you had to use equation 10 to determine the uncertainty of an average.
“You still think that the partial derivative in GUM Eq 10 is NOT a weighting factor for the uncertainty components.”
I said you can call it what you want – it doesn’t change it’s value. This was in response to Tim claiming that the derivative of x^2 was 2, and insisting that the derivative of 2x was not 2.
“The Pat Frank who thinks uncertainty and standard deviations can be negative? That authority?”
Your reading skills are still atrocious. The standard deviation describes an interval around the mean – implying that it has a component of (mean – σ/2 and a component of (mean + σ/2). A negative interval (-σ/2) and a positive interval (+σ/2).
Someday you *really* need to learn basic algebra.
“For new listeners, it was karlomonte who insisted you had to use equation 10 to determine the uncertainty of an average.”
For new listeners KM said you use Eq 10 to find the uncertainty propagated onto the average. Bellman still thinks the standard deviation of the sample means defines the accuracy of the mean instead of the interval in which the population mean might lie. The accuracy of that mean is measured by the variance of the population, not by how precisely you calculate the mean.
” said you can call it what you want – it doesn’t change it’s value.”
No, that is *NOT* what you said. You said the partial derivative was *NOT* a weighting factor after I told you that it was. Then I had to show you how to use relative uncertainty for a quotient and the partial derivative becomes a weighting factor for the uncertainty. You couldn’t even figure out what Possolo did in TN1900, Example 2 until I showed you the simple algebra.
“This was in response to Tim claiming that the derivative of x^2 was 2, and insisting that the derivative of 2x was not 2.”
Your lack of reading comprehension skills are showing again. This is *NOT* what I said. I said specifically that the partial derivative of R^2 becomes a weighting factor of 2. And you said that was wrong. I had to show you how the simple algebra makes it such. And it’s not obvious that you understand that even now!
“Your reading skills are still atrocious.”
Are you claiming he didn’t say it? Do you want me to fish out the week long comment section where you tried to defend his claim that uncertainty and standard deviations could be negative?
“The standard deviation describes an interval around the mean – implying that it has a component of (mean – σ/2 and a component of (mean + σ/2). A negative interval (-σ/2) and a positive interval (+σ/2).”
Yes, that’s an excellent example of the contortions you went through to pretend that standard deviations could be negative.
“Someday you *really* need to learn basic algebra.”
It’s hilarious that you think this is a convincing putdown, when you sop often demonstrate your inability to understand simple equations.
“For new listeners KM said you use Eq 10 to find the uncertainty propagated onto the average.”
Which is what you insist we have to do to determine the measurement uncertainty of an average.
“Bellman still thinks the standard deviation of the sample means defines the accuracy of the mean instead of the interval in which the population mean might lie.”
The interval in which it’s reasonable to attribute the population mean is very much the definition of uncertainty favored by the GUM. But the SEM is not what we are talking about in equation 10 – that’s just propagation the measurement uncertainty onto the exact average.
“The accuracy of that mean is measured by the variance of the population, not by how precisely you calculate the mean. ”
You are still pretending that are you? Do you really think that argument makes any sense? That if you take a random sample, that the average has the same uncertainty as taking a simple value? Why bother taking a sample at all. If you want to know the average height of the population, just measure a single person and call it the average – it will be as accurate as the average of 100 people
“No, that is *NOT* what you said. You said the partial derivative was *NOT* a weighting factor after I told you that it was. ”
Then you will have to produce the exact quote. I just don’t see why you think calling the coefficients based on the partial deviations “weighting factors” has any bearing on why you keep getting them wrong.
I’d call them scaling factors rather than weighting factors because to me weighting implies a weighted average where you will be dividing by the sum of the weights, which is not at all what is happening in equation 10. But if you want to call them weights be my guest. Just don’t use it as an excuse for why you keep getting the partial deviations wrong.
“Then I had to show you how to use relative uncertainty for a quotient and the partial derivative becomes a weighting factor for the uncertainty.”
And as I keep telling you, that’s what happens when you have a product, but not when you have a sum, or an average. (I love the fact that you’ve convinced yourself that you had to explain this to me, sometime after I’d explained to you how equation 10 worked for products.)
“You couldn’t even figure out what Possolo did in TN1900, Example 2 until I showed you the simple algebra. ”
Hilarious.
I’ll have to track down the comment section where you explained this to me. My memory is that all you said was he was using relative uncertainties and that the partial derivative of R^2 was 2.
“Your lack of reading comprehension skills are showing again. This is *NOT* what I said. I said specifically that the partial derivative of R^2 becomes a weighting factor of 2.”
You just keep lying. I’ve already had to quote exactly what you said the last time you claimed this.
Here’s the link again
https://wattsupwiththat.com/2023/12/17/nasa-giss-data-shows-2023-el-nino-driving-global-temperature-anomaly-increases-noaa-data-shows-u-s-nov-2023-temperature-anomaly-declining/#comment-3835521
Some selected quotes
TG:
Me:
TG:
You clearly were claiming that x^2 (or SQUARED as you put it) had a partial derivative of 2.
In any event, your defense still illustrates your misunderstanding.
“I said specifically that the partial derivative of R^2 becomes a weighting factor of 2.”
It only does that in the specific case where your function is a pure product or quotient. If the function is x^2 + y say, then equation 10 is u(x^2 + y)^2 = (2x^2)u(x)^2 + u(y)^2. You cannot easily convert this to an equation involving relative uncertainties. And the “weighting” factor for x is 2x, not 2.
As I keep saying you are using this “weighting factor” argument to guess what you think the result should be, rather than actually work out the calculus.
So rather than confusing yourself with the uncertainty of a volume of a water tank, just try to get back to the point and explain what the partial derivatives should be in a function such as x/2 + y/2. I’m saying they are 1/2 each, you were claiming they are 1 each. That’s your important mistake, and why you just cannot accept that the measurement uncertainty of the average reduces with the number of measurements. Calling them weighting factors is just leading you to the wrong result.
“Are you claiming he didn’t say it? Do you want me to fish out the week long comment section where you tried to defend his claim that uncertainty and standard deviations could be negative?”
Yes!
Start here:
https://wattsupwiththat.com/2023/08/24/patrick-frank-nobody-understands-climate-tom-nelson-pod-139/#comment-3773822
Some quotes from the ensuing thread by Pat Frank:
You don’t even know what you are reading. You are cherry picking again with absolutely no understanding of context whatsoever.
It gets so tiresome trying to explain simple concepts to you that it is actually physically painful. LEARN TO READ!
The top curve is from a positive voltage excursion. The bottom curve is from a negative voltage excursion.
The uncertainty interval for the top curve ranges from +0.8 to +1.2 (all values are examples and are only given for clarification)
The uncertainty interval for the bottom curve ranges from -0.8 to -1.2
That makes the top measurement as 1 +/- (0.2) and for the bottom measurement as -1 +/- (-0.2)
-1 + (-.2) = -1.2 and -1 – (-.2) = -.8
Your lack of algebraic skills is astounding for someone who thinks they are expert enough to contradict Pat Frank on his assertions.
See the attached sketch for further clarification.
“It’s hilarious that you think this is a convincing putdown, when you sop often demonstrate your inability to understand simple equations.”
The truth hurts, doesn’t it?
“Which is what you insist we have to do to determine the measurement uncertainty of an average.”
Absolutely!
“The interval in which it’s reasonable to attribute the population mean is very much the definition of uncertainty favored by the GUM. “
No, it ISN’T! The GUM says the population mean is an ESTIMATE OF THE VALUE OF THE MEASURAND. The SEM is a measure of the accuracy of that estimate for the population mean. It is *NOT* the accuracy of the mean, it is the PRECSION with which the mean has been estimated.
The GUM says the uncertainty of the measurement is the dispersion of the values that can be reasonably assigned to the measurand. It does *NOT* say the dispersion of the values that can be reasonably assigned to the *mean*. And the mean is *NOT* the only value that can be reasonably assigned to the MEASURAND.
As I keep saying, your reading comprehension skills are just atrocious. You don’t actually *read* anything, you cherry-pick stuff that you think bolsters your argument without understanding anything in context – primarily because you either can’t read or you just don’t care.
“The GUM says the population mean is an ESTIMATE OF THE VALUE OF THE MEASURAND.”
Citation definitely required. It’s an absurd thing to say given that the population mean is the measurand in this case.
What they do say of course is that the sample average is an estimate of the population mean.
“The GUM says the uncertainty of the measurement is the dispersion of the values that can be reasonably assigned to the measurand.”
How many more ways are you going to find to misquote their definition?
It’s not like you can’t misunderstand it enough, without having to change “attributed” to “assigned”.
“It does *NOT* say the dispersion of the values that can be reasonably assigned to the *mean*.”
How long before you cotton on to the fact that mean is the measurand when you are talking about the uncertainty of the mean?
If the estimated mean global temperature is 15°C, is it reasonable to say you could attribute a value of -5°C or 35°C to the average, just becasue some portions of the globe are that temperature?
“…you either can’t read or you just don’t care. ”
How many times has it been pointed out that ad hominems are a sure sign you know you’ve lost the argument?
“How many more ways are you going to find to misquote their definition?”
JCGM Section 2.2.3:
“uncertainty (of measurement) parameter, associated with the result of a measurement, that characterizes the dispersion of the values that could reasonably be attributed to the measurand”
I have given this to you AT LEAST FOUR TIMES THAT I CAN REMEMBER!
You *should* be able to look it up for yourself by now if you had ever bothered to actually read the JCGM completely for understanding!
How many more ways are you going to find to MISREAD WHAT THE GUM SAYS?????
bellman: “parameter, associated with the result of a measurement, that characterizes the dispersion of the values that could reasonably be attributed to the measurand”
You even had to leave off the first part of the quote because it speaks about “uncertainty (of measurement)”!!
“It’s not like you can’t misunderstand it enough, without having to change “attributed” to “assigned”.”
And now you are clear down to arguing the definition of “is”!
From comparewords.com
AssignDefinition:
(bolding mine, tpg)
AttributeDefinition:
(bolding mine, tpg)
You can’t even get this one right!
“How long before you cotton on to the fact that mean is the measurand when you are talking about the uncertainty of the mean?”
I’ve given you the definition from the GUM as to what a measurand *is* at least twice. And you refuse to learn it.
JCGM Section B.2.9
measurand: particular quantity subject to measurement
An average is not a quantity subject to measurement. You can’t measure an average. You can’t find an average laying on the ground where you can measure its component attributes.
JCGM Section B.2.1
(measurable) quantity
attribute of a phenomenon, body or substance that may be distinguished qualitatively and determined quantitatively
An average is *NOT* a phenomenon, body, or substance that may be distinguished qualitatively and determined quantitatively. You can’t find one on the shelf at a supermarket, or a machinist shop, or a physics lab, or …..
Write this down 1000 times on a pad of paper:
“The SEM or SDOM is a STATISTICAL DESCRIPTOR. It is *NOT* a phenomenon, body, or substance. You cannot find one laying on the ground, floating in the air, or radiating light.”
A statistical descriptor is a tool. It is no different than a yardstick. The yardstick is not the measurand, it is a tool used to understand the measurand. Does the phrase “the map is not the territory” mean anything to you? A map is a descriptor just like a statistical descriptor. It is a tool useful in understanding the territory but it is *NOT* the territory. The average is *NOT* the measurand. It is a tool used to understand the measurand.
“I have given this to you AT LEAST FOUR TIMES THAT I CAN REMEMBER!”
And I gave you the exact same quote, so why are you shouting.? My point was that you misquoted it originally – changing “attributed to” into “assigned to”.
“You even had to leave off the first part of the quote because it speaks about “uncertainty (of measurement)”!!”
See, you even knew I’d quoted the exact words. I quoted everything apart from the title. I assumed you would understand that I was quoting the definition of measurement uncertainty.
“From comparewords.com”
Do you really need a dictionary to understand that assign to is not the same as attribute to?
“An average is not a quantity subject to measurement.”
So you keep claiming. Yet you also keep quoting the GUM definition of uncertainty, which requires a measurand.
“(measurable) quantity
attribute of a phenomenon, body or substance that may be distinguished qualitatively and determined quantitatively”
Yet here we are, keep discussing the quantity of the global average anomaly.
“An average is *NOT* a phenomenon, body, or substance“
You missed the words “attribute of a …”
“Write this down 1000 times on a pad of paper:”
No. And again, it seems a telling part of your world view that you think repeating something 1000 times makes it true.
“The SEM or SDOM is a STATISTICAL DESCRIPTOR.”
And nor does writing it in capitals. The SEM is not a descriptive statistic, it’s an inferential statistic.
“The average is *NOT* the measurand. It is a tool used to understand the measurand.”
So what is the measurand?
“And I gave you the exact same quote, so why are you shouting.? My point was that you misquoted it originally – changing “attributed to” into “assigned to”.”
One was from memory and the other a quote from the document. And I showed you how both words mean the same thing.
Are you Bill Clinton in disguise? “It depends on what the definition of “is” is”
” I quoted everything apart from the title.”
No, you LEFT OFF THE FIRST WORDS OF THE DEFINITION!
“Do you really need a dictionary to understand that assign to is not the same as attribute to?”
So now you can tell dictionaries when they are correct and when they aren’t? Unfreakingbelievable!
“Yet here we are, keep discussing the quantity of the global average anomaly.”
No, *YOU* are defending it as a measurand and I am saying it is not. The GUM agrees with me, not you.
“The SEM is not a descriptive statistic, it’s an inferential statistic.”
It is *STILL* a statistical descriptor”. Whether it is a direct one or an inferential one doesn’t change that fact. You are *still* trying to argue what the definition of “is” is!
“So what is the measurand?”
Sealioning again. You’ve just been given the definition. Put down the bottle. It’s killing your memory cells.
“No, you LEFT OFF THE FIRST WORDS OF THE DEFINITION!”
Here’s the exact quote from the GUM
“uncertainty (of measurement)
parameter, associated with the result of a measurement, that characterizes the dispersion of the values that
could reasonably be attributed to the measurand”
The only words I left off where the bold type. How on earth you think this is a point worth getting hysterical about is beyond me.
“Sealioning again.”
I guess this is going to be your excuse for refusing to explain any of your nonsense for the foreseeable future. I am not a mind reader. If you claim the global mean is not a measurand but can be used to understand the measurand, I cannot tell what measurand you are talking about. You are just using this new concept to avoid having to justify your claims.
“You’ve just been given the definition.”
You gave me the definition of the word “measurand”. I’m asking you what the measurand is in your comment. What is it you want to understand by using the mean?
“The only words I left off where the bold type.”
And those were the most important words!
It says “uncertainty (of measurement)” and it does not say “uncertainty (of the mean)”.
Once again, the mean is NOT a measurement, it is a statistical descriptor. It is not a phenomenon, body, or substance – which is what a measurand is defined as being.
Why must this be explained to you over and over and over and over and over and over and over ……
“I guess this is going to be your excuse for refusing to explain any of your nonsense for the foreseeable future”
The only nonsense on here is the assertions you continually make to harass people that have at least some modicum of experience in metrology in the real world. Like assuming that all measurement uncertainty is random, Gaussian, and cancels.
” If you claim the global mean is not a measurand but can be used to understand the measurand, I cannot tell what measurand you are talking about. “
You can’t tell because you can’t READ. You just make things up, cherry pick things, and never actually understand any context!
Understanding *ANY* distribution requires a full panoply of statistical descriptors. The mean by itself is *NOT* sufficient. Using the mean by itself has implicit, unstated assumptions that the distribution is Gaussian and that its variance can be ignored – what you and climate science do with your assumptions of random, Gaussian, and cancellation.
“You are just using this new concept to avoid having to justify your claims.”
Everything you have been told has been justified WITH REFERENCES and presentation of actual observational data – which has been presented to you (e.g. Forbes AFB record since the 50’s with a kurtosis of 16 and a skew of 1.6). The fact that you either can’t understand them or refuse to accept them is *YOUR* problem, not mine or anyone else’s.
Every time I think these arguments can;t get more insane, Tim finds a way. He’s now been whining for the last few comments becasue I didn’t include the words “Uncertainty (of measurement)” in front of my quote of the GUM’s definition of measurement uncertainty.
And all this to claim that measurement uncertainty cannot refer to the uncertainty of a mean, whilst simultaneously insisting you have to use the definition of measurement uncertainty when describing the uncertainty of the mean.
Meanwhile he keeps omitting important words from his own choice of definitions – i.e.
“Once again, the mean is NOT a measurement, it is a statistical descriptor. It is not a phenomenon, body, or substance – which is what a measurand is defined as being. ”
The actual GUM quote is
He omits both the title, and the word “attribute”. The measurable quantity is an attribute of a phenomenon, body or substance.
Really this just depends on if you can claim that a global average temperature is an attribute of a phenomenon, such as the global temperature. He argues it cannot becasue you can’t buy the global temperature in a supermarket or in a laboratory.
I think this is sophistry – the mere fact that we get monthly updates on what the monthly global average anomaly is shows that it is a measurable attribute of a phenomemon.
But Tim never gets the irony that if he’s right and it isn’t a measurable quantity, then all the talk of using rules of metrology to calculate the uncertainty go out the window, and we can just go back to talking about it as a statistic and apply all the normal statistical rules to it.
“Understanding *ANY* distribution requires a full panoply of statistical descriptors. The mean by itself is *NOT* sufficient.”
And this is why omitting the word “attribute” matters. He’s claiming that if the mean does not fully describe the phenomenon than it can’t be a measured quantity. By this logic the volume of a water tank is not a measurement because it doesn’t describe how tall the tank is.
You have no idea what you are talking about. You never do.
A measurement is given by stating an estimated value accompanied by a measurement uncertainty.
A measurement is *NOT* a distribution. A collection of measurements is a distribution.
If you have one measurement of a phenomenon then you do *NOT* have a mean, you have an ESTIMATED VALUE. That estimated value is accompanied by an uncertainty interval.
If you have a number of measurements of that phenomenon, each with an estimated value and an accompanying uncertainty interval THEN you have a distribution. And the mean of that distribution has to be accompanied by the propagated measurement uncertainty from the multiple measurements.
Like I keep saying, you have NEVER read or studied anything having to do with metrology for understanding. All you ever do is cherry pick and then try to justify what you post by assuming everything is random and Gaussian and that all measurement uncertainty cancels.
“ By this logic the volume of a water tank is not a measurement because it doesn’t describe how tall the tank is.”
Put down your bottle! You are drunk. See Possolo’s paper on how to calculate the uncertainty in the volume of a tank BY MEASURING ITS RADIUS AND HEIGHT!
Can *you* tell the volume of a tank merely by looking at it? Or do you have to measure it?
Stop your whining. You are acting out like a petulant child who’s been shown why his math homework is wrong!
When was the last time you addressed MEASUREMENT uncertainty of the average instead of just “uncertainty of the average”?
It’s obvious to EVERYONE what you are doing: It’s named Equivocation.
Equivocation: calling two different things by the same name.
The SEM and measurement uncertainty ARE TWO DIFFERENT THINGS. Yet you try to confuse the issue by calling them the same thing – just “uncertainty” of the mean.
We’re not nearly as stupid as you believe!
“When was the last time you addressed MEASUREMENT uncertainty of the average instead of just “uncertainty of the average”?”
Every time we went through equation 10 of the GUM – remember what the M stands for.
“Equivocation: calling two different things by the same name.”
I’ve repeatedly told you there are two types of uncertainty here, that which comes from measurement errors (hello karlo), and that which comes from sampling.
“We’re not nearly as stupid as you believe!”
It would be great if you could provide some evidence of that.
JCGM: 5.1.1 The standard uncertainty of y, where y is the estimate of the measurand Y and thus the result of the measurement, is obtained by appropriately combining the standard uncertainties of the input estimates x1, x2, …, xN (see 4.1). (bolding mine, tpg)
“I’ve repeatedly told you there are two types of uncertainty here, that which comes from measurement errors (hello karlo), and that which comes from sampling.”
I’ll ask again, WHY WON’T YOU USE THE TERM “MEASUREMENT UNCERTAINTY”?
“I’ll ask again, WHY WON’T YOU USE THE TERM “MEASUREMENT UNCERTAINTY”?”
We are talking about measurement uncertainties – why do you think it need to be spelt out every time we mention something from the GUM which is all about measurements? What do you think I meant when I asked you what the M stood for in GUM? I’ve used the term “measurement uncertainty” with out the need to shout it many many times, but for some reason you keep asking the same inane question.
It seems you are really leaning into the idea of sealioning.
Everyone but you is talking measurement uncertainty.
When you divide by sqrt(n) you are TALKING ABOUT THE SEM!
They are not the same thing and I’m pretty sure you know it. That’s why you never say uncertianty/ sqrt(n) is the measurement uncertainty!
The GUM is very specific in Section 4.2.
q̅ = (1/n) Σ1nqk
Note this phrase carefully, “n independent observations qk”. You and bdgwx have previously defined the measurand equation as f(t1, … tn) = (t1 + … + tn)/n. In other words for a measurand of a monthly average you have one value. Therefore,
n = 1 and,
q̅ = q1
You can proceed no further in calculating variances because ( q1 – q̅ = 0)
If, you now want to define the measurement model and observation equation as is done in NIST TN 1900, we can proceed further.
From 4.2.2 in the GUM
The experimental variance of the mean s²(q) and the experimental standard deviation of the mean s(q) (B.2.17, Note 2), equal to the positive square root of s²(q), quantify how well q estimates the expectation μq of q, and either may be used as a measure of the uncertainty of q.
Please note the GUM says the experimental variance of the mean quantifies how well “q” estimates the expectation of μq.
It does not indicate that it is THE uncertainty in measurement. In fact it goes on to say:
The uncertainty of q̅ IS NOT the measurement uncertainty. The uncertainty of q̅ is the interval that surrounds the mean and indicates how well q̅ estimates the population mean. Only in one circumstance can it be considered a measurement uncertainty. Multiple measurements of the SAME thing with the same device and person in a short period of time. That is, under repeatable conditions.
“I’ll have to track down the comment section where you explained this to me. My memory is that all you said was he was using relative uncertainties and that the partial derivative of R^2 was 2.”
We’ve been through this before. I gave you three separate quotes of what I said. All three showed I stated the partial derivative was a WEIGHTING FACTOR.
“You clearly were claiming that x^2 (or SQUARED as you put it) had a partial derivative of 2.”
NO! I was pointing out that it results in a WEIGHTING FACTOR of two.
“t only does that in the specific case where your function is a pure product or quotient.”
WHAT IN GOD’S NAME DO YOU THINK WE WERE DISCUSSING?
“You cannot easily convert this to an equation involving relative uncertainties. “
ROFL!! You *STILL* haven’t bother to read Taylor FOR UNDERSTANDING, have you? You just keep cherry-picking. I’ve told you before that you need to read every single word and do every single exercise in order to understand the subject. Yet you refuse.
Taylor explains this in Chapter 2, sections 2.7 and 2.8. All uncertainties can be expressed as a fractional uncertainty. In fact, in many cases it is imperative to do so. The example he gives is 21+/- 1 vs 0.21 +/- 0.01.
They have VERY different levels of uncertainty, 1 vs 0.01. But they both have the same FRACTIONAL UNCERTAINTY, +/- 0.05 or 5%!
The absolute value of the uncertainties doesn’t really give a feel for how accurately each measurement has been made. Just ask a machinist about this some time! Or a physicist. Or an astronomer. Or a surveyor.
All you do with this garbage is show that you are an amateur black-board statistician with absolutely no real world experience in measuring ANYTHING!
“As I keep saying you are using this “weighting factor” argument to guess what you think the result should be, rather than actually work out the calculus.”
*I* showed you how to work out the calculus and algebra and now you are just whining over it. A petulant child upset over being shown he was wrong.
“So rather than confusing yourself with the uncertainty of a volume of a water tank, just try to get back to the point and explain what the partial derivatives should be in a function such as x/2 + y/2.”
And now you are just trying to deflect to a different issue because you know you were shown to be wrong on the issue at hand. Again, a petulant child acting out.
“I’m saying they are 1/2 each, you were claiming they are 1 each. “
Where did I claim that? You are making things up in your head. Put down the bottle! How much do you drink every day?
“That’s your important mistake, and why you just cannot accept that the measurement uncertainty of the average reduces with the number of measurements.”
You are still trying to use the argumentative fallacy of Equivocation, trying to substitute one thing for another.
You are talking about the SEM. The average is only an ESTIMATED value for the measurand. It *has* to be accompanied by a measurement uncertainty interval if it is a physical measurement.
It doesn’t matter how small you make the SEM, the measurement uncertainty interval remains the same.
And the SEM only gets smaller if each sample is iid. When you are measuring DIFFERENT THINGS, A SINGLE TIME FOR EACH, UNDER DIFFERENT ENVIRONMENTAL CONDITIONS, the SEM doesn’t really apply. The fact that the measurment uncertainty interval can be different for each measurment element tells you that you don’t have iid conditions and therefore the CLT doesn’t apply. Adding measurements will not only change the mean itself but it will result in adding to the measurement uncertainty of the total.
Get off the kick that the SEM somehow tells you something about the accuracy of the mean. IT DOESN’T. This has been pointed out to you over and over and over ad infinitum. The SEM can be zero while the accuracy of the mean is wildly off. A common systematic bias can never be cancelled no matter how many measurements you make. That’s why just giving a daily Tmedian from a temp measuring station with no accompanying measurement uncertainty interval starts off the entire “average” temperature edifice with a crumbling foundation!
It’s why Possolo made the assumptions he did in TN1900 – assumptions which you’ve been requested repeatedly to list out and which requests you have repeatedly ignored. Ignored because you know that if you list them out you will no longer be able to claim the SEM is a metric for the accuracy of the mean of a set of temperature measurements.
“NO! I was pointing out that it results in a WEIGHTING FACTOR of two.”
You can;t even read your own comments
TG:
No mention of weighting factors. You said that if (∂f/∂xᵢ) = 2 then x must have been squared. You are talking about the partial derivative – not what happens when you transform it into a relative uncertainty – and you attacked my calculus knowledge.
Still simple question – what do you think the “weighting factors” will be in the equation 2x + y, and what will they be in the equation x^2 + y?
And most importantly what about x/2 + y/2?
“WHAT IN GOD’S NAME DO YOU THINK WE WERE DISCUSSING?”
The function as an average. Not one involving quotients or products.
“ROFL!! You *STILL* haven’t bother to read Taylor FOR UNDERSTANDING, have you? ”
Yet somehow I seem to understand how these equations work, whereas you don’t. I’m not even talking about Taylor – I’m just explaining how partial derivatives work. I’m sure Taylor explains the same thing, but I’m quite capable of working things out for myself. It’s much better than your approach of finding an example and trying to shoehorn it into a different problem.
“I’ve told you before that you need to read every single word and do every single exercise in order to understand the subject.”
If you want an example of why Tim is so bad at understanding this, I think this might be the problem. He thinks that simply reading every word of a book will install wisdom. You can read learn something by rote and yet still not have a clue about how it works.
“Taylor explains this in Chapter 2, sections 2.7 and 2.8. All uncertainties can be expressed as a fractional uncertainty. In fact, in many cases it is imperative to do so. The example he gives is 21+/- 1 vs 0.21 +/- 0.01”
Completely missing the point. I’m talking about how the equation can best be expressed. When dealing with products you will have to either divide through by the resulting value to get a sum involving relative uncertainties, or have a more complicated equivalent equation that requires multiplying each uncertainty by the other values. In either case you end up with the size of the values influencing the absolute uncertainty. Hence, why the specific rule just says to add relative uncertainties when multiplying or dividing.
When your function involves adding or subtracting you end up with an equation where the uncertainties are not affected by the size of the other measurements, and so relative uncertainties will not be useful – hence the specific rules for adding and subtracting values.
And your example from Taylor is not about converting absolute uncertainties to fractional ones. It’s about how significant figures can be used as a rough indication of fractional uncertainties.
“A petulant child upset over being shown he was wrong.”
You claiming that the partial derivative would only be 2 if it was x^2 in the function is not showing me I was wrong. You still need to answer the question, what is the partial derivative of x/n when the function is an average.
“And now you are just trying to deflect to a different issue ”
The “different issue” being what happens when you apply the equation to an average? You do remember that this what started the whole debate about equation 10, and not any nonsense about how to measure the volume of a water tank?
“Where did I claim that?”
More things I’ll have to track down. But fine, if you don’t say that, just explain what happens when you use equation 10 with an average.
“You are still trying to use the argumentative fallacy of Equivocation, trying to substitute one thing for another. ”
Do you, or do you not, want to use equation 10 to determine measurement uncertainty for an average?
“You are talking about the SEM”
No I am not – I’m talking about the equation involving partial derivatives and measurement uncertainty. Of course they do both end with standard deviations being divided by √N, and that’s not a coincidence, but the standard deviations are very different.
“It doesn’t matter how small you make the SEM, the measurement uncertainty interval remains the same.”
A minute ago you were denying you thought the partial derivative of x/2 was 1, now you insist that measurement uncertainty remains unchanged when taking an average. Please show your workings.
“And the SEM only gets smaller if each sample is iid”
And there you go spreading falsehoods again, yet you will claim I’m the one trolling. Not worth going through anymore of your comment after this – I can see you are back to hysterical screaming again.
“No mention of weighting factors.”
Are yo *still* whining about this? I told you the partial derivative was a weighting factor. You said it wasn’t. I showed you the calculus and algebra that showed that it *was* a weighting factor.
And now you are whining about being shown to be incorrect in you assertion that it wasn’t a weighting factor.
Accept it. IT IS A WEIGHTING FACTOR. No matter how much you want to whine about it!
This is like arguing with a 2-year old. “No I thought of it first, stop copying me.”
” I told you the partial derivative was a weighting factor. You said it wasn’t.”
I did not. I said it didn’t matter what you called it you still had to work out the correct partial derivative.
I’ve already quoted the part of the discussion where you said I didn’t understand calculus because I thought the derivative of 2x was 2, whereas you said it was only 2 when the function was x^2. You go on to say
This is the first time you mentioned weighting factors. In my response I said
I can find no point why I said they were not weighting factors, I’m just think it’s a misleading term, and irrelevant to how you apply the partial derivatives.
“I did not. I said it didn’t matter what you called it you still had to work out the correct partial derivative.”
Stop whining. You said it wasn’t a weighting factor. Otherwise I would not have had to go to the effort to lay out the algebra and calculus to show you that it IS!
“I’ve already quoted the part of the discussion where you said I didn’t understand calculus because I thought the derivative of 2x was 2, whereas you said it was only 2 when the function was x^2. You go on to say”
The quotes you provided did *NOT* say you didn’t understand that the derivative of 2x was 2. I told you the partial derivative of x^2 was 2x! And then I showed you how the x cancelled leaving 2 as the weighting factor!
YOU DIDN’T EVEN REALIZE POSSOLO WAS USING RELATIVE UNCERTAINTY!
STOP WHINING!
Oh the irony.
Pro-tip, if you are going to complain about someone whining it’s a good idea not to write half the comment in all caps or bold, or both.
“Still simple question – what do you think the “weighting factors” will be in the equation 2x + y, and what will they be in the equation x^2 + y?”
The equation in question was V = piR^2H. Stick to the issue. Stop whining.
Ask him what the uncertainty of pi is…
“Stop whining.” — CMoB
He won’t know. He’ll confuse precision with accuracy!
Of course.
0 – next question.
If you mean an estimate of pi, then that depends on how many digits you’re using.
Yep! I knew it would happen. You confused precision with accuracy.
What is the uncertainty of a constant?
And think about this—in just a couple days, the trendologists get to restart their circus act. Joy!
You’re saying pi has an uncertainty?
“What is the uncertainty of a constant?”
Depends on the constant. If I use 3.14 as an approximation for pi it has an inaccuracy, it lack trueness in the stranded terms.
Your lack of training in the physical sciences is showing again. It’s truly sad. You don’t just arbitrarily pick how many digits you are going to use for pi. The number of digits you use is based on the precision of the other factors. It doesn’t make sense to use 3.14 if your measurement precision is only in the units digit, the uncertainty in the hundredths digit will be dominated by the measurement precision. On the other hand if you are measuring down to the thousandths digit then it wouldn’t make any sense to limit the number of decimal places in pi to just two. You would be artificially limiting the precision of your answer to just two digits when three are justified.
In *every* case, the uncertainty of pi is 0 (zero), by definition. It is a constant. Just like the speed of light. When the speed of light was a measured value it had a measurement uncertainty. Today it has a defined value – no measurement uncertainty. The length of a meter is a defined constant, it has no measurement uncertainty.
You didn’t even bother to go and do any research on this, did you?
“The equation in question was V = piR^2H. Stick to the issue. Stop whining. ”
Funniest deflection yet.
No. The discussion is about what happens when you use equation 10 to find the measurement uncertainty of an average. You are the only one who thinks that you can use the volume of a water tank as a substitute for the average of multiple temperatures. They are two different functions and you will give you different results.
As I keep suggesting, the problem here is people just haven’t got the mathematical skills to understand how to use the equation, so they look for some different equation and try to extrapolate from that – it’s the fallacy of the cargo cult.
“The discussion is about what happens when you use equation 10 to find the measurement uncertainty of an average.”
You can’t find the uncertainty of an average by using your definition. I’ve already explained this.
“I’m just explaining how partial derivatives work.”
You DON’T know how partial derivatives work or you would have realized that it was a weighting factor in the equation for uncertainty of the volume of a tank!
A partial derivative is a partial derivative. It doesn’t matter what you use it for, you still have to get the correct value.
I’ll put a link to my response to Tim’s original comment, as due to the terrible threading on this site it will get lost below all the trollish comment from karlo.
https://wattsupwiththat.com/2024/01/25/noaas-year-2023-selected-significant-climate-anomalies-and-events-diagram-misrepresents-both-anomalies-and-events/#comment-3857889
“A partial derivative is a partial derivative. It doesn’t matter what you use it for, you still have to get the correct value.”
You *really* need to take a basic calculus course.
A partial derivative is the slope of a function at a point and with respect to a plane. Measurement uncertainties are a set of constants. A set of constants do not a function make! They are *not* a random variable. The measurement uncertainty u(x1) doesn’t have a set of values that it can take on. Nor is it related to u(x2) when you are doing measurements of different things using different devices under different environments. There simply is no functional relationship you can point to and say that for this point the slope of the function is this value!
You are trying to claim that the ∂f/∂u is 1/2. It isn’t. It is 0 (zero). u1 has one value, not a set of values. It is not a function nor is it part of a function. There is no function f(u1, u2, u3, u4, …..).
There is no function like f(u) = y = mu + b where u can take on different values giving a different y for each one. It is not a random variable.
If this doesn’t make sense to you then you are hopeless!
Yes!
If all your values are used to find a single measurement consisting of an average, then you have Y₁. You are done. No Y̅. No Yₖ beyond Y₁.
There is no q̅, i e., a mean of multiple measurements. Therefore, q̅ = q₁ which makes s²(q₁) = (1/0)(q₁ – q̅) = 0/0 = 0, unless you are of the persuasion of 0/0 =1!
It is why TN 1900 uses a random variable containing multiple measurements of Tmax_avg.
This is beginning to sound like something written by a not very intelligent AI. Just a load of symbols thrown together which might have made sense on their own, but now are just a pile of random letters.
Honestly, what do you think any of that means?
I mean apart from anything where did 1/0 come from, and how does that produce a result of 0?
“You *really* need to take a basic calculus course. ”
I’m sure any course will emphasis that you need to get the partial derivative correct – regardless of what you are using it for.
“The measurement uncertainty u(x1) doesn’t have a set of values that it can take on.”
Of course it does. Are you sure you’re not the one who needs to learn some algebra. The equation is describing a set of symbols that can be substituted for any real number. u(y) = √(u(x1)^2 + u(x2)^2) / 2, works for any u(x1) and u(x2).
“You are trying to claim that the ∂f/∂u is 1/2”
Why do you continuously change the symbols? u is not used as a variable name becasue it’s also used to indicate uncertainty. If x is the input the partial derivative is with respect to x – ∂f/∂x. And if the function has x/2, then ∂f/∂x = 1/2.
You don;t have to understand why this works (though it’s useful to understand that it’s only an approximation for non-linear functions), you don;t have to imagine hyper-planes and gradients. The authors of the GUM have written out for you so you can just plug in the correct partial derivative for the correct uncertainty element – and get the correct, or approximately correct, uncertainty.
“It is 0 (zero).”
Bangs head on table. Really? So the measurement of an uncertainty of an average is now zero?
“There is no function f(u1, u2, u3, u4, …..).”
The contortions you go through just to avoid the obvious conclusion is truly incredible.
“If this doesn’t make sense to you then you are hopeless!”
Or maybe, just maybe, you should consider the possibility that it doesn’t make sense because you are fooling yourself.
“Of course it does.”
No, it doesn’t. Once again your lack of real world experience is showing.
The uncertainty is a function of the measurement device and how it is read. The uncertainty is *NOT* based on the value of “x” but on how the measuring device works. That’s what Pat Frank did when finding the systematic uncertainty of an LIG thermometer – based on its physical design! That systematic uncertainty did *NOT* depend on the temperature but on how it was built.
So “u” can’t take on just any value, it is specific to the measurement protocol and is a single value! It is a constant!
Temperature, on the other hand, can take on *any* value, at least within physical bounds. That’s why it is considered as a VARIABLE.
The partial derivative of a constant is 0 (zero). Always. It has no slope. If the uncertainty is 0.5 at 0C then it is 0.5 at 1C – no slope. No change. No derivative.
If it were not a constant then there would be a functional relationship that could be written. And that *is* the case with some measuring devices. It’s why the PTD sensors have a calibration curve. The calibration (i.e. uncertainty) is different for different temperatures. But that is typically ignored and a estimate is used as a constant.
I cannot emphasize enough that your blackboard statistics training simply doesn’t work in the real world. Never has, never will. No matter how much you whine and cry about it.
“Completely missing the point.”
Argument by Dismissal. YOU DID NOT KNOW THAT ALL UNCERTAINTIES CAN BE EXPRESSED AS FRACTIONAL. And you didn’t even realize that sometimes that is the best way to to it!
“More things I’ll have to track down. But fine, if you don’t say that, just explain what happens when you use equation 10 with an average.”
We have been OVER THIS AND OVER THIS AND OVER THIS AD INFINITUM!
The simplified Eq 10:
u_c(y)^2 = SUM u(xi)^2
u_avg^2 = u_c(y)^2/n = SUM (u(x_i)/n)^2
You always forget to divide by n on the left side as well as on the right side. If you divide the right side by n, you must divide the left side also. Simply algebra which you simply don’t understand.
You are finding the AVERAGE UNCERTAINTY, not the uncertainty of the average!
I don’t know how many times I’ve told you that the average uncertainty is not the uncertainty of the average.
u_c(y) is the uncertainty of the average just like it is the uncertainty of the measurement!
u_c(y) is *NOT* u_avg.
You refuse to understand measurements. You’ve never bothered to understand anything about it. Even my points above don’t cover the waterfront.
Measurements are “best estimate” +/- measurement uncertainty
Unless your measurements form a Gaussian (or symmetric) distribution the mean of the measurements may *not* be the best estimate for the measurand. In the case of a skewed distribution the MEDIAN may be the best estimate of the measurand. In which case u_c(y) will still apply but will u_c(y)/n apply to anything?
Again, write this down 1000 times.
u_c(y)/n is the average uncertainty not the uncertainty of the average!
He still can’t understand that single-point, single-value measurements have measurement uncertainty.
because that “single value” is a best estimate and not a true value!
Stop lying troll. Of course single measurements have measurement uncertainty, that’s the point.
Then why do you always ignore that? Why don’t you propagate that uncertainty into the mean of the sample means and the SEM of the sample means? Why do you only use the stated values and ignore the measurement uncertainties?
“We have been OVER THIS AND OVER THIS AND OVER THIS AD INFINITUM!”
And you still haven’t learnt anything.
“You always forget to divide by n on the left side as well as on the right side. If you divide the right side by n, you must divide the left side also. Simply algebra which you simply don’t understand.”
Thanks for demonstrating you still don’t understand the equation. Really it’s not difficult, you just have to fit the correct partial derivatives into it. But you keep trying to complicate it because you don’t like the answer.
u(y)^2 = Σ(Wi u(xi))^2
All you need to figure out what the Wi’s are for each term. (I’m using W as you like to think of them as weighting factors) .
If the equation is x1/n + x2/n + … + xn/n, then the partial derivative, and hence the W for each term is 1/n. Hence,
u(y)^2 = Σ(u(xi) / n)^2.
There is no dividing both sides by n, because the 1/n is already part of the right hand side equation.
“You are finding the AVERAGE UNCERTAINTY, not the uncertainty of the average!”
And again your problem is you keep wanting to give some sort of meta analysis to the equation, rather than simply looking at what the result is. And you keep getting it wrong. The average uncertainty would be
Σu(xi) / n
The difference is that in the correct equation you are not dividing the sum of the uncertainties by n, but are dividing the sum of the squares of the uncertainties by n^2. Or when you take the square root to get the uncertainty of the average you are dividing the square root of the sum of the squares of the uncertainties by n. In no case are you getting the average uncertainty.
“I don’t know how many times I’ve told you that the average uncertainty is not the uncertainty of the average.”
As many times as I’ve told you I agree.
“u_c(y) is *NOT* u_avg.”
It is if y is defined as the average.
“Measurements are “best estimate” +/- measurement uncertainty”
It’s been pointed out it’s problematic to use ± if it isn’t explained what it represents. It’s normally meant to mean an expanded uncertainty, and then you need to state the coverage factor.
“Unless your measurements form a Gaussian (or symmetric) distribution the mean of the measurements may *not* be the best estimate for the measurand.”
You keep misunderstanding this. The mean of the measuremnts is the best estimate of the mean (which I’m calling the measurand). If you are saying the mean is not the best value to use for a particular distribution, that may be the case, but it’s got nothing to do with the measuremnt uncertainty of the mean.
If you want to find the measurement uncertainty of a median using equation 10, it’s going to depend on exactly how you are defining the function. If all you are doing is choosing the one middle temperature reading, I’d guess it’s going to be just the uncertainty of that one measurement.
“Again, write this down 1000 times.
u_c(y)/n is the average uncertainty not the uncertainty of the average!”
If this is the only way something penetrates your brain, try writing 1000 times
“No one has claimed u_c(y)/n is the uncertainty of the average, or even the average uncertainty.
u(x) / √n is the measurement uncertainty of a mean, assuming all inputs ,x, have the same uncertainty, and are all independent.”
“Thanks for demonstrating you still don’t understand the equation”
I understand the equation just fine.
“If the equation is x1/n + x2/n + … + xn/n, then the partial derivative, and hence the W for each term is 1/n. Hence,
u(y)^2 = Σ(u(xi) / n)^2.”
Unfreakingbelievable.
You keep making the same mistake you made with Possolo.
if u_total^2 = SUM ui^2
and you divide SUM ui^2 by n^2
(u1/n)^2 + (u2/n)^2 + (u3/n)^2 …. ==> SUM ui^2/n^2
then you also have to divide u_total^2 by n^2
and the two n^2 terms cancel.
Otherwise you are creating a functional relationship that has no meaning, not even an average.
You also need to understand that ui/n is a constant divided by a constant. An uncertainty is a constant associated with the measurement. It’s not a variable.
When you state a measurement it is x1 = “estimated value +/- measurement uncertainty”. “measurement uncertainty is not variable. It doesn’t take on different values. It’s just the measurement uncertainty for measurement x1.
u1 is a value. u2 is a value. The ∂f/∂u is the partial derivative of a constant which equals 0 (zero). A partial derivative is the slope of a functional relationship at a point in a certain plane, like in the x-plane (∂f/∂x, ∂f/∂y, ∂f/∂z). That’s why you can take a partial derivative is y = x, x is a variable that can take on different values and you can find the slope of the function with respect to x. The measurement uncertainty is just like pi which is why it doesn’t show up as a partial derivative in the uncertainty calculation for V = piR^2H. The slope of the measurement uncertainty value is 0 (zero) for a specific measurement.
That’s why you don’t see ∂f∂u in Eq 10.
That makes you trying to find the uncertainty of a constant something typical for you!
What is also typical is that you are cherry-picking once again without understanding context from the GUM. The text for Eq 10 refers you back to Eq 1
Y = f (X1, X2, …, XN )
Y is *NOT* a function of u and therefore does not have a partial derivative.
The JCGM definition of a random variable is informative:
JCGM C.2.2
“random variable
variate
a variable that may take any of the values of a specified set of values and with which is associated a probability distribution [ISO 3534-1:1993, definition 1.3″ (bolding mine, tpg)
The measurement uncertainty has no “specified set of values”. It is an interval that is a constant. For a specific measurement the measurement uncertainty isn’t specified as a set of values, e.g. +/- 2, +/- 3, +/- 4, ….
It is specified as a constant associated with the measurement.
You are, once again, showing your lack of calculus knowledge as well as a total lack of understanding of measurements. You *REALLY* need to sit down and do some studying, some REAL studying, including actually working out examples.
“It’s been pointed out it’s problematic to use ± if it isn’t explained what it represents.”
Malarky! It may be problematic for *YOU*. But it is perfectly clear to me. It defines and interval of the GREAT UNKNOWN which can’t be perfectly measured or described!
It’s why some scientists are beginning to just specify the possible interval and leave off the estimated value. Where in that interval the actual value exists is part of the GREAT UNKNOWN. So why even bother giving an estimated value!
“It’s normally meant to mean an expanded uncertainty, and then you need to state the coverage factor.”
You are blowing smoke. It doesn’t matter how you get there, the uncertainty interval is a statement of the GREAT UNKNOWN. It simply doesn’t matter if you go left-right-left or right-left-right, you wind up in the same place! To get the total uncertainty you still just add’em up!
“u(x) / √n is the measurement uncertainty of a mean, assuming all inputs ,x, have the same uncertainty, and are all independent.””
No, it isn’t ANYTHING. It’s meaningless.
It’s a constant divided by a constant. u(x) is not a functional relationship for anything. u(x) is not a random variable. It has no derivative.
You are still stuck in statistical world like usual.
“No, it isn’t ANYTHING. It’s meaningless. ”
You’ll have to explain that to the authors of the GUM, to NIST, to the publishers of Taylor and Bevington, and everyone else who has been using those equations for the past century. I’m not the one you need to persuade.
If you have the 22 temps from TN 1900, your functional relationship of a single temperature measurement is:
Y₁ = 25.6° C.
Show how you calculate a Y̅ value!
What are you on about now? What functional relationship of a single temperature? You have a load of daily temperatures and you average them. Did you ever learn about averaging at school?
That’s the average temperature! Just like having a load of uncertainties and averaging them! The average uncertainty is *NOT* the uncertainty of the average! It’s not even guaranteed to be the uncertainty of any specific element in the data set!
No, you defined the functional relationship of determining a single measurand as f(x1, …, xₙ) = (1/n)Σ₁ⁿ(xᵢ).
The GUM calls a functional relationship an equation that defines a measurand.
A = l•w•h
PV = nRT
V = πr²h
I = σT⁴
You –> Tmeasurand = (1/n)Σ₁ⁿ(xᵢ)
The GUM is based on multiple measurand’s, qₖ, taken under repeatable conditions.
I know you think you are being smart by declaring a MEASURAND to be the mean of a set temperatures. But, when you do so, you no longer have multiple measurements of the measurand. You only have ONE value of a measurand.
Tim and I have tried multiple times to show you the GUM and VIM defines a measurand as a physical quantity.
You should read the VIM. It says:
See that “subject to measurement”? A mean of temperatures is not subject to measurement. It is not a physical phenomenon that can be measured.
A series of multiple measurements can be analyzed statistically to determine the uncertainty interval and an estimate of the value that is surrounded by that interval.
“No, you defined the functional relationship of determining a single measurand as f(x1, …, xₙ) = (1/n)Σ₁ⁿ(xᵢ).”
Yes, if by measurand you mean the average.
“The GUM calls a functional relationship an equation that defines a measurand.”
It says you can use a function to determine a measurand.
“The GUM is based on multiple measurand’s, qₖ, taken under repeatable conditions.”
You are talking about a Type A evaluation. But you can also use Type B.
“I know you think you are being smart by declaring a MEASURAND to be the mean of a set temperatures”
I was told to use equation 10 to evaluate the uncertainty of the mean – the only way that works is to assume the mean is the measurand. I don’t really care what you call it, it’s just the thing we are interested in and the thing you want to know the uncertainty of.
“But, when you do so, you no longer have multiple measurements of the measurand.”
That depends on what your inputs are. If you wanted the average of 5 lengths of wood, and you measured each length a hundred times to determine the individual length to high degree of certainty, you can use each of those as the input values, and the resulting experimental standard deviation of the mean as the input uncertainties. Or you could go for the other option and calculate 100 averages from each set of measurements and determine the uncertainty of the mean using the type A method.
However, in most cases you are only going to take one measurement, and use the uncertainty estimated from a Type B analysis.
“Tim and I have tried multiple times to show you the GUM and VIM defines a measurand as a physical quantity.”
The definition:
measurand
It does not say “physical” quantity, just “quantity”.
And they define measurable quantity as
(measurable) quantity
The question I suppose is would you say that a mean temperature was an attribute of a phenomenon, and could be determined quantitatively?
But as I keep pointing out, if you don’t think it can be a measurand then why do you keep talking about it’s measurment uncertainty. A measurement uncertainty requires a measurement of a measurand. It’s in the definition.
“A mean of temperatures is not subject to measurement.”
Then what are all those numbers you use to claimed to prove a pause was happening? Are you going to check the definition of measurement.
measurement
“You are talking about a Type A evaluation. But you can also use Type B”
Multiple measurements under repeatable conditions are REQUIRED whether you use Type A or Type B measurement uncertainty to describe the quality of the measurement protocol.
“I was told to use equation 10 to evaluate the uncertainty of the mean”
No, you were told to use Eq 10 to evaluate the MEASUREMENT uncertainty of the mean!
You are back to equivocating so you don’t have to admit you aren’t talking about MEASUREMENT uncertainty.
“the only way that works is to assume the mean is the measurand.”
No, the measurand is the quantity being measured. You do not *measure* the mean, you calculate it using the measurements of the mean. The measurement uncertainty of that mean is the either the propagated measurement uncertainty from the actual measurements, i.e. a CALCULATION, or it is the standard deviation of the actual measurements, i.e. a CALCULATION, or even a combination of the two!
Statistical descriptors are *NOT* measured – a requirement for something to be a measurand!
“It does not say “physical” quantity, just “quantity””
How do you MEASURE something that is not a physical quantity? Can you measure how tall God is? Can you measure the mass of the soul? Can you measure the wingspans of the angels dancing on the head of a pin?
“attribute of a phenomenon, body or substance that may be distinguished qualitatively and determined quantitatively” (bolding mine, tpg)
How do you determine something QUANTITATIVELY if it doesn’t physically exist? See the questions above?
What *IS* the quantity for an average? Can you find one laying on the ground somewhere? Can you pick it up?
“The question I suppose is would you say that a mean temperature was an attribute of a phenomenon, and could be determined quantitatively?”
The mean isn’t an attribute of a phenomenon! It’s a statistical descriptor of the measurements you made on the phenomenon! You measure the attributes of a phenomenon. You may not be able to make a direct measurement so that you have to make direct measurements of things that can be used to calculate the quantity in question – but it *still* requires MEASUREMENTS. Just like calculating the volume of a tank by measuring its radius and height.
“But as I keep pointing out, if you don’t think it can be a measurand then why do you keep talking about it’s measurment uncertainty. A measurement uncertainty requires a measurement of a measurand. It’s in the definition.”
If the average is the estimate of a quantity then the measurement uncertainty of that average is described by the measurement uncertainty involved in the measurements taken of that quantity. The total uncertainty is the root-sum-square of the individual measurement uncertainties, of the variation of the estimated values of the individual measurements, or a combination of the two. It is *NOT* how precisely you calculate the mean!
Like I keep telling you, the SEM can be 0 (zero) while the average is wildly inaccurate. But you won’t know that unless you propagate the individual uncertainties somehow! (or unless you do as *YOU* do and assume that all measurement uncertainty is random, Gaussian, and cancels)
*YOU* keep wanting to imply that an SEM of 0 (zero) means the accuracy of the mean is 100%, it’s the TRUE VALUE. The problem is that no matter how small you make the SEM, you will *never* know the true value, its part of the GREAT UNKNOWN. At least in the real world that is the case.
“Multiple measurements under repeatable conditions are REQUIRED whether you use Type A or Type B measurement uncertainty to describe the quality of the measurement protocol.”
You’re just making it up as go along now, aren’t you.
“No, you were told to use Eq 10 to evaluate the MEASUREMENT uncertainty of the mean!”
mea culpa – I forgot to add the word measurement when talking about the equation which is specifically for calculating measurement uncertainty, in a document specifically about measurement uncertainty.
If I’d been not talking about the measurement uncertainty I would have mentioned the SEM.
“You do not *measure* the mean, you calculate it using the measurements of the mean.”
So you are measuring the mean, and then using those measurements to calculate the mean – but you don’t think the calculation is a measurement. Are you sure you’ve thought this latest excuse through.
“Statistical descriptors are *NOT* measured – a requirement for something to be a measurand!”
It’s calculated from other measurements – just as the GUM says it can be. Just as when you calculated the volume of that water tank by measuring the height and radius. Did you forget the definition of measurement
measurement
“How do you MEASURE something that is not a physical quantity?”
Well there’s the problem. You are claiming the average temperature is not a physical quantity, yet we can measure it. Therefore it is possible to measure something that isn’t physical.
“How do you determine something QUANTITATIVELY if it doesn’t physically exist? ”
Well for a mean I might take lots of samples and average them.
“What *IS* the quantity for an average?”
See the numerous articles on this very website quantifying the global average anomaly. E.g. according to UAH the anomaly for December 2024 was +0.83°C.
“Can you find one laying on the ground somewhere? Can you pick it up?”
If that’s your definition of a measurand, you are not going to be able to measure many useful things.
“The mean isn’t an attribute of a phenomenon! It’s a statistical descriptor of the measurements you made on the phenomenon!”
So you can measure the phenomenon, and find an attribute of it such as the mean, but on your say so that attribute is not a measurand.
“If the average is the estimate of a quantity…”
The average is an estimate of the mean, so are you now accepting the mean is a quantity?
“…then the measurement uncertainty of that average is described by the measurement uncertainty involved in the measurements taken of that quantity.”
And how are they describing it? By propagating the measurement uncertainties into the standard combined uncertainty? Or just by taking the average of all the uncertainties?
“The total uncertainty is the root-sum-square of the individual measurement uncertainties, of the variation of the estimated values of the individual measurements, or a combination of the two.”
Define total uncertainty. You basically seem to be back to claiming the uncertainty of the average is the uncertainty of the sum – which is completely different to what you claim when you say it’s the standard deviation of the measurements.
It’s pointless to ask, but would you actually point to where in the GUM this nonsense is demonstrated?
“Like I keep telling you, the SEM can be 0 (zero) while the average is wildly inaccurate.”
You’ve stopped talking about measurement uncertainty I see. But as I keep having to remind you the only way for a sample to have a SEM of zero is if the standard deviation is zero, in which cased by your logic it will also have no inaccuracy.
“*YOU* keep wanting to imply that an SEM of 0 (zero) means the accuracy of the mean is 100%, it’s the TRUE VALUE.”
No I do not. Firstly if you anyone claims the SEM is 0 I’m going to assume the result is garbage.
Secondly, the SEM is a description of the sampling distribution. A SEM of zero would mean that every time you took a sample you got the same result – but that does not guarantee that the sampling is error free – there are no systematic biases, or systematic measurement errors. And as Bevington tells you, the closer you get to zero, even the smallest of errors will start to dominate.
Thirdly, As the GUM will have it, there isn’t a “the” true value, there’s a true value. This depends on the definition of the measurand, and it’s impossible to describe that to the infinitesimal level.
Finally, this is a complete red herring from you. Nobody has ever claimed you can get zero uncertainty for a global anomaly average. What we are saying is that in general the uncertainty of a global average reduces the more measurements you have, and does not usually get worse.
“You’re just making it up as go along now, aren’t you.”
“3.3.4 The purpose of the Type A and Type B classification is to indicate the two different ways of evaluating uncertainty components and is for convenience of discussion only; the classification is not meant to indicate that there is any difference in the nature of the components resulting from the two types of evaluation.”
“mea culpa – I forgot to add the word measurement when talking about the equation which is specifically for calculating measurement uncertainty, in a document specifically about measurement uncertainty.”
Malarky! You don’t forget. You consciously avoid its use so you can equivocate and use the SEM as the measurement uncertainty!
tpg: ““You do not *measure* the mean, you calculate it”
bellman: “So you are measuring the mean”
Unbelievable.
“but you don’t think the calculation is a measurement. Are you sure you’ve thought this latest excuse through.”
I have a 4′ board and a 6′ board. Their average is 5′. What do I measure to get 5′? I don’t *have* a 5′ board!!!!
There is NO GUARANTEE that the average of a distribution exists in the real world. Where do I go to measure something that doesn’t exist?
“It’s calculated from other measurements”
You are your own worst enemy. It is CALULATED, not measured!
“calculated the volume of that water tank”
The volume of a tank is a PHYSICAL THING. There are multiple ways to *measure* the volume of a tank. I can *measure* it by comparing to a tank of similar size that I know the volume of – the second tank becomes a “yardstick” if you will.
If I take a collection of tanks of different sizes, however, their “average” may not physically exist at all. So how do I measure that non-physical, non-existing average tank?
“Well there’s the problem. You are claiming the average temperature is not a physical quantity, yet we can measure it. Therefore it is possible to measure something that isn’t physical.”
Stop making stuff up. I never said temperature was not a physical quantity. I said it is an INTENSIVE quality. That doesn’t mean it doesn’t exist. Go take a general science course some day!
“Well for a mean I might take lots of samples and average them.”
Your lack of reading comprehension skills is showing again. What does “quantitatively” mean? Wait, I’ll get it for you:
quantitativeadjectivequan·ti·ta·tive ˈkwän-tə-ˌtā-tiv
1: of, relating to, or expressible in terms of quantity
2: of, relating to, or involving the measurement of quantity or amount
3: based on quantity
(bolding mine, tpg)
“By propagating the measurement uncertainties into the standard combined uncertainty? Or just by taking the average of all the uncertainties?”
You can’t MEASURE uncertainty! That’s why its given as an interval! It’s part of the GREAT UNKNOWN. You seem to have a lot of problem with the concept of the GREAT UNKNOW!
“You’ve stopped talking about measurement uncertainty I see. But as I keep having to remind you the only way for a sample to have a SEM of zero is if the standard deviation is zero, in which cased by your logic it will also have no inaccuracy.”
The standard deviation of the SAMPLE MEANS. Not the sample deviation of any specific sample. And not the standard deviation of the population. THE SAMPLE MEANS. It is a metric for sampling error and not for measurement error or anything else.
“Secondly, the SEM is a description of the sampling distribution.”
It is a metric for sampling ERROR. It doesn’t say anything about the SD of any sample or of the population!
“but that does not guarantee that the sampling is error free”
If the SEM is zero then there is no sampling error. You are jumping from sampling error to *measurement accuracy*. They are *NOT* the same thing! An SEM of zero means you have found the population mean EXACTLY. It does *NOT* tell you anything about the measurement accuracy of that population mean!
“And as Bevington tells you, the closer you get to zero, even the smallest of errors will start to dominate.”
Meaning you can never locate the population mean EXACTLY through sampling! It has nothing to do with measurement accuracy of anything! BTW, *I* was the one that pointed this out to you to being with!
“What we are saying is that in general the uncertainty of a global average reduces the more measurements you have, and does not usually get worse.”
You keep going back to the same meme over and over. Measurement uncertainty is random, Gaussian, and cancels!
The MEASUREMENT UNCERTAINTY does not reduce with more measurements of different things. All you do is locate the population mean more exactly! THAT TELLS YOU NOTHING ABOUT THE MEAUSREMENT ACCURACY OF THAT MEAN.
You didn’t even get it right in this statement: ” but that does not guarantee that the sampling is error free – there are no systematic biases, or systematic measurement errors.”
Systematic biases or systematic measurement errors DO NOT AFFECT THE SEM!
The SEM is a metric for sampling error, and that is all. It tells you how closely you have located the population mean. And it can only be a metric for the measurement uncertainty of the mean if you assume the population mean is 100% accurate. And the only way you can assume the population mean is 100% accurate is to assume that all measurement uncertainty is random, Gaussian, and cancels.
Which is why I say you have this meme so embedded in your brain that you can’t get away from it!
“3.3.4”
Which says nothing about the claim you made. Which was:
Multiple measurements under repeatable conditions are REQUIRED whether you use Type A or Type B measurement uncertainty to describe the quality of the measurement protocol.
“Malarky! You don’t forget. You consciously avoid its use so you can equivocate and use the SEM as the measurement uncertainty!”
Yet then I forgot to actually use the SEM and instead used equation 10. And by the way, the GUM doesn’t even use the word measurement to describe equation 10 – just the combined standard uncertainty. You really are getting quite obsessed.
“Unbelievable.”
You might not believe it, but it’s quite possible to get a measurement by calculating. That’s the point of the combined standard uncertainty.
“I have a 4′ board and a 6′ board. Their average is 5′. What do I measure to get 5′? I don’t *have* a 5′ board!!!!”
If you get to 5 explanation marks I’m going to ring for an ambulance.
Again, are you disagreeing that a calculation can be a measurement? Measurement: set of operations having the object of determining a value of a quantity.
And again, and a gain until you answer. If the average is not a measurand, how can you determine it’s measurement uncertainty?
“Your lack of reading comprehension skills is showing again. What does “quantitatively” mean? Wait, I’ll get it for you”
Amazing how you will highlight the second definition but ignore the first.
Here’s another definitions of quantitatively
And another
“You can’t MEASURE uncertainty! That’s why its given as an interval! It’s part of the GREAT UNKNOWN.”
Uncertainty is not an interval – it’s a parameter – a single value. The GUM says that very clearly
A standard deviation or the half-width of an interval – not the interval itself.
“You seem to have a lot of problem with the concept of the GREAT UNKNOW!”
Because it’s a meaningless catchphrase you’ve just come up with to avoid talking about actual calculations of measurement uncertainty. If it isn’t could you point to where the GUM defines it? The whole point of measurement uncertainty as I see it is to characterize and quantify what you don’t know. You don’t just say I’ve measure something but I’ve no idea what the actual size of the thing I’ve just measured becasue it’s the GREAT UNKNOWN – you state a value that characterizes how much you do know.
“Meaning you can never locate the population mean EXACTLY through sampling!”
Well done, maybe you are beginning to understand. That’s the point of uncertainty – any measurement whether from sampling or any other tool can never tell you EXACTLY what the correct value is. That’s why it’s called uncertainty – it means you are not certain.
“BTW, *I* was the one that pointed this out to you to being with!”
Such a child. If it will stop you whining let’s say you told me first and I learnt from it. Feel better?
“You keep going back to the same meme over and over. Measurement uncertainty is random, Gaussian, and cancels!”
Every time you repeat that lie – I just imagine you stamping your little footsie and screaming “it’s not fair, it’s not fair”. Not sure why?
“The MEASUREMENT UNCERTAINTY does not reduce with more measurements of different things.”
Common sense, and everything you’ve forced me to read on the subject says you are wrong. But use some more capital letters, that will make your argument more persuasive.
“All you do is locate the population mean more exactly! ”
And you still have no idea how mad it seems to have you keep saying that, as if that is not what you want when discussing the uncertainty of the mean.
“And it can only be a metric for the measurement uncertainty of the mean if you assume the population mean is 100% accurate.”
You still can;t grasp that if you are trying to measure the population mean, then the population mean is 100% accurate. Your measurement may not be 100% accurate but it’s meaningless to say the population mean isn’t. It’s like saying no matter how well you measure a piece of wood it’s always possible the piece of wood is not 100% accurate.
“And the only way you can assume the population mean is 100% accurate is to assume that all measurement uncertainty is random, Gaussian, and cancels.“
And there’s that correlation between shouting things in bold and being 100% wrong, again.
“Which is why I say you have this meme so embedded in your brain that you can’t get away from it!”
You do realize you are the only one who keeps repeating that meme?
bellman:”Which says nothing about the claim you made”
tpg: Which was:Multiple measurements under repeatable conditions are REQUIRED whether you use Type A or Type B measurement uncertainty to describe the quality of the measurement protocol.”
Of course 3.3.4 applies! Can’t you read?
“The purpose of the Type A and Type B classification is to indicate the two different ways of evaluating uncertainty components and is for convenience of discussion only; the classification is not meant to indicate that there is any difference in the nature of the components”
tpg: ““The GUM is based on multiple measurand’s, qₖ, taken under repeatable conditions.”
bellman: “You are talking about a Type A evaluation. But you can also use Type B.”
tpg: “Multiple measurements under repeatable conditions are REQUIRED whether you use Type A or Type B measurement uncertainty to describe the quality of the measurement protocol.”
My statement is on target and Sec 3.3.4 says why!
“Of course 3.3.4 applies! Can’t you read?”
obviously not as I can’t see anything in that quote that say you are required to make multiole measurements of the same thing when using a type B uncertainty. Could you highlight it for me?
I mean, it’s only the first sentence in the GUM under type B evaluation 4.3.1
“Uncertainty is not an interval – it’s a parameter – a single value. The GUM says that very clearly”
JCGM: NOTE 1 The parameter may be, for example, a standard deviation (or a given multiple of it), or the half-width of an interval having a stated level of confidence.” (bolding mine, tpg)
Once again you are caught cherry picking without understanding context. Read the highlighted part above.
The “parameter” is AN INTERVAL!
Can you *ever* get anything right? You’ll never get anything right as long as all you do is cherry pick.
“A standard deviation or the half-width of an interval – not the interval itself.”
OMG! A standard deviation IS AN INTERVAL. The half-width of an interval describes THE INTERVAL!
You simply aren’t worth the time it takes to post anything!
Bye!
He’s delusional, sees things that aren’t there.
The GUM tells you to report ±U!
But it recommends you don’t. That was my point. Personally I prefer the ± shorthand, but it dies require you know exactly what it represents.
“The “parameter” is AN INTERVAL”
no it isn’t. The parameter is a measure of the interval, not the interval itself. The width of a half interval. The width is a single value. The interval is a set of numbers.
A size is not an interval, a standard deviation is not an interval. They can be used to describe an interval, but that doesn’t mean they are intervals. This is the same lack of understanding that leads you to think standard deviations can be negative.
“You simply aren’t worth the time it takes to post anything!”
How many lengthy post have you addressed to me since the last time you said that a few hours ago? Your promises are about as worthless as most of your arguments.
Read this very carefully.
I’ll paraphrase.
An evaluation of variance of differences among samples.
This is what NIST TN1900 did along with ignoring measurement uncertainty which is evaluated by:
Which is how measurement uncertainty is determined for a single sample. NOAA has already published information about this. ASOS is has a type B of ±1.8°F.
What do you think an average global temperature is? An attempt to discover the property of the temperature of the earth in general, or an attempt to discover the temperatures of a specific earth?
All that section you keep repeating, is saying is that just taking a biog sample from one specific object will not necessarily tell you about the general property. If you want to determine the density of gold, measuring one gold bar 100 times isn’t the same as measuring 100 different gold bars. Measuring the same bar is not giving 100 independent observations. Taking the 100 reading of temperature at one location on earth is not as a reliable way of determining the global average as taking 100 readings randomly spread across the globe.
“What do you think an average global temperature is? An attempt to discover the property of the temperature of the earth in general, or an attempt to discover the temperatures of a specific earth?”
You forgot to include: “an evaluation of a component of variance arising from possible differences among samples must be added to the observed variance of the repeated observations “
You *have* to read and understand it ALL, not just cherry pick pieces.
Where does climate science evaluate a component of variance arising from possible differences among samples? Where does it add that component of variance to the observed variance of the repeated observations? Where does climate science even evaluate the OBSERVED VARIANCE of the repeated observation?
Where do *YOU* do all of these? EVER?
“All that section you keep repeating, is saying is that just taking a biog sample from one specific object will not necessarily tell you about the general property.”
Temperature is *NOT* a general property! It is an intensive attribute! Enthalpy is a general property but climate science adamantly refuses to even begin to use enthalpy even though the data for doing so has been available for 40 years or more.
” If you want to determine the density of gold, measuring one gold bar 100 times isn’t the same as measuring 100 different gold bars.”
What do you think we’ve been telling you? Density is an intensive property. You can’t measure 100 different gold bars and use the average as some kind of “general property”.
“Measuring the same bar is not giving 100 independent observations.”
Of course the observations can be independent! The next measurement just can’t be dependent on the prior measurement. If your measuring device AFFECTS the measurand, then the next measurement *will be* dependent on the prior measurement. That simply doesn’t apply to temperature, or at least it shouldn’t in a properly designed thermometer. The next temperature reading should *not* be dependent on the prior reading. That’s why when calibrating a thermometer you have to wait for an equilibrium state. The temperature of the water bath can change if you stick something in it that is of a different temperature. You have to wait for equilibrium. It’s why you don’t put all of your food in a fryer at the same time, it will change the cooking temp!
“Taking the 100 reading of temperature at one location on earth is not as a reliable way of determining the global average as taking 100 readings randomly spread across the globe.”
But climate science says you can track changes in the global climate by taking readings at the same location!
You need some basic science training as well as algebra and calculus training. 100 readings around the globe of an intensive property will *not* tell you anything useful. Just as taking 100 density readings from 100 different gold bars will tell you anything about the general density of gold bars. You do understand why assay offices exist, right?
“You *have* to read and understand it ALL, not just cherry pick pieces.”
Yes you do.
The part you quote is conditional on the question I was asking.
None of them say the average uncertainty is the uncertainty of the average unless the uncertainty is random, Gaussian, and cancels.
NONE OF THEM!
Using that assumption on EVERYTHING, as you and climate science do, means there wouldn’t be any use in worrying about the uncertainty – EVER, FOR ANYTHING!
That’s not real world. That’s blackboard statistics world.
Nobody says the average uncertainty is the uncertainty of the average. (The only person who seems to think that is Pat Frank. Why do you have this odd delusion, and why do you always ignore me every time I explain why it isn’t?
“Using that assumption on EVERYTHING, as you and climate science do, means there wouldn’t be any use in worrying about the uncertainty – EVER, FOR ANYTHING!!”
Could you rewrite that in words that make sense?
“Nobody says the average uncertainty is the uncertainty of the average.
Then why do you keep trying to calculate the average uncertainty? It’s even less useful than the SEM! It’s pretty obvious that you think the average uncertainty is the uncertainty of the average.
(The only person who seems to think that is Pat Frank. Why do you have this odd delusion, and why do you always ignore me every time I explain why it isn’t?”
You’ve never understood what Pat Frank has done. You simply don’t have the expertise in metrology to make any kind of judgement on his papers.
I’ll say it again. You very obviously put some kind of importance on the average uncertainty since you spend so much time defending it as a meaningful value. You keep trying to tell us that u_c(y) / n is *NOT* the average uncertainty when it can’t be anything but that!
It’s not the SEM, nor is it a useful metric for the measurement uncertainty is a set of measurements.
So just *why* are you so adamant about saying u(y)/n is *NOT* the average uncertainty when it so obviously *IS*?
“Then why do you keep trying to calculate the average uncertainty?”
Do you ever read anything I’ve actually said. You’ve asked this question dozens of times in the last few days and thousands of times over the last three years, and still never seems to remember the answer.
I am not calculating the average uncertainty. If you want an explanation as to why I am not, please go back over previous times I’ve explained it to you. At this stage you can only be trolling, or showing signs of severe memory loss. Or you could just be a complete idiot …
“u_c(y) / n is *NOT* the average uncertainty when it can’t be anything but that!”
Dividing something by n does not make it an average. That is only an average uncertainty if u_c(y) is the sum of n uncertainties, which it never is, unless you follow the Pat Frank route and assume uncertainties just add – i.e. using RSM when all the uncertainties are identical.
I see, so as long as you understand what you mean who cares if you follow standards? From the GUM on stating measurements with standard combined uncertainties.
And then there’s that article Jim keeps posting pointing out the confusion as to whether you are describing an uncertainty of the mean or the standard deviation.
“It’s why some scientists are beginning to just specify the possible interval and leave off the estimated value.”
You keep claiming that – do you have any evidence. As I’ve said it seems a problem if the uncertainty interval is not symmetric.
“So why even bother giving an estimated value!”
Maybe because people want to use your results, and it’s easier to use a single value than an interval.
“It doesn’t matter how you get there, the uncertainty interval is a statement of the GREAT UNKNOWN.”
This is as bad as Pat Frank’s zones of ignorance. Are you really saying you don;t care if an interval represents a standard deviation, of a k = 3 expanded interval? If you don;t think the uncertainty represents anything why even quote a figure – just say you’ve no idea what the actual figure is and tell your customers it’s all part of the great unknown?
“I see, so as long as you understand what you mean who cares if you follow standards? From the GUM on stating measurements with standard combined uncertainties.”
Unbelivable! Cherry picking again!
Why do you think everyone has been telling you that some of science is moving away from even giving an estimated value and just giving an interval? No plus, no minus, just an interval!
Do you think you are the first one to find this out???
“And then there’s that article Jim keeps posting pointing out the confusion as to whether you are describing an uncertainty of the mean or the standard deviation.”
That’s because what you do depends on what you are doing. You can’t even state the assumptions Possolo made in TN1900. And yet you think you understand what he did?
You’ve been asked at least a dozen times to list out the assumptions Possolo made. YOU’VE REFUSED EVERY TIME!
Until you can list those out AND understand why he made them you have no idea of what is going on with calculating uncertainties.
One must read the GUM carefully and understand what it is saying.
GUM 4.2.2
In other words, qₖ is the multiple values of the measurand that were observed.
GUM 4.2.3
Please note what μ_q stands for. It is the estimation of the mean of data points that make up q. In other words, it is equivalent to the mean of a sample means distribution.
Basically,
To describe what occurs, a measure may be:
10 ± 1, where ±1 is the experimental SD.
Now let’s make the experimental SD of the mean ±0.1. That would mean the interval could be 8.9 – 10.9 (9.9 ± 1) OR 9.1 to 11.1 (10.1 ± 0.1). The experimental SD of the mean is small enough that using Significant Digit rules, the interval remains 9 – 11!
“One must read the GUM carefully and understand what it is saying.”
Something I think you and your brother could take to heart.
“GUM 4.2.3”
I notice you didn’t highlight the part that says
“either” referring to either the variance of the mean, or the standard deviation of the mean.
“the experimental standard deviation defines the interval of measurements attributed to to mean”
This is where you are trying to interpret the definition of measurement uncertainty in a way that makes no sense to me. The definition that it’s a parameter “that characterizes the dispersion of the values that
could reasonably be attributed to the measurand”.
You keep changing this to “interval of measurements attributed to the measurand”. Your claim seems to be that this means all measurements that went into producing the mean. Not, as I would interpret it, all values it’s reasonable to think the measurand could have.
“To describe what occurs, a measure may be:
10 ± 1, where ±1 is the experimental SD.”
As I’ve said before, I don’t think this entirely wrong. You can describe an SD as an interval 10 ± 1, I just don’t think it makes sense to call this the uncertainty of the mean. This is why I was telling Tim it’s not a good idea to just write a ± interval, without describing exactly what it represents.
“and, the experimental standard deviation of the mean describes where that interval may lay.”
I think what you are describing here is a prediction interval – an interval within which you might expect the next value to lie with an appropriate confidence level.
Both this and the confidence interval are useful – I just don’t see how a prediction interval could be described as the uncertainty of the mean.
If you are describing the uncertainty of a global average temperature, the uncertainty is the range of values the actual global temperature might lie, not the range of values you are likely to find across the world. If the question is, is it on average hotter this year than last year, knowing there is a ± 20°C range of temperatures across the globe isn’t going to be of much use. We could enter a new ice age next year and you could still be arguing it’s within the range of uncertainty.
“either” referring to either the variance of the mean, or the standard deviation of the mean.”
You ONLY use the SEM when you have multiple measurements of the same thing using the same device under the same conditions with no systematic bias. That’s the standard deviation of the SAMPLE means using only the stated values.
*You* want to assume *everything* meets that definition. It doesn’t. That’s why Possolo made the assumptions he did. Which you refuse to acknowledge even exist!
“knowing there is a ± 20°C range of temperatures across the globe isn’t going to be of much use.”
That’s because you refuse to accept that the variance of a distribution is a measure of the uncertainty of the mean, that is – of its ACCURACY.
You keep wanting to substitute how precisely you can locate the mean, the SEM, for the uncertainty of the mean, meaning its accuracy!
You still haven’t figured out the difference between precision and accuracy!
It simply doesn’t matter if the SEM is 0 (zero) if it is inaccurate. At least not in the real world mot of us not in climate science or statistics world inhabit.
“That’s because you refuse to accept that the variance of a distribution is a measure of the uncertainty of the mean, that is – of its ACCURACY”
No I don’t – and you simply stating it won’t make it true. Are you sure you mean accuracy?
accuracy of measurement
“It simply doesn’t matter if the SEM is 0 (zero) if it is inaccurate.”
If the SEM is zero than so to is the variance of it’s distribution. How does your measure of accuracy work then?
“No I don’t – and you simply stating it won’t make it true. Are you sure you mean accuracy?”
I absolutely mean accuracy. I’ve given you a picture of two distributions with different variances at least twice. The smaller the variance the more peaked the distribution becomes around the mean. The more peaked it becomes the fewer values there are that the average can take on. The wider the variance the less peaked the distribution is around the mean, and the implication is that there is a wider set of values that the mean could actually take on.
It’s why even a perfect Gaussian distribution REQUIRES that the mean and the variance be given. Your predilection, as well as climate science’s, to just ignore the variance of a measurement distribution is just one more symptom of the meme “that all measurement uncertainty is random, Gaussian, and cancels” – so that the variance of the distribution can be ignored.
“If the SEM is zero than so to is the variance of it’s distribution. How does your measure of accuracy work then?”
No, the standard deviation of the sample means does *NOT* tell you the standard deviation of the population, it only tells you the interval in which the average will lie. As usual, you ignore the variances of the samples and only look the means of the samples. The variances of the samples is a clue to how accurate *their* means are – and by ignoring those variances you are assuming all the sample averages are 100% accurate!
Assuming the sample means are 100% accurate is a move by a blackboard mathematician living in statistics world.
In the real world the SEM itself has an uncertainty propagated from the elements in the samples.
When was the last time you *ever* took variance of a distribution into account?
You *still* haven’t figured this one out. Do I need to put up the graph showing that the SEM is *NOT* the variance of the population for you one more time?
“I absolutely mean accuracy.”
Then what definition of accuracy are you using? Not eh one from the GUM or VIM.
“I’ve given you a picture”
Not a definition – and if it’s the one involving arrows in a target – out of date.
“The smaller the variance the more peaked the distribution becomes around the mean. The more peaked it becomes the fewer values there are that the average can take on. The wider the variance the less peaked the distribution is around the mean, and the implication is that there is a wider set of values that the mean could actually take on.”
That’s precision – now what about accuracy?
“It’s why even a perfect Gaussian distribution REQUIRES that the mean and the variance be given. ”
What has that got to do with accuracy? You are just describing the whole point of calculating the SEM, to estimate the deviation in the sampling distribution.
“Your predilection, as well as climate science’s, to just ignore the variance of a measurement distribution”
All you’ve done here is switch from the precision of the mean to the precision of the individual measurements. How does that relate to you saying this is the accuracy of the mean?
“No, the standard deviation of the sample means does *NOT* tell you the standard deviation of the population, it only tells you the interval in which the average will lie.”
If the population mean is not zero you are not going to get a SEM of zero. But thanks again for pointing out the SEM tells you the likely range in which the average will lie. You for some reason want to think that’s not a useful thing to know when considering how confident you are about your estimated average.
“As usual, you ignore the variances of the samples and only look the means of the samples. The variances of the samples is a clue to how accurate *their* means are”
Yes, in as far as you can estimate the SEM by dividing the standard deviation of the sample by √N. That’s a pretty big clue.
“and by ignoring those variances you are assuming all the sample averages are 100% accurate!”
Who’s ignoring it, you need the standard deviation of the sample to estimate the SEM. And of course nobody is assuming the average of your sample is 100% accurate, and not if you have multiple samples either. Why do you think statisticians care about the SEM – it’s because you know the the average of the sample is not accurate.
“Assuming the sample means are 100% accurate”
If you’ve taken hundreds of different samples and got identical averages for each then you would have to assume that either the population consisted of identical values, or there was something wrong with your sampling procedure.
“a move by a blackboard mathematician living in statistics world”
We all live in a statistical world, it’s just many don’t realize it.
“You *still* haven’t figured this one out. Do I need to put up the graph showing that the SEM is *NOT* the variance of the population for you one more time?”
You really do come of as the most patronizing and delusional fool here. You don;t have to do that because everyone else with a gram of understanding knows this. Any body who tells you that SEM = SD / √N is telling you that the population standard deviation is not he same as the SEM (unless N is 1 of course), and anyone who understands that variance is the square of the standard deviation knows that the variance is even less likely to be the same as the SEM (unless N = 1 and the population SD = 1).
“Then what definition of accuracy are you using? Not eh one from the GUM or VIM.”
It’s EXACTLY their definition that I am using – which you refuse to believe.
3.3.1 The uncertainty of the result of a measurement reflects the lack of exact knowledge of the value of the measurand (see 2.2). The result of a measurement after correction for recognized systematic effects is still
only an estimate of the value of the measurand because of the uncertainty arising from random effects and from imperfect correction of the result for systematic effects.
“Not a definition – and if it’s the one involving arrows in a target – out of date.”
Nope. See the attached. The SEM is the interval in which the SAMPLE MEANS can lie. The UNCERTAINTY of the mean is the standard deviation (or an expansion of such) around the mean.
I’ve attached another copy. The SEM is *NOT* the uncertainty of measurement that characterizes the dispersion of the values that
could reasonably be attributed to the measurand
Are you really that incapable of learning even basic math?
“That’s precision – now what about accuracy?”
No, that is ACCURACY! A wider interval of values that can be reasonably assigned to the mean the less accurate any estimated value of the mean becomes.
“What has that got to do with accuracy?”
Because variance tells you about the dispersion of values around the mean! Stop being a sealion!
“You are just describing the whole point of calculating the SEM, to estimate the deviation in the sampling distribution.”
The distribution of the sample means is *NOT* the distribution of values around the population mean nor is it the distribution of sample values around the sample mean! Stop being a sealion!
“Yes, in as far as you can estimate the SEM by dividing the standard deviation of the sample by √N. That’s a pretty big clue.”
But that standard deviation of the sample IS ONLY AN ESTIMATE OF THE POPULATION STANDARD DEVIATION! Being an estimate it *also* has uncertainty! This goes back to you thinking that samples all have to be iid with themselves and the population – THEY DON’T! If all the samples have identical means and variances, the definition of iid, then the SEM would be ZERO.
“Who’s ignoring it, you need the standard deviation of the sample to estimate the SEM.” (bolding mine, tpg)
From the GUM. Note the difference between s(tₖ) and s(t̅).
In Section 4.2.2 –> s(qₖ) is the experimental standard deviation and characterize the variability of the observed values qₖ, or more specifically, their dispersion about their mean q̅.
In Section 4.2.3 –> s(q̅) is the experimental standard deviation of the mean and quantify how well q̅ estimates the expectation µ_q of q.
q is defined in Section 4.2.1 as a set of observations qₖ.
Believe me, the JCGM group would not have duplicated the wordsp “dispersion” if they did not expect it to mean the mean q̅.
“Are you really that incapable of learning even basic math?”
Patronizing ad hominem aside, I donlt think the problem agt this point is your maths, it’s the language. The problem is in interpreting the GUM definition of uncertainty.
I read it as meaning that the uncertainty of the mean is a value that characterizes the dispersion of values that can be attributed to the mean – that is the values that the mean could reasonably be.
If the mean is 100 and the uncertainty of the mean is 2, then it’s reasonable to say the actual mean could be anything from 98 to 102.
You seem to be interpreting the definition to mean the dispersion of all the values that went into calculating the mean. So that if the SD was 20, then you are saying it’s reasonable to say any of the values that determined the mean could be between 80 and 120, even though it is not reasonable to say the mean could be as low as 80, or as high as 120.
I can see why you might just about be able to read the definition that way, and it’s obvious why you want to interpret it that way. It just doesn’t make any sense to me. And is obviously wrong when you consider how they define the uncertainty of the mean in 4.2.3, or following equation 10.
It also ignores the alternative “not inconsistent” definitions such as
or
“I read it as meaning that the uncertainty of the mean is a value that characterizes the dispersion of values that can be attributed to the mean – that is the values that the mean could reasonably be.”
The MEASUREMENT UNCERTAINTY of the mean is a parameter that characterizes the dispersion of the values that could reasonably be attributed to the measurand.
This is *NOT* the SEM. Far more values can be reasonably attributed to the mean than just the standard deviation of the sample means.
This is why we are discussing the MEASUREMENT UNCERTAINTY of the mean and why you need to start using that term – MEASUREMENT UNCERTAINTY.
“If the mean is 100 and the uncertainty of the mean is 2, then it’s reasonable to say the actual mean could be anything from 98 to 102.”
If the MEASUREMENT UNCERTAINTY of the mean is +/- 5 then the interval associated with that would run from 95 to 105.
“You seem to be interpreting the definition to mean the dispersion of all the values that went into calculating the mean.”
That *IS* what determines the MEASUREMENT UNCERTAINTY of the mean!
The standard deviation of the sample means is *NOT* the uncertainty of the mean. It’s a metric of the sampling error.
You *NEED* to start using unambiguous terms. If you start calling the standard deviation of the sample means that and abandon the ambiguous “uncertainty of the mean: and start referring to the measurement uncertainty as *measurement uncertainty” then perhaps the conversation can proceed with a common understanding.
“ then you are saying it’s reasonable to say any of the values that determined the mean could be between 80 and 120, even though it is not reasonable to say the mean could be as low as 80, or as high as 120.”
What in Pete’s name do you think the standard deviation of a distribution DESCRIBES? The greater the variance the greater the number of possible values the mean can take on.
Remember, you aren’t trying to locate the mean of a distribution as precisely as possible, you are trying to arrive at an estimated value for the measurand and then specify the possible range of values that measurand could take on. And if the reasonable values for that measurand range from 80 to 120 then so be it!
You simply cannot locate that mean any more precisely then the precision and uncertainty of the individual measurements allow. The precision can’t be more then the measurement with the least precision and the most uncertainty. It is the least precision and most uncertainty that determines where the GREAT UNKNOWN begins!
“I can see why you might just about be able to read the definition that way, and it’s obvious why you want to interpret it that way. It just doesn’t make any sense to me.”
That’s because you obviously have *NO* real world experience with measurements, how they are made, and what they are made with. Again, the goal of measurements is to provide something you can use in the real world stated in a manner that someone else measuring the same thing can determine if both measurements are reasonable. If you say you measured something as 50 +/- .000001 by calculating the SEM of 1000 measurements using a Fluke voltmeter and someone else duplicated your measurement and came up with 51 they would think their meter must be bad. If, instead, you specify the measurement as 50 +/- 2% because that is the uncertainty of the meter and, therefore, of the measurements, they would say their measurement matches yours.
“And is obviously wrong when you consider how they define the uncertainty of the mean in 4.2.3, or following equation 10.”
“a measure of the possible error in the estimated value of the measurand as provided by the result of a measurement”
How in Pete’s name are you reading this as meaning you can substitute the sample error metric for the measurement uncertainty?
“an estimate characterizing the range of values within which the true value of a measurand lies”
How in Pete’s name are you reading this as saying you can substitute sampling error for the measurement uncertainty?
The interval in which the true value can lie is determined by the VARIANCE of the data, not by how precisely you can locate the mean!
“This is why we are discussing the MEASUREMENT UNCERTAINTY of the mean and why you need to start using that term – MEASUREMENT UNCERTAINTY.“
I think we keep falling over ourselves with definitions. I’m not sure what what you mean specifically by “measurement” uncertainty as opposed to some other type of uncertainty. I had assumed you meant only that part of uncertainty that comes directly from measurements – e.g measurement errors in a thermometer. Which can then be propagated to the mean as a combined standard uncertainty, using equation 10.
I’ve been trying to make the distinction between that sort of uncertainty, and the statistical uncertainty that comes from the mean being a random sample which is used to estimate the population mean. e.g. the SEM.
But, on reflection, it might be that you can take measurement uncertainty to be any uncertainty associated with the measured value – the mean in this case. Which means the SEM would be the measured uncertainty. This is the approach taken in that TN1900 example you keep going on about.
“If the MEASUREMENT UNCERTAINTY of the mean is +/- 5 then the interval associated with that would run from 95 to 105.”
You do like to keep bringing up these distractions. As you should be aware by now the uncertainty cannot be ±5 – uncertainty is always positive. Nor can it be in interval. It is a single value that describes the interval. So I’ll just assume you mean you have an expanded uncertainty of 5, with a specified coverage factor.
“That *IS* what determines the MEASUREMENT UNCERTAINTY of the mean!”
It isn’t.
If you want any more explanation it *IS NOT*.
“The standard deviation of the sample means is *NOT* the uncertainty of the mean.”
Agreed. It’s the standard error of the mean that is the uncertainty of the mean. Whether it’s the measurement uncertainty depends on your definition.
“What in Pete’s name do you think the standard deviation of a distribution DESCRIBES?”
It describes the (biased) average deviation of values in that distribution.
“The greater the variance the greater the number of possible values the mean can take on.”
That depends on sample size. A sample of 1000000 values taken from a population with a standard deviation of 100 can only reasonably take on a range of ±0.2 with 95% confidence. With a standard deviation of 0.1. A sample of 25 values from a population with a standard deviation of 10, can take on with 95% probability a range of ±4, with a standard deviation of 2.
“Remember, you aren’t trying to locate the mean of a distribution as precisely as possible”
Why not?
“you are trying to arrive at an estimated value for the measurand and then specify the possible range of values that measurand could take on.”
Which is what the SEM does – and to correct your fudge it’s the range of reasonable values, not possible values.
“And if the reasonable values for that measurand range from 80 to 120 then so be it!”
But if that’s the 95% interval for the population and your estimate for the mean is based on a large sample it’s not remotely reasonable to thing the measurand could lie anywhere in the range.
“You simply cannot locate that mean any more precisely then the precision and uncertainty of the individual measurements allow.”
How many more times are you just going to assert nonsense like this. I don’t care how strongly you believe it – I don’t and you need to provide an argument for why it is true if you want to convince me, or anyone who understands probability and statistics.
“The precision can’t be more then the measurement with the least precision and the most uncertainty.”
And you need to define what you mean by precision and what sort of uncertainty you are talking about. Half the time you are talking about the standard deviation of the population, and now you switch to talking about the precision of an individual measurement. And it doesn’t make sense in either case. And at the same time could you provide a definition of “GREAT UNKNOWN”. At the moment it just sounds like you are describing your understanding of all this.
“Again, the goal of measurements is to provide something you can use in the real world stated in a manner that someone else measuring the same thing can determine if both measurements are reasonable.”
Which is a pretty terrible goal. Maybe try measuring something so you can use the results of the measurement next time.
If someone measures the global temperature anomaly, I’d hope it was used for more than just seeing if someone else could get the same result. I’d like to know things like is it getting bigger or smaller over time.
“How in Pete’s name are you reading this as meaning you can substitute the sample error metric for the measurement uncertainty?”
I’m quoting the GUM as saying those definitions are “not inconsistent” with their preferred definition of uncertainty (of measurement).
“The interval in which the true value can lie is determined by the VARIANCE of the data”
By it’s standard deviation. That is the standard error of the mean.
“No, that is ACCURACY! A wider interval of values that can be reasonably assigned to the mean the less accurate any estimated value of the mean becomes. ”
No it isn’t. Precision describes how close values are to each other, just as the standard deviation does. But that does not mean they are necessarily close to the target – i.e. the value of the measurand. If you have a systematic error in all your measuremnts your SD could still be small, but the mean of your values could still be way of. That’s trueness. To be accurate the measurements have to be both precise and true.
Not that this is the main problem with your argument. You are confusing the precision of the individual measurements with the precision of the mean.
“The SEM is the distribution of the sample MEANS, plural”
Only in your mind. Every source I can find calls it the standard error of the mean, singular. Taylor calls it the standard deviation of the
mean, singular. The GUM talks about the experimental standard deviation of the mean, singular.
It describes a sampling distribution. You can think of that as being an infinite number of different sampling means, just as a random variable can be though of as the distribution of an infinite number of random values. But it’s use is to tell you how much your one sample mean is likely to differ from the population mean.
“it is defined as the POPULATION STANDARD DEVIATION DIVIDED BY THE SAMPLE SIZE for multiple samples.”
That is not how it’s defined. That is a calculation you can make to determine it if you knew the population standard deviation. (and one day you are going to take the hint about not writing everything in capitals. It just makes everything you write difficult to read).
“one sample has one mean. You can’t get a distribution from one value”
But you know it comes from a random distribution – that of the sampling distribution.
“But that ESTIMATE carries significant uncertainty with it since no sample will ever match the population exactly,”
Which is another reason why the larger the sample the better.
“no matter how large the sample”
The larger the sample the smaller the standard error of the standard deviation.
“(remember your quoting of Bevington?)”
That’s not what Bevington says – provide a quote if I’m wrong.
The point II was quoting is saying (a) that there is a law of diminishing returns with sample size – you are dividing by the square root of sample size. To get one extra decimal place you need a sample size of 100, to get 2 you need a sample of 10,000, 3 requires 1,000,000. And (b) even if you could theoretically take a large enough sample to get a silly level of precision, it won’t work because there will certainly be small systematic errors that will end up dwarfing your fine precision.
“This means that not only will you not know the measurement accuracy of the population mean from sampling”
You won’t know the accuracy just from sampling as that won’t tell you the trueness of the measurements.
“you will never be able to precisely locate the population mean no matter what you do”
Handwaving. How precisely do you want your figure? Statistically you need enough precision to be able to have a reasonable chance of detecting a significant difference between populations. Whilst larger samples will be more precise, there’s often a trade off with cost, and practicality and ethics. You use the smallest sample which is likely to get the best result. No point in testing a drug on 10000 patients if 20 will demonstrate a significant result.
I imagine it’s the same with your measurement examples. You have to measure everything multiple times to get a good experimental standard deviation of the mean, but you are not going to measure the same thing thousands of times if you only need a rough idea of it’s size.
“If you take enough samples (plural) you do not have to “estimate” the SEM”
You still don’t get the problem with doing that – 100 samples each of size 100 could just as well be a single sample of size 10000 which will be much better than the SEM of a sample of 100. Why would you want to throw away 99% of your measurements just to say you now how good anyone of your samples was? And if you do the obvious thing and pool all t=your hundred means, you are just getting a sample of 10000, and will have to calculate its SEM because it won’t be the same as that for a sample size of 100.
And you are still estimating the SEM. Just as you are estimating the population standard deviation from the sample standard deviation.
As I keep saying though, what you can do is bootstrapping or other techniques, which use your single sample as if it was a large number of samples. This is possibly going to give you a better estimate for the SEM, especially if your sample size is small and the distribution is a long way from normal.
You keep going on about how statisticians use the SEM, but I’m not sure how true this is nowadays. The SEM dates from a time when calculations were done by hand, and the best option is to make reasonable assumptions about your data ans get a reasonable result. But with modern computing power there are lots of different techniques that are better at modelling complex data and models.
“No it isn’t. Precision describes how close values are to each other, just as the standard deviation does.”
You *still* don’t get precision and accuracy!
The standard deviation doesn’t describe precision. It describes the spread of the data values. Precision describes the individual data points and how many decimal points you could determine for each.
Precision in locating the mean of the sample means does not describe accuracy, it only describes how how close the sample means are together.
“Only in your mind. Every source I can find calls it the standard error of the mean, singular. Taylor calls it the standard deviation of the
mean, singular. The GUM talks about the experimental standard deviation of the mean, singular.”
If all you have is one sample you cannot create a distribution of the sample meanS. If all you have is one sample then you have to use it’s standard deviation as an estimate of the deviation of the population.
Just how close is the standard deviation of that one sample to the standard deviation of the population?
Ans: YOU DON’T KNOW!
“The standard deviation doesn’t describe precision. It describes the spread of the data values. Precision describes the individual data points and how many decimal points you could determine for each.”
Then you need to be clear about what definition you are using. I’m assuming you mean the ones used in metrology, the ones people go on about with all those pictures of arrows missing the target.
I’m taking precision to mean how closely measurements of the same thing agree with each other, even though they might all be far from the target.
Accuracy can either mean how close the average of all the measurements is to the correct value, but the VIM defines this as trueness, and uses accuracy to mean a combination of trueness and precision, that is how close a measurement is to the true value.
Precision in that sense is exactly what’s described by the standard deviation, the spread of values around the mean, but not saying if the mean is correct. Precision is about random errors, trueness is about systematic errors.
JCGM 200:2012
The objective of measurement in the Uncertainty Approach is not to determine a true value as closely as possible. Rather, it is assumed that the information from measurement only permits assignment of an interval of reasonable values to the measurand, based on the assumption that no mistakes have been made in performing the measurement
The objective of measurement is then to establish a probability that this essentially unique value lies within an interval of measured quantity values, based on the information available from measurement.
Precision of measurement has to do with repeatability of achieving the same measurement under repeatable conditions. It is part of what gauge blocks are used to determine. It is part of measurement uncertainty.
You will notice NOTE 1 defines what we have been trying to tell you. Standard deviation & variance are used to express the uncertainty.
These should lead you to see that the correct interval is one containing measurements and not one that is showing a smaller and smaller interval where the mean lays.
“You will notice NOTE 1 defines what we have been trying to tell you. Standard deviation & variance are used to express the uncertainty.”
I‘m not disagreeing with that. It’s Tim who’s saying the standard deviation establishes accuracy, not precision:
“””””If the SEM is zero than so to is the variance of it’s distribution. How does your measure of accuracy work then?”””””
Dude, the standard deviation of the sample means distribution has a term (μ_i – u̅)^2. If all the μ_i = a then u̅ = a and the SEM is zero. You get “a” ±0. The sampling was perfect and the mean of the sample means is exactly the same as the population mean.
You need to read Taylor, Bevington, and others and what they say about the results of the SEM –> 0.
Real functional relationships have fixed sample size.
A = l•w –> has 2 variables.
PV = nRT –> has 4 variables.
Read GUM 4.2.1 again.
“””””the best available estimate of the expectation or expected value µq of a quantity q that varies randomly [a random variable (C.2.2)], and for which n independent observations qk have been obtained under the same conditions of measurement”””””
This is n observations of (A = l•w) or (PV = nRT)
“If all the μ_i = a then u̅ = a and the SEM is zero”
All you are saying here is that if you took an infinite number of samples of a given size and they all had identical averages the SEM is zero. But my point is that can only happen if the sample size is infinite or the standard deviation of the population is zero – that is the population consist of identical values (as well as requiring no random uncertainty in the measurements). And you want to use the standard deviation as a measure of the accuracy of the mean – so if the SEM is zero, so to is your accuracy measure (which does not mean the result cannot be inaccurate – you might have a systematic error in you measurements, or your sampling procedure might be biased.)
“Real functional relationships have fixed sample size.”
Including the ones for an average.
“Read GUM 4.2.1 again.”
Why do you keep ignoring what I’m telling you. You are talking about doing a type A evaluation.
“But my point is that can only happen if the sample size is infinite or the standard deviation of the population is zero “
It is unlikely but it *can* happen without an infinite sample size or an SD of zero. Again, can you throw heads ten times in a row?
“that is the population consist of identical values (as well as requiring no random uncertainty in the measurements).”
Since the SEM is calculated by statisticians from only the estimated values while ignoring measurement uncertainty the measurement uncertainty simply doesn’t apply. You can have the *same* estimated value for any number of measurements – but that does *not* mean they are “true values”.
“And you want to use the standard deviation as a measure of the accuracy of the mean – so if the SEM is zero, so to is your accuracy measure (which does not mean the result cannot be inaccurate – you might have a systematic error in you measurements, or your sampling procedure might be biased.)”
Ill never understand why this is so hard for you to comprehend. I’ll try one more time.
Suppose you have the entire population of a subject (perhaps 1000 temperature readings from 1000 different stations), 1000 data entries, all of them true values. You can calculate the mean and standard deviation of that population out to a million decimal places if you want. You can use that standard deviation to calculate an SEM value.
Now suppose you pull 10 samples of size 100 from that population. The SEM, calculated using the population standard deviation which is accurate out to a million decimal places, will tell you that those sample means will NOT be the same, they will have a variation. And that variation is the SEM.
The SEM only tells you the variation of the sample MEANS. It doesn’t tell you the standard deviation of any sample nor does it tell you the standard deviation of the population.
It is the standard deviation of the sample that determines how accurate the mean of the sample is. It is the standard deviation of the population that tells you how accurate the mean of the population is. Neither of which is the SEM.
Now suppose each of those measurements have an attached measurement uncertainty. For simplicity just assume the total measurement uncertainty is a direct sum. The total measurement uncertainty *is* a measure of the variance (standard deviation) of the population. It may be in addition to the actual variance of the estimated values but it is still a metric for the standard deviation.
When you calculate (total uncertainty)/sqrt(n) you ARE calculating an SEM, i.e. the variation in the sample means you would get if you pull multiple samples from the population. That is *NOT* the accuracy of the mean, it is only how precisely you have located the mean of the population, the smaller the SEM, the more precisely you have located the population mean. It simply does not tell you the accuracy of the population mean, that accuracy is based on the total measurement uncertainty, either calculated from the measurement uncertainty intervals. from the variation in the data itself, or a combination of the two.
The global temperature data base is ONE sample. To calculate an SEM from one sample you then must use the standard deviation of the sample as an estimate of the population standard deviation – an estimate that will have its own uncertainty interval. The SEM then becomes the (standard deviation of the sample)/sqrt(n). That *still* only tells you that if you pull other samples from the population that their means will vary based on the SEM.
The SEM is a metric for SAMPLING ERROR. It has nothing whatsoever to do with the actual accuracy of anything.
I simply stand amazed at the fact that climate science has gotten away with using the SEM as a measurement uncertainty value. It is *NOT* such a metric, not even if all the temperature measurements are assumed to be 100% accurate!
And here you are defending the SEM as a measurement uncertainty metric.
Go study Taylor, Bevington, Possolo, and the GUM for meaning and understanding. Stop just browsing them as cherry-picking sources.
“It is unlikely but it *can* happen without an infinite sample size or an SD of zero. Again, can you throw heads ten times in a row?”
You keep demonstrating you have a problem with probabilities. As I said the odds on throwing 10 heads is 1 in 1000. But for a sample of a reasonable size to have identical values, when those values are not binary quickly becomes all but impossible. The chances of throwing the same number with 10 dice is 1 in 10,000,000. For a more realistic sample say of 25 it’s less than 1 in 10^18. And that’s with just 6 discreet values.
But again this is missing my point. You want to claim the standard deviation is the “accuracy” of the mean, and then talk about a SEM of 0 when the accuracy is not perfect. But if you are talking about estimating the SEM from a single sample, that can only happen if your sample SD is 0 – so how could you tell it’s inaccurate?
“Ill never understand why this is so hard for you to comprehend.”
Could it be becasue what you say is incomprehensible – or obviously wrong?
“Suppose you have the entire population of a subject (perhaps 1000 temperature readings from 1000 different stations)”
As I’ve said that is really a sample of the global population, but let’s assume you want to treat 1000 random stations as a population.
“1000 data entries, all of them true values.”
So no measurement uncertainty?
“You can calculate the mean and standard deviation of that population out to a million decimal places if you want.”
I don’t, and unless you know each measurement out to almost a million places not possible.
“You can use that standard deviation to calculate an SEM value.”
But if you know the standard deviation and mean of the population there is no reason to be taking a sample.
“Now suppose you pull 10 samples of size 100 from that population. The SEM, calculated using the population standard deviation which is accurate out to a million decimal places, will tell you that those sample means will NOT be the same, they will have a variation. And that variation is the SEM.”
Yes.
“The SEM only tells you the variation of the sample MEANS. It doesn’t tell you the standard deviation of any sample nor does it tell you the standard deviation of the population.“
Correct – there an infinite number of things it doesn’t tell you. There is one thing it does tell you.
“It is the standard deviation of the sample that determines how accurate the mean of the sample is.”
And there you go – start with a reasonable explanation of what the standard error of the mean means – and then just blurt out your normal nonsense with zero regard to what you’ve just said. Just repeating something that makes no sense does not suddenly mean it’s true.
I’m sure this means something to you in your own head, but unless you can justify the argument, preferably without ranting, I can’t help you with it.
“But again this is missing my point. You want to claim the standard deviation is the “accuracy” of the mean, and then talk about a SEM of 0 when the accuracy is not perfect.”
YOU STILL DON’T HAVE IT!
The variance of a distribution is a metric for how uncertain the mean is. An uncertainty mean can *NOT* be accurate. The mean becomes an ESTIMATED value surrounded by an interval of values that can reasonably be attributed to the measurand!
It is just that simple!
The SEM is a metric for sampling error. It is *NOT* measurement uncertainty. Write that down 1000 times!
“So no measurement uncertainty?”
I am trying to show you something so, yes, assume no measurement uncertainty.
“I don’t, and unless you know each measurement out to almost a million places not possible.”
But you have no problem calculating the average of temperatures out to the millKelvin when the measurement uncertainty is +/- 0.5K?
“But if you know the standard deviation and mean of the population there is no reason to be taking a sample.”
No kidding! How do you know the population mean and standard deviation of global temperature?
“Yes.”
You say yes but then you turn around and don’t understand that it is the standard deviation of the SAMPLE MEANS, and not the SD of either the sample or the population!
“Correct – there an infinite number of things it doesn’t tell you. There is one thing it does tell you.”
Then it can’t be a measurement uncertainty.
You have just agreed that the average uncertainty is not the uncertainty of the mean AND that the SEM is not a measurement uncertainty.
So why are you supporting the GAT as a valid statistical descriptor for global temperature out to the millKelvin?
“And there you go – start with a reasonable explanation of what the standard error of the mean means – and then just blurt out your normal nonsense with zero regard to what you’ve just said. “
You just agreed that the SEM tells you the distribution of the SAMPLE MEANS! It is *NOT* the sample standard deviation!
Your lack of reading comprehension skills is showing again!
tpg: ““It is the standard deviation of the sample that determines how accurate the mean of the sample is.””
This is a TRUE statement. The values in the sample have both an estimated value AND a measurement uncertainty. Therefore that measurement uncertainty propagates onto the sample mean. Thus that sample mean is UNCERTAIN! Measurement uncertainty tells you how accurate your estimate of the mean *is*. If it is 100% accurate then the measurement uncertainty will be 0 (zero). But no set of measurements is ever 100% accurate, at least in the real world most of us, you excepted, live in.
The SEM calculated from measurements IS an estimate with an uncertainty interval. Pure and plain.
Dig out your introductory statistics texts and for every example in there add an uncertainty to each and every value. Then work out how that uncertainty propagates!
“The variance of a distribution is a metric for how uncertain the mean is.”
Wrong.
“An uncertainty mean can *NOT* be accurate.”
What’s “an uncertainty mean”?
“The mean becomes an ESTIMATED value surrounded by an interval of values that can reasonably be attributed to the measurand!”
And that interval is described by the SEM.
“It is just that simple!”
Everything’s simple if you just make it up.
“Write that down 1000 times!”
Why?
“How do you know the population mean and standard deviation of global temperature?”
You estimate it from the data you collect by various methods. Either satellites or surface instruments.
“You say yes but then you turn around and don’t understand that it is the standard deviation of the SAMPLE MEANS, and not the SD of either the sample or the population!”
I said yes to the thing you said that was correct. Not to the incorrect things you’ve just said. Maybe you didn’t understand what you said the first time, and were only correct by accident.
“You have just agreed that the average uncertainty is not the uncertainty of the mean AND that the SEM is not a measurement uncertainty.”
You keep putting words together as if they are meant to mean something.
“You just agreed that the SEM tells you the distribution of the SAMPLE MEANS! It is *NOT* the sample standard deviation! ”
How many different ways are you going to repeat this before getting to the point? Just say why you think the sample standard deviation should be used for the uncertainty of the mean. Just pointing out how the standard deviation is not the standard error of the mean, doesn’t do that.
“The values in the sample have both an estimated value AND a measurement uncertainty. Therefore that measurement uncertainty propagates onto the sample mean. Thus that sample mean is UNCERTAIN!”
And the fact that it’s a random sample from the population makes it even less certain.
“Measurement uncertainty tells you how accurate your estimate of the mean *is*. If it is 100% accurate then the measurement uncertainty will be 0 (zero). But no set of measurements is ever 100% accurate, at least in the real world most of us, you excepted, live in.”
You keep saying uncertainty is not error and there is no true value, and now you want to use accuracy as a substitute for measuremnt uncertainty.
But, no there is not normally no uncertainty so measurements are inaccurate – why you think I don’t believe that is a mystery. I keep telling you that no measurement of global anomalies will be certain, there will always be some degree of inaccuracy.
“Then work out how that uncertainty propagates!”
I keep telling you how it works out – using equation 10 for example. The problem is you never understand it, or choose not to understand it, if it destroys your religious like faith in larger samples having more uncertainty.
First you say that you shouldn’t use +/- and then you say you can’t show an asymmetric interval without using a +/-!
You can’t even stay consistent for two sentences!
OF COURSE YOU CAN SHOW AN ASYMMETRIC UNCERTAINTY AS AN INTERVAL!
What makes you think you can’t?
You *still* don’t understand what the entire goal of an uncertainty interval *IS*!
It’s to allow others to judge whether their measurements coincide with yours! All you really need to know is the interval within which the measurement is most likely to lie!
“Maybe because people want to use your results, and it’s easier to use a single value than an interval.”
In other words they can just ignore the uncertainty and use the estimated value as if it were 100% correct? Like you do? And climate science does?
The *easy* way is not always the “right” way. If you had any real world experience you would understand that. You are a blackboard genius, that’s all!
“*YOU* are the one trying to say that var(x+y) ≠ var(x) + var(y) when it comes to temperature.”
I’m not saying that at all./ If you have any two independent random variables then var(x+y) = var(x) + var(y). (Note, it was only a couple of weeks ago that the Gorman’s were the ones saying this was not true if the distributions where not normal.)
I just don’t know why you would want to add two temperatures. Your problem, as I keep saying is you don’t understand the difference between adding and averaging.
“Your lack of algebra skills is showing again. “y” can be either negative or positive. You still show it as x + y”
How’s that for projection.
So now you are saying y is the negative of the base temperature – is that it? Much less confusing to just use the standard x – y.
“What do you combine to get a temperature anomaly?”
You still don’t get the point do you. Are x and y individual daily temperatures, or are they averages?
“Don’t play stupid. It’s an argumentative fallacy known as Appeal to Ignorance.”
So you don’t understand what “appeal to ignorance” means either.
“If the variance of the monthly average is based on multiple daily values over a decade then those daily values taken as a data set have a variance.”
And now Tim confirms the point I’m making. He want’s x and y to be averages, but claims their variance is that of the daily values.
You can easily see for yourself they are not the same thing. Take a handful of dice, through them multiple times and take the average of each through. The variance of all your averages will not be the same as the variance of the individual dice.
“Remember, the daily Tmedian is made up of two values representing a data set,”
And here’s Tim’s favorite deflection – switch to an unrelated subject and switch from mean values to medians for no reason. Of course it makes no difference if you are talking about the mean of two values.
“And the variance of that data set of two elements will have a variance (Tmax- Tmedian)^2 + (Tmin – Tmedian) ^2.”
Sop many things wrong here.
You do not base the variance on median values, but on means.
The max and minimum values are not random values taken from the daily spread of temperatures.
If you take [(Tmax – Tmean)^2 + (Tmin – tmean)^2] / 2, you have an upper bound on the variance of temperatures for that day. Tim is here claiming it could be double that using his misunderstanding that Tmax and Tmin are a random sample.
This variance in no way describes the variance of the daily Tmean value, as it is not the average of two random values.
Lmao. You’re really that clueless?
Yes he is, with a swelled intellectual superiority complex to top it off that tells him he is “right”.
When I take the time to read a bellcurveman rant, it always feels like neurons are dying afterward.
“I just don’t know why you would want to add two temperatures. Your problem, as I keep saying is you don’t understand the difference between adding and averaging.”
To find the average you have to do a sum first!
“So now you are saying y is the negative of the base temperature – is that it? Much less confusing to just use the standard x – y.”
Less confusing only to someone unable to figure out simple algebra.
“You still don’t get the point do you. Are x and y individual daily temperatures, or are they averages?”
Tmax and Tmin do *NOT* give you an average! They give you a MEDIAN. You can’t even get this correct after it being demonstrated to you over and over!
“So you don’t understand what “appeal to ignorance” means either.”
It means you are feigning ignorance so you can ask a question you already know the answer to – or *should* already know!
“And now Tim confirms the point I’m making. He want’s x and y to be averages, but claims their variance is that of the daily values.”
It doesn’t matter if the values are averages or not. They are random variables and combining random variables into a data set means the variance of the data set becomes the sum of the variances of the random variables.
You are lost in the weeds again trying to rationalize the fact that you are lost!
“Take a handful of dice, through them multiple times and take the average of each through. The variance of all your averages will not be the same as the variance of the individual dice.”
Once again you are mixing probability and statistics. You’ve had this fallacy pointed out to you before but, like always, you never learn. My guess that you don’t even understand that loaded dice can produce an iid distribution even if it is biased.
“And here’s Tim’s favorite deflection – switch to an unrelated subject and switch from mean values to medians for no reason. Of course it makes no difference if you are talking about the mean of two values.”
It isn’t a deflection – except to someone who doesn’t understand that only with a symmetric distribution, such as a Gaussian, can the mean and the median be the same value. (Tmax+Tmin)/2 is *NOT* an average, it is a median. It is the median of a sinusoidal daytime distribution and an exponential decay nighttime distribution. The combination is a skewed one. The attached graphic is a pretty good picture of the daily temperature curve. Rising sinusoidally to a maximum and then following an exponential decay downward. Note carefully that the mean and the median are *not* the same.
“You do not base the variance on median values, but on means.”
Then why do you calculate the MEDIAN and not the mean for the temperature profile? For a skewed distribution the INTERQUARTILE RANGE is the proper statistical descriptor to use for the distribution, not the variance!
“If you take [(Tmax – Tmean)^2 + (Tmin – tmean)^2] / 2, you have an upper bound on the variance of temperatures for that day. Tim is here claiming it could be double that using his misunderstanding that Tmax and Tmin are a random sample.”
As usual you are trying to defend the use of a INCORRECT statistical descriptor for the temperature profile. None of your defenses ever hold water but you just keep on trying!
WHAT IS THE INTERQUARTILE RANGE for the daily temperature profile. Do you have even the smallest clue?
On “appeal to ignorance”:
“It means you are feigning ignorance so you can ask a question you already know the answer to – or *should* already know!”
It would have taken Tim almost no time to check this – but he instead prefers to demonstrate his own ignorance.
An appeal to ignorance means you are claiming that if something has not been proven true it must be false, or if it has not been proven false it must be true.
And now you have bee reduced to trying to defend your use of an argumentative fallacy!
You are correct. I used the wrong fallacy. What you are doing is actually named SEALIONING.
From wikepedia: Sealioning (also sea-lioning and sea lioning) is a type of trolling or harassment that consists of pursuing people with relentless requests for evidence, often tangential or previously addressed, while maintaining a pretense of civility and sincerity (“I’m just trying to have a debate”), and feigning ignorance of the subject matter
You are a troll, through and through, doing nothing but harassing people with inanities and insane assertions.
“You are correct. I used the wrong fallacy.”
Apology accepted.
“Sealioning.”
I apologize if my civil requests for you to define your terms meant you felt harassed. From now on I won’t bother to ask you to justify your assertions, and will just assume you are lying.
You *ARE* sealioing. You are harassing people interested in the global temperature data bases and how they are being statistically analyzed by continuing to try and redirect the issues to situations where you have multiple measurements of the same thing using the same device under repeatability conditions – which simply doesn’t apply to the temperature data base.
Get lost. You aren’t worth the bandwidth.
“You are harassing people interested in the global temperature data bases and how they are being statistically analyzed…”
Sorry if you are feeling harassed. But as far as I’m concerned, by “interested in the global temperature data bases” you mean making up nonsense about the uncertainty of such data bases, and by harassing you mean explaining why the uncertainty does not increase as sample size increases.
For uncertainty to decrease, the values must carry significance. If various significantly different conditions can yield the same average, then that average lacks meaningfulness
Why is this so hard for the trendologists to understand?
Because otherwise, their presence here serves no real purpose. All they seem to care about is y=mx+b equations and attribution studies. In the coming days, they’ll confidently dissect Honga Tunga’s purported influence on the climate. Many will comment on it, and the trendologists will swiftly intervene, ‘correcting’ them by asserting the effect was merely 0.06 or thereabouts. Quantifying the impact of an underwater volcano on Earth’s complex climate with such precision, down to the hundredth degree and with minimal uncertainty— I can’t even type that sentence with a straight face.
“For uncertainty to decrease, the values must carry significance.”
Firstly, I said it doesn’t increase. That’s the main bone of contention. Do you agree or disagree that it will increase with sample size?
Secondly, yes I think that in general it decreases with sample size. That’s the benefit of having large sample sizes, but that won’t always happen – e.g. if the uncertainties are dependent or are caused by systematic errors.
Thirdly. Sorry, but I’ve no idea what you mean by “must carry significance”. Significance (assuming you mean statistical significance) is something you establish by looking at the uncertainties of the average, it doesn’t affect whether the uncertainty decreases or not.
“If various significantly different conditions can yield the same average, then that average lacks meaningfulness”
I’d disagree, but even if you accept that it has nothing to do with uncertainties decreasing.
I disagree because an average is only meant to show part of picture. Two populations with the same average may be different, but the point is that two populations with different averages cannot be the same. That’s why you are usually looking at averages in a statistical context – to ask if there is a significant difference between populations.
The null-hypothesis is that the two populations are the same, if the averages are significantly different you can say the null-hypothesis is false. If they are not significantly different you cannot say the null-hypothesis is true.
“Firstly, I said it doesn’t increase. That’s the main bone of contention. Do you agree or disagree that it will increase with sample size?
Secondly, yes I think that in general it decreases with sample size. That’s the benefit of having large sample sizes, but that won’t always happen – e.g. if the uncertainties are dependent or are caused by systematic errors.
The ONLY way for it to decrease is if all of the measurement error is random, Gaussian, and cancels.
Large data sets whose distribution is not Gaussian simply won’t see the uncertainty decrease. In fact, even if the distribution is Gaussian, it is likely it won’t decrease.
If each value in a data set is given as “stated value +/- measurement uncertainty” (let stated value be denoted by s_v and measurement uncertainty as m_u), then you cannot determine the uncertainty by merely considering the stated values.
Each and every sample will consist of data points given as “s_v +/- m_u.
Thus, the mean of each sample will become the average of the s_v values and that average will have an uncertainty of the root-sum-square of the m_u values.
When you find the mean of those sample means and determine their standard deviation, that uncertainty will propagate onto both. Neither should be stated with any more decimal digits than the uncertainty interval has. It just totally blows away your claim that you can increase the precision of measurement by averaging and it blows away your claim that you can decrease the uncertainty of the mean by adding measurements with uncertainty.
Doing what you claim requires applying your typical meme of “all measurement uncertainty is random, Gaussian, and cancels”. That way the uncertainty can be ignored. No matter how many times you claim you don’t assume this it just comes through in everything you do!
In the real world uncertainty never decreases. Bellman and his compatriots defending climate science have even asserted that you can increase precision of measurement by averaging.
They live in a statistical world that has no congruence with the real world.
When they say they can increase precision by averaging, they consider only the stated values of the measurements in their sample. They ignore the fact that each measurement in that sample carries with it a measurement uncertainty. They use the equation SEM = s/sqrt(n). And that’s ok – but they forget to propagate the measurement uncertainties onto that SEM! Those uncertainties add by root-sum-square so the more measurements they take the larger the uncertainty of the SEM gets. You can’t increase the precision of the SEM any farther than the uncertainty of the SEM allows. The SEM should not be stated to more decimal places than the uncertainty has!
Trying to find anomalies to the hundredths digit when the uncertainty of the sample means is in the tenths digit (or even the unit/tens digits) is only fooling themselves as well as others.
Say you have ten samples whose means all equal 278..501. Climate science and statisticians would say the SEM = 0 (zero) and the “true value” is 278.501. But suppose the *actual* mean of each is 278.501 +/- 0.5!
The total uncertainty is sqrt(10) * 0.5 = 1.6. That mean of the sample means should really be given as 278.501 +/- 1.6, which actually leads to stating it as 278.5 +/- 1.6.
All of a sudden calculating anomalies out to the hundredths digit becomes impossible.
The fact that climate science has been getting away with ignoring measurement uncertainty for more than 40 years is simply amazing – and unconscionable.
When you continually come in here and try to force everyone to discuss random and Gaussian distributions with no mention of variance, skewness, or kurtosis you *are* harassing them for no reason except your own pleasure at seeing your name in the thread.
“ you mean making up nonsense about the uncertainty of such data bases”
It’s not nonsense, it’s METROLOGY. Real world metrology.
” you mean explaining why the uncertainty does not increase as sample size increases.”
The meme of “random, Gaussian, and cancels” is so embedded in your brain that you can’t understand anything else. When you add single measurements of different things taken by different devices under differing conditions MEASUREMENT UNCERTAINTY INCREASES EVERY SINGLE TIME YOU ADD ANOTHER MEASUREMENT.
You *are* sealioning everyone by trying to convince them that the SEM is the true measurement uncertainty of the average. It is demonstrated by your absolute refusal to even use the word “measurement” when talking about uncertainty. You equivocate in every post you make by refusing to use the word “measurement” with the word “uncertainty”. You’ve even gone so far as to leave the word “measure” out of quotes from the GUM, even refusing to use the title of Section B.2.18: uncertainty (of measurement) hoping to fool everyone it was talking about the uncertainty of the average, i.e. the SEM.
You, and climate science, won’t even admit that the SEM for temperature measurements has its own measurement uncertainty. You calculate the SEM using only the stated values of the measurements in the sample while ignoring the measurement uncertainty part of the measurement. Each and every sample mean has its own measurement uncertainty propagated from the measurements in the sample itself. You, and climate science, however, apply your meme of all measurement uncertainty being random, Gaussian, and cancels in order to ignore the fact that the sample means have their own measurement uncertainty. This allows you to calculate the estimated population mean out to any number of digits – when in reality that estimate of the population mean should only be stated to the number of decimal places in the uncertainty of the sample mean.
I give you once again the GUM equation for the propagation of uncertainty assuming a set of data that is of the first order, i.e. each data point is a stated value +/- u so the partial of f with respect to x = 1
[u_c(y)]^2 = Sum(1,n) u(x_i)^2
This general form does *NOT* provide for cancellation of error. The uncertainty of each data point adds in root-sum-square form. As you add more terms, i.e. more measurements, the total uncertainty goes up. When you use the formula [u_avg]^2 = [u_c/n]^2 you are finding the average uncertainty, not the uncertainty of the average. You really aren’t even finding the SEM. In your method of finding the the uncertainty you are finding the standard deviation of the stated values while ignoring their uncertainty components. The SEM should actually be stated as “SEM +/- uncertainty” where the uncertainty is calculated using the GUM equation, i.e. propagated from the measurements in the sample. Doing so should abuse you of your stated notion that you can increase the precision of measurements by averaging. You can’t. The precision with which you can locate the average is limited by the uncertainty of the measurements – ALWAYS.
You can whine, and cry, and moan, and groan, and rant, and rave, and whatever else you want to do, it will have no impact on the use of metrology in the real world. You an live in your statistical world if you want but everything you say about the real world will be wrong.
The irony is that he still can’t make it past the title of the GUM:
Guide to the Expression of Uncertainty in Measurement
bellboy displaying ignorance.. always.
He’s caught out just like always. He doesn’t even understand that the daily temperature profile is a multi-modal distribution let alone what the variance of that distribution is.
Like climate science, all he worries about is the “average” which is actually a meaningless median value that can’t even distinguish between two different climates with the same median value.
Yet we are suppose to believe that his GAT is a proper statistical analysis of the global temperature data and the associated variance of the data can be totally ignored. Just like all measurement uncertainty is random, Gaussian, and cancels leaving the measurement uncertainty of the GAT equal to 0 (zero).
Mr. Gorman: I appreciate you following these gaslighters down the garden paths they lay out. You were wise to cut bellman off quick, he would simply lead you back on the same path AlanJ just wore out. I conclude that they are both paid trolls, who understand only enough to lead us on merry chases into overgrown fields. They know well that GATs are exercises is obfuscation, but they will not concede this because THEY are the players to obfuscate it in an eternal loop. Either they know this and carry the lie forward for some reason, or they are dumb, and I don’t think they are dumb.
They aren’t dumb, just willfully ignorant. Why? You are correct, they are paid trolls.
Could you then explain to me what he means by x and y in the equation var(x + y) = var(x) = var(y), as it relates to anomalies?
He gets pissy when I refuse to respond to his crap posts.
With a facade of being the world’s leading expert…
Yes karlo, knowing a few elementary facts about random variables and statistics makes me the world’s leading expert. Compared with the geniuses here who think that increasing sample size increases the standard deviation f the population, I guess I do appear to be an expert.
You STILL can’t figure this one out, after explanation after explanation ad infinitum!
If you have multiple single measurements of different things each with a measurement uncertainty and you cram them together in a single data set then each time you add another measurement with an uncertainty the total measurement uncertainty increases.
The variance of that data set will *also* increase each time you add another random variable to it, e.g. a new measurement with a measurement uncertainty. The standard deviation is nothing more than the square root of the variance so it goes up as well!
All you have to offer is that the SEM gets smaller with more measurements. That’s precision and not accuracy. Measurement uncertainty is a measure of accuracy. And you simply can’t understand the difference.
Bellman is a monkey.
“You STILL can’t figure this one out, after explanation after explanation ad infinitum!”
Always remember you are the easiest person to fool. Try thinking through my arguments rather than just assuming you are incapable of making a mistake.
“If you have multiple single measurements of different things each with a measurement uncertainty and you cram them together in a single data set then each time you add another measurement with an uncertainty the total measurement uncertainty increases.”
Your mixing up two of your arguments here – and they are both wrong.
The claim I was referring to was you saying that as SD = SEM * √N, it follows that as N increases so must the population SD. Nothing to do with measurement uncertainty.
Well I’ll be damned! Maybe you *are* capable of learning.
definitions:
σ – population standard deviation
s – sample standard deviation
n – number of elements in a sample
If you know the population mean and standard deviation then:
SEM = σ/sqrt(n)
If you don’t know the population statistical descriptors then you can use the standard deviation of the sample as an estimate of the population mean:
SEM = s/sqrt(n)
In both cases the SEM gives you an inferential statistical descriptor for the interval in which sample means will lie. That is why it is more accurate to use the term “standard deviation of the sample means” instead of “standard error”. The term “standard error” is just very misleading, leading many people to think it is describing the accuracy of the population mean when all it is really doing is indicating how precisely you can locate the population mean – and that population mean can be terribly inaccurate.
Next topic: SEM = s/sqrt(n) is only accurate if all samples are iid, independent and identically distributed. This can only be assumed if the population is Gaussian. If it is not Gaussian then there is no guarantee that all samples will have the same distribution. Nor can it be assumed that any sample distribution will be identical to the population distribution. Being iid is *required* for the CLT and LLN theories to apply to samples. If iid is not met then the standard deviation of the sample means grows beyond what the simple formula above provides. The point estimate of the sample standard deviation can no long be considered accurate. It becomes necessary to actually take multiple samples to form a distribution from which a standard deviation of the sample means can be calculated.
Next topic: Being iid means each random variable is independent and identically distributed. “Independent” means no random variable element is dependent on any other. Climate science assumes that all of the random variables (i.e. temperatures) in their sample is iid when calculating the standard deviation of the sample means. They then turn around and say they can homogenize and infill data making the involved random variables dependent on each other – violating their assumption of iid!
All of this legislates against the GAT being an accurate estimate of anything – including the ability to determine a global anomaly out to the hundredths digit.
“Next topic: SEM = s/sqrt(n) is only accurate if all samples are iid, independent and identically distributed. This can only be assumed if the population is Gaussian.”
Completely wrong. A sample is made up from randomly selected values from the population. As long as the selection is random they will be iid regardless of the distribution of the population.
“If it is not Gaussian then there is no guarantee that all samples will have the same distribution.”
You are still thinking there are multiple samples. And if you did take multiple samples they will not have the same distribution – that’s the point of estimating a SEM.
“If iid is not met then the standard deviation of the sample means grows beyond what the simple formula above provides.”
And now you are completely losing the plot.
“Next topic: Being iid means each random variable is independent and identically distributed.”
Almost as if that’s what the abbreviation iid means.
“Climate science assumes that all of the random variables (i.e. temperatures) in their sample is iid when calculating the standard deviation of the sample means.”
Nobody thinks that.
“They then turn around and say they can homogenize and infill data making the involved random variables dependent on each other – violating their assumption of iid!”
Nobody is claiming a global average is derived from a random sample.
“Completely wrong. A sample is made up from randomly selected values from the population. As long as the selection is random they will be iid regardless of the distribution of the population.” (bolding mine, tpg)
A sample? They will be iid?
Multiple samples of a skewed population will *NOT* be iid. That’s one main reason for why you get a spread of the sample means. The sample distributions will be different for each sample giving a different mean value. In fact, there is no guarantee that multiple samples from a normal parent distribution will be iid.
The CLT says the distribution of sample meanS of multiple samples will tend toward normal even if the parent distribution is skewed. It does *NOT* say that the samples will all have the same distribution. It does *NOT* say that all sample means will be the same.
If all you have is ONE sample you do not get a distribution of sample means. You get one mean. The CLT does not apply. There is no guarantee that the one sample will have the same distribution as the parent distribution. There is no guarantee that the one sample will have the same mean as the parent distribution. The CLT is why it is *much* better to have multiple samples rather than just one, you get a much better approximation of the parent mean by doing so.
Remember, if all you have is one sample and you don’t know the standard deviation of the population, σ, then you have to use the sample standard deviation, s, as an APPROXIMATION of the population standard deviation in order to calculate the SEM. The equation becomes SEM = s/sqrt(n), not σ/sqrt(n).
“Nobody is claiming a global average is derived from a random sample.”
Of course they are! The global temperature data base is made up of ONE sample of the global temperature each day!
If that is not true then you have to consider each individual data element as a separate sample – leaving the sample size to be 1! Thus your SEM becomes s/1 = s! The SEM^2 is the variance of each sample and when you add all of them up you add up all the variances!
You are caught between a rock and a hard place. It will be fun watching you trying to extricate yourself from between them!
“Nobody thinks that.”
Of course they do. That’s why they think they can ignore the variances of all the component parts!
You can’t seem to get ANY of this correct.
You just keep digging the hole you are in deeper and deeper thinking you are going to hit pay dirt some day. There’s no vein of gold for you to find where you are digging. The hole just keeps caving in on top of you!
“A sample? They will be iid? ”
They meaning the random values.
“Multiple samples of a skewed population will *NOT* be iid.”
It’s not the “samples” that need to be iid (though they will be), it’s the individual values – and yes they will be iid if they all come from the same distribution regardless of whether it’s skewed or not.
“In fact, there is no guarantee that multiple samples from a normal parent distribution will be iid.”
I’d ask you to provide evidence that you understand what identically distributed means, but you’d accuse me of sealioning again, so I’ll just state that you don’t understand what it means, and leave it at that.
“It does *NOT* say that all sample means will be the same.”
Almost as if there’s a point to determining the standard error of those means.
“If all you have is ONE sample you do not get a distribution of sample means.”
You still don’t understand what a random variable is. You don’t need to take multiple samples to know the one sample comes from a distribution, and that you can get a good estimate of what that distribution is.
“The CLT is why it is *much* better to have multiple samples rather than just one, you get a much better approximation of the parent mean by doing so.”
So you agree that it’s better to have a large sample than a small one when estimating a mean. Again, if you have an average of multiple samples you also have an average of one much bigger sample.
“Remember, if all you have is one sample and you don’t know the standard deviation of the population, σ, then you have to use the sample standard deviation, s, as an APPROXIMATION of the population standard deviation in order to calculate the SEM. The equation becomes SEM = s/sqrt(n), not σ/sqrt(n).”
Yes that’s what we’ve been trying to tell you for the last three years.
“Of course they are!”
Then “they”, whoever they are, are lying to you. An average based on fixed station data is not a random sample, nor is one based on a systematic sweep by satellites.
“The global temperature data base is made up of ONE sample of the global temperature each day!”
But not random. And not treated as a random sample. You do not simply average all the daily temperatures and assume it’s an estimate of the global mean temperature.
“They meaning the random values.”
If that was true then every sample would have the same mean and standard deviation, i.e. the SEM would be 0 (zero). That is obviously untrue. Did you think about your statement at all before posting it?
“It’s not the “samples” that need to be iid (though they will be), it’s the individual values – and yes they will be iid if they all come from the same distribution regardless of whether it’s skewed or not.”
I don’t know who told you this but they were wrong and so are you! If this was true all samples would have the same mean and standard deviation and the SEM would be zero, by definition.
“I’d ask you to provide evidence that you understand what identically distributed means, but you’d accuse me of sealioning again, so I’ll just state that you don’t understand what it means, and leave it at that.”
As usual, just another Argument by Dismissal argumentative fallacy. What does IDENTICAL DISTRIBUTION mean to you? If every sample has the SAME DISTRIBUTION then how can the sample means have different means and standard deviations?
It’s obvious you are trying to describe a situation where multiple measurements are of the same thing using the same device under the same environmental conditions but you are afraid to explicitly say that because you know that would invalidate the temperature data since it is single measurements of different things with different devices under different environmental conditions.
I don’t have time to educate you any further. You refuse to learn and I have jewelry to make for customers. At $2000 an ounce for gold, you have to be ACCURATE with your measurements when working with gems whose girdle can vary by .25mm or less and if you make a seat too large there isn’t much of any way to fix it beyond melting the ring down again and starting from scratch with your rolling mill, drills, and burrs. Just calculating the average out precisely simply isn’t enough – you have to understand the ACCURACY of the measurements.
But enough of that, it will have just blown right over your head!
“If that was true then every sample would have the same mean and standard deviation, i.e. the SEM would be 0 (zero).”
You obviously have no idea how this works, and me explaining it again isn’t going to help you – but
A random sample is a selection of values randomly chosen from a population. Each value randomly selected can be considered a random variable with the same distribution as the population. The fact that these values are random means that whatever you do to these values, adding them up or taking the average will result in a new random variable. The fact that it is random means that every sample you take will be random – i.e. it will not be the same as the previous one. In reality you usually only take one sample, and the idea is you know it is a value taken from the random variable becasue you know how the individual random variables combine.
For example, suppose I took a sample of size 5 (usually you want a much bigger sample). The values I take can be modeled as random variables X1, X2 … X5. Because each value comes from a random selection from the population it’s distribution will be the same as the population. It will have the same mean as the population and the same standard deviation. If I take the average of the five random variables I get a new random variable, say AVG. The rules of combining independent random variables means that
mean(AVG) = (mean(X1) + mean(X2) + mean(X3) + mean(X4) + mean(X5)) / 5
and
var(AVG) = (var(X1) + var(X2) + var(X3) + var(X4) + var(X5)) / 25
But because all the variables have the same mean and variance, this becomes
mean(AVG) = mean(X)
and
var(AVG) = var(X) / 5, so
SD(AVG) = SD(X) / √5
where X can be any of the variables, or the population.
Now, where this gets tricky is understanding that I am only talking about random variables here. Mathematically you treat a random variable as a probability distribution. In reality we only take one sample, that is we get one random value from each random variable, and one random sum or average from these five values. The point of the mathematics is to tell us what we know about the distribution the of the average has come from, because if we know the standard deviation of that we get an idea of how close the sample average may be to the mean of the population.
And the main complication with an actual sample is we probably don’t know the population SD, so have to estimate it from the standard deviation of our sample, which adds extra uncertainty especially for small sample sizes. And then there are more philosophical questions about what a confidence interval means. But I think that’s enough to help you understand why saying the individual values are taken from random iid variables it does not mean every sample will have the same mean.
“Now, where this gets tricky is understanding that I am only talking about random variables here.”
Here we go again! What does this have to do with a global temperature data base? The random variables in the data set are GUARANTEED to not have the same distribution. Some may be Gaussian, but a large set of them will be skewed left or right.
Nothing you have to offer has anything to do with the GAT – other than the fact that climate science always uses the same meme that you do – all measurement error is random, Gaussian, and cancels! Here you are even assuming that all of the random variables making up the data set have the same distribution!
If all you can address is the meme that everything is random and Guassian then leave the rest of us alone. This isn’t a discussion of how to handle random and Gaussian data.
STOP BEING A SEALION!
“What does this have to do with a global temperature data base? ”
I’m explaining why you are wrong to say ““If that was true then every sample would have the same mean and standard deviation, i.e. the SEM would be 0″ (zero).”
Every time someone explains why the thing you’ve just said is wrong you change the subject. It’s the argumentative fallacy of moving the goalposts.
“The random variables in the data set are GUARANTEED to not have the same distribution.”
Just go on ignoring all my comments explaining why that is not true.
“all measurement error is random, Gaussian, and cancels!”
Yawn! Repeating a lie several thousand times does not make it any truer.
“Here you are even assuming that all of the random variables making up the data set have the same distribution!”
Try to understand that if values are taken randomly from the same distribution they will be random variables with the same distribution. It might help if you do what I asked at the beginning and define what random variables you are talking about – rather than start screaming about how I was harassing you by asking a question.
“This isn’t a discussion of how to handle random and Gaussian data. ”
Once again, the data does not have to be Gaussian, in the case of global temperatures it is not Gaussian. This is a completely irrelevant meme that exists only in your head. Accept that not everything is or needs to be Gaussian.
Your post is not on point. Speak to the global temperature statistical analysis.
Why won’t you use the term “measurement uncertainty”?
“Why won’t you use the term “measurement uncertainty”?”
I’ve used it thousands of times over the last 3 years, I can only assume your reading comprehension is as bad as you think mine is. A simple search shows I’ve used it at least a dozen times in this comment section alone.
You *always* call it “uncertainty of the mean”. You *never* use the term measurement uncertainty of the mean.
*IS* the measurement uncertainty of the mean the SEM?
“What does IDENTICAL DISTRIBUTION mean to you?”
Coming from distributions that are identical.
See here for example
https://en.wikipedia.org/wiki/Independent_and_identically_distributed_random_variables
“ If every sample has the SAME DISTRIBUTION then how can the sample means have different means and standard deviations? ”
Again, the point is that each item in the sample comes from the same distribution. But also, coming from the same distribution does not mean having the same value. That’s the point of the word “random” in random variable.
“It’s obvious you are trying to describe a situation where multiple measurements are of the same thing using the same device under the same environmental conditions but you are afraid to explicitly say that because you know that would invalidate the temperature data since it is single measurements of different things with different devices under different environmental conditions.”
That maybe what you think, but it’s not at all what I’m trying to explain. I am talking explicitly of a sample. A collection of values taken randomly from the same population. This is not about measuring things. There may not be any measurement uncertainty. It could be rolls of a die, or how many people are living in a house.
“I don’t have time to educate you any further.”
I hadn’t realised you’d started. I gave up trying to educate you long ago, I just write these things for my own benefit.
“Again, the point is that each item in the sample comes from the same distribution.”
No, the point is that they are NOT iid. They can have different distributions, i.e. different means and different variances. If you are sampling a skewed distribution you are just about guaranteed that each sample will have a *different” distribution.
The CLT only says that the sample means will form a normal distribution, it does *not* say that each sample will be iid.
“That maybe what you think, but it’s not at all what I’m trying to explain. I am talking explicitly of a sample. A collection of values taken randomly from the same population. “
You do *NOT* know what you are trying to explain. First you say the samples will all be iid with the same values and then you say they won’t.
bellman: “Because each value comes from a random selection from the population it’s distribution will be the same as the population. It will have the same mean as the population and the same standard deviation.”
If you consider the global temperature database to be a SAMPLE, then it is made up using “sampling without replacement”. There is no chance for the same measurement to appear in the data base more than once. Thus the values are not truly independent. What the next value in the sample data set becomes is dependent on what values were chosen before. If you are sampling without replacement then the size of the sample should be no more than 10% of the population. I don’t know if the global temperature database meets this requirement or not!
“This is not about measuring things. There may not be any measurement uncertainty”
And now we get down to it! “all measurement uncertainty is random, Gaussian, and cancels”.
Simply unfreakingbelievable!
“No, the point is that they are NOT iid. ”
It’s like talking to a brink wall – but one that is exceptionally obtuse even by the standards of a brick wall.
I’ve explained enough times why selecting a values at random from the same distribution will mean they are random identically distributed variables.
“If you consider the global temperature database to be a SAMPLE, then it is made up using “sampling without replacement”.”
Again, any global temperature database is not a random sample. But sampling without replacement is irrelevant here as the population is infinite.
“Thus the values are not truly independent.”
They are not independent – that’s why it’s not a random sample. 9At some point the Gormans are going to accept how random sampling works, and we could get onto discussing how actual global temperature sets work. )
“And now we get down to it! “all measurement uncertainty is random, Gaussian, and cancels”.”
Tim’s internal gramophone is stuck again. I was specifically pointing out cases where there is no measurement uncertainty, yet somehow this goes into one ear and comes out as you are talking about Gaussian measurement uncertainties.
“Again, any global temperature database is not a random sample.”
Then it is a biased sample and cannot adequately represent the population. Strike 1.
“They are not independent “
Then the CLT will not apply. Strike 2
” I was specifically pointing out cases where there is no measurement uncertainty, “
And yet every single temperature measurement has uncertainty. Strike 3
The GAT just struck out based on *YOUR* comments, not mine.
” I was specifically pointing out cases where there is no measurement uncertainty, “
As pointed out just above; he still can’t understand the basics of the subject, yet has the temerity to lecture Pat Frank.
Beyond pathetic.
And there was this little gem, Strike 4:
That he thinks such a beast exists shows how little he understands (not to mention that he believes this is what you are trying to tell him).
Missed that one! Thanks!
It’s all part of his mindset meme that all measurement uncertainty is random, Gaussian, and cancels. He keeps denying he does this but he’s only deluding himself!
Whenever I have posted histograms of the UAH baseline averages, that are nowhere even close to Gaussian, they ignore reality and push downvote button.
Problem solved!!
It’s not just ignorance, it’s *willful* ignorance.
“Then it is a biased sample and cannot adequately represent the population.”
Which is why you apply some form of weighting – e.g. using a grid.
“Then the CLT will not apply.”
Which part of any real world uncertainty analysis of global anomalies uses the CLT? Does it apply in that case or not.
“And yet every single temperature measurement has uncertainty”
I was not talking about a temperature measurement at that point. The clue was in the words I used.
Grid weighting is not variance weighting! BOTH need to be done!
“Which part of any real world uncertainty analysis of global anomalies uses the CLT? Does it apply in that case or not.”
You do it every time you say the measurement uncertainty of the average is the SEM!
“I was not talking about a temperature measurement at that point. The clue was in the words I used.”
You were trying to make everyone believe that you were. It’s why you won’t use the term measurement uncertainty.
Do you read what you assert or just write junk? IID means each have a similar probability distribution. Look at the attached histogram and tell me all these cities have the same probability distribution.
Why don’t you ever show anything to backup your assertions. You have gone far beyond people thinking you are an such expert that you can make assertions with no reference or backup.
What bull crap. There is NO GLOBAL TEMPERATURE TO SAMPLE DUDE! The GAT is a calculated value based upon measured local temperatures. Those local temperatures measurements have uncertainty that should be properly propagated throughout the entire string of calculations.
He excels at hand-waving…
“IID means each have a similar probability distribution.”
No it means something comes from an identical distribution. There’s a clue in the second “i”.
“Look at the attached histogram and tell me all these cities have the same probability distribution.”
Can’t see it but I’ll assume you are correct. The point you keep getting confused on is that when you take a single temperature measurement from a random location on the surface of the earth, the probability distribution it comes from is not of the place over time, it’s the distribution of all possible temperatures over the earth. That’s the distribution that is identical – if you could get values randomly over the earth.
“There is NO GLOBAL TEMPERATURE TO SAMPLE DUDE!”
Then what’s the point of anything? Of course there is a global temperature to sample. It isn’t the same temperature at every point of the globe if that’s what you think I meant.
“Those local temperatures measurements have uncertainty that should be properly propagated throughout the entire string of calculations.”
Which would be fine if you ever accepted how to do it properly. But just adding all the variances together is not doing it properly.
Why do you make assertions that never have any references? You are obviously ignorant of sampling theory.
Any single sample, even if chosen randomly, has little likelihood of being IID until the sample size approaches the population size. The only time this can be true is if the population has a normal distribution. Otherwise, there would be no need to include sample size into an equation of determining the population standard deviation.
In essence, you are saying as long as I choose randomly, the variance of my sample will accurately determine the variance of the population. That just isn’t correct. The sample means distribution is what determines the SEM.
THE SEM IS THE STANDARD DEVIATION OF THE SAMPLE MEANS DISTRIBUTION. It is not the standard deviation of a sample unless the population distribution is normal and truly RANDOM sampling is done.
Read the following from Penn State. Pay attention to the lesson about populations that are not normal.
4.1 – Sampling Distribution of the Sample Mean | STAT 500 (psu.edu)
From 4.1.2 – Population is Not Normal
You, along with others touting the GAT, have yet to ever post what the distribution of anomalies used to calculate the GAT is. Is it normal? Is it skewed?
I can find no reference that says a single large sample (+9000 stations) can be used to estimate the variance of the population of all temperatures in a month. All the references I can find show what the reference above shows – that you need multiple samples to create a sample means distribution.
You could help yourself by showing some of the data you use plotted in histograms. For example, monthly temperature distributions or the anomaly distribution for calculating the GAT. I am including a graph of temperatures I have previously examined. You can see there is only one station that even approaches a normal distribution.
“Why do you make assertions that never have any references? You are obviously ignorant of sampling theory.”
Because the assertions seem so obvious they don;t need a reference and as you keep demonstrating references are pointless when you keep misunderstanding what they say.
But if you insist:
https://www.statisticshowto.com/iid-statistics/
“Any single sample, even if chosen randomly, has little likelihood of being IID until the sample size approaches the population size.”
I won’t ask if you understand what IID means, but it’s obvious you don’t.
“In essence, you are saying as long as I choose randomly, the variance of my sample will accurately determine the variance of the population.”
That’s not what’s being said at all. The point is that each value that goes into your sample is a random variable with a distribution identical to the population. It’s true that you would expect the variance of your sample to tend towards the population variance as the sample size increases, just as you would expect the mean to tend to the population mean. But that isn’t the point of iid.
“THE SEM IS THE STANDARD DEVIATION OF THE SAMPLE MEANS DISTRIBUTION. It is not the standard deviation of a sample unless the population distribution is normal and truly RANDOM sampling is done.”
Once again, writing in all caps doesn’t make you look smart. The SEM is not going to be the same as the standard deviation of a sample. How could it be, when the SEM is determined by dividing the standard deviation by root N? And again normality has nothing to do with the SEM.
“If the population is skewed and sample size small, then the sample mean won’t be normal.”
Correct. That’s why the CLT is about limits. And why larger sample sizes are better than smaller ones. However, you keep mixing this up with the formula SEM = SD / √N. This is true regardless of the population distribution or sample size. It’s just more useful if you also know the sampling distribution is normal.
“If the population is normal, then the distribution of sample mean looks normal even if n=2”
Correct. Adding any number of normal distributions always gives you a normal distribution. This is why it’s useful if you can assume that your population is roughly normal.
“Is it normal? Is it skewed?”
No and Yes.
And how many times do I keep having to tell you that an average based on individual fixed stations is not a random sample.
“All the references I can find show what the reference above shows – that you need multiple samples to create a sample means distribution.”
Again, that is pointless. What you can do is use the data to run multiple simulations which should give you a better estimate of the uncertainty in your estimate.
“You could help yourself by showing some of the data you use plotted in histograms.”
You’re confusing me with someone who actually produces a global anomaly data set. I can show you histograms of station spread, or of calculated gridded data – but there’s a fair amount of work there. What you will probably find is a distribution that is skewed towards colder temperatures.
What could help you, though I doubt you would do it, is to run random samples from a skewed distribution and see if it produces a normal distribution of means, and if the standard deviations of those means are close to your estimated SEM – and then see if this gets better with increased sample size.
“The point is that each value that goes into your sample is a random variable with a distribution identical to the population.”
ROFL!!! So *every* single field measuring station, from the Artic to the Antarctic, creates a random variable with the same distribution – which is necessary if every one has the same distribution as the parent distribution.
Do you TRULY understand just how idiotic that assertion is?
“And how many times do I keep having to tell you that an average based on individual fixed stations is not a random sample.”
THIS ENTIRE FORUM AND THREAD IS ABOUT FIELD TEMPERATURE MEASUREMENTS FROM INDIVIDUAL, FIXED STATIONS!
You ARE a sealion troll. You keep wanting to redirect the issue to something no one else on here is interested in!
“You ARE a sealion troll.”
So true; as I’ve said before, he hammers everything into the same hole of standard statistical sampling. What extrudes out of that hole is magically transformed into a normal distribution of statistical bliss.
And climate “science” still never reveals any histograms.
“ROFL!!! So *every* single field measuring station, from the Artic to the Antarctic, creates a random variable with the same distribution”
Nope. It would really help your pain if tried to understand these things.
“You keep wanting to redirect the issue to something no one else on here is interested in!”
This entire thread started just becasue you refused to explain what x and y where in your equation. You wanted to make absurd claims about anomalies, and then kept distracting the question into other directions rather than just accept that the variance of a single value is not the same as the variance of a mean.
“Nope. It would really help your pain if tried to understand these things.”
If the measurement stations from the Artic to the Antarctic do *NOT* create the same distribution then you can’t calculate a direct variance for their combination!
Do you have even the smallest clue as to how to calculate the variance of combined random variables that have different variances? My guess is that you don’t.
“This entire thread started just becasue you refused to explain what x and y where in your equation. “
No, this entire thread started because, as usual, you tried to say that for temperature all measurement uncertainty is random, Gaussian, and cancels. It’s what you ALWAYS do. The clue is when you try to imply that the measurement uncertainty of the average is the SEM and can be arbitrarily reduced by making more measurements – which only applies in the case of multiple measurements of the same thing by the same device under the same conditions, something that doesn’t exist for the global temperature data. When you have single measurements of multiple things using different devices under different conditions the measurement uncertainty of the average is the sum of the individual measurement uncertainties.
You can’t even offer up the variance of the temperature data for a single station let alone the combined variance for the GAT. You haven’t shown a histogram confirming that the individual measurement station data is Gaussian or even close to Gaussian let alone the global combined data set.
Until you are willing to offer up ALL of the required statistical descriptors that allow identification of the distributions (including variance, kurtosis, skewness, quartiles, range, etc) it isn’t even worth discussing the issue with you.
“If the measurement stations from the Artic to the Antarctic do *NOT* create the same distribution then you can’t calculate a direct variance for their combination!”
You made the same argument yesterday, I explained why I thought you were wrong. You ignore that and just repeat the same question. Yet you claim I’m sealioning.
Again, the randomness in the variables used in a sample has nothing to do with how random any location is – it’s the randomness from randomly selecting a location. If it was possible to create a global temperature average from a purely random sample, it might work like this. On any given day generate a large number of random locations on the planet – and on that day go to everyone of those locations and take the temperature. Then average all those temperatures. Each temperature is a random, variable coming from a distribution that is defined by the distribution of temperatures across the planet. How much any one location will vary over the coming days is irrelevant – we are only taking a snapshot of individual locations.
A more practical example would be finding the average height of pupils at a school. You select a sample of children at random, say by putting each name into the hat and drawing 30 out at random. You then measure each selected child. Each one is a random variable taken form the distribution of the heights of all children in the school. It has nothing to do with how much variability there is in any one child over time.
“Do you have even the smallest clue as to how to calculate the variance of combined random variables that have different variances? My guess is that you don’t.”
We’ve been talking about this all along – it’s the rules for for combining random variables. Assuming by combining you mean taking an average it’s.
var(AVG) = [var(X1) + var(X2) + … + var(XN)] / N^2
Each var(X) can be different, and there is zero requirement that any of them are normally distributed.
“No, this entire thread started because, as usual, you tried to say that for temperature all measurement uncertainty is random, Gaussian, and cancels.”
It’s a bit silly making up these lies when anyone can just look up this thread to see what I actually said.
You were the one who talked about combining random variables to get an anomaly var(x+y) = var(x) + var(y). You are in that assuming that the temperatures are random – there’s a clue in talking about them being random variables. And you are assuming they are independent, or else that equation won’t work. And guess what? – that equation is showing the uncertainty is cancelling.
And, as you should have noticed by now, I’m explicitly saying that there is no assumption the variables are Gaussian.
“The clue is when you try to imply that the measurement uncertainty of the average is the SEM and can be arbitrarily reduced by making more measurements …”
That’s what the rules for combining random variables say – I can’t help it if you keep pretending to understand them yet keep getting them wrong.
“When you have single measurements of multiple things using different devices under different conditions the measurement uncertainty of the average is the sum of the individual measurement uncertainties. ”
I keep suggesting you test this hypothesis in the real world – but you keep coming up with excuses.
“You haven’t shown a histogram confirming that the individual measurement station data is Gaussian or even close to Gaussian let alone the global combined data set. ”
I’m not the one claiming they have to be Gaussian. Remind me about sealioning again, constantly asking for evidence, whilst ignoring evidence that has already been given, wasn’t it?
“… it isn’t even worth discussing the issue with you. ”
Do you really think you’ve been discussing anything with me? You never attempt to engage with anything I’ve said, and just see your role as shouting at me until I accept you are right about everything.
“It’s a bit silly making up these lies when anyone can just look up this thread to see what I actually said.”
If the global data base is a sample and the data points in the sample have an uncertainty component then those uncertainties should be propagated onto both the mean calculated for the sample and for the SEM estimated from the sample.
Yet you do neither. Which goes along with your meme that all measurement uncertainty is random, Gaussian, and cancels.
You can keep on denying it all you want. I’ll keep pointing it out. It doesn’t matter whether you state that assumption explicitly or try to hide it by making it an implicit, unstated assumption. It just comes through in everything you claim assert, or say.
“You don’t know how to combine the variances of random variables with differing variances.”
You’ve said that multiple times and ignored my answers. It’s very easy to combine random variables with different variances. You’ve even shown how to do it for addition. Say you want to combine N random variables each with a different variance. The variance of the average is just the sum of the variances divided by N^2.
Let me give you an example. Take out a set of platonic dice, a D4, D6, D8, D12 and D20. Through them and take the average. I say the average will be a random variable with
mean(Avg) = (mean(D4) + mean(D6) + mean(D8) + mean(D12) + mean(20)) / 5
and
var(Avg) = (var(D4) + var(D6) + var(D8) + var(D12) + var(20)) / 25..
That is
mean(Avg) = (2.5 + 3.5 + 4.5 + 6.5 + 10.5) / 5 = 5.5
var(Avg) = (15/12 + 35/12 + 63/12 + 143/12 + 399/12) / 25 = 2.18
sd(Avg) = √var(Avg) = 1.48
The fun part is you could test this with real dice – through them and record the average a number of times and see how close the sd is to that predicted by the rule.
But as you won;t I’ll do it for you, using R. A rolled those dice 10000 times. Here are the first few to give you an idea
Now I just check the details of those 10000 averages
Pretty close.
Note, that not only the variances and means all different, but none of them are normally distributed.
As you keep begging me for histograms here’s one for the averages of this experiment. It won’t be exactly normal, but not far of.
Until you can start using the term “measurement uncertainty” and address that issue it is not worth my time to answer you any further. The global temperature is not a dice roll. Nor is it based on a random, Gaussian distribution. Nor is the measurement uncertainty random and Gaussian, it does not cancel.
Until you accept those truths there is no reason to try and educate you further.
“discrete probabilities are not the same as set of temperature measurements. Especially when the assumption is that the temperatures from different stations are dependent.”
Completely expected and pathetic evasion. Asks about combining random variables, then complains I used random variables.
It would work with continuous random variables or any model of measurement uncertainty. You know why? Because the maths works. Something Tim ought to be capable of understanding, or at leas demonstrating to himself.
And no, it’s a different equation if the variables are dependent, but again that wasn’t the question that was asked.
“To add variances that are not the same you must properly weight the variances.”
I’ve just demonstrated that you don’t do that. But Tim’s belief in his own wisdom trumps all actual evidence.
“Until you can start using the term “measurement uncertainty” and address that issue it is not worth my time to answer you any further.”
We’ve been talking about measurement uncertainty for close to three years. Hence all the books on error analysis and the GUM. But then he’ll complain that the mean is not a measurement so none of that applies. But then he’ll complain when you talk about samples and not the measurement uncertainty.
By the way, this is at least the third time in this comment section he’s promised to stop discussing this, always followed by another half dozen questions he’ll demand I answer.
“The global temperature is not a dice roll.”
This entire discussion started when he was using random variables to model temperature.
“Nor is it based on a random, Gaussian distribution.”
My example was not based on Gaussian distributions.
“Nor is the measurement uncertainty random and Gaussian, it does not cancel.”
Magical thinking.
“Until you accept those truths there is no reason to try and educate you further.”
Sol sad. I’m sure in his own mind he’s been trying to educate me.
This entire post is full of idiocy.
For example “I’ve just demonstrated that you don’t do that”
You didn’t demonstrate anything of use. Variance is dependent not only on the range of values but on their “density”, if you will. It’s not obvious that you even understand why variances add.
variance is dependent on the sum of (X_, – X_bar)^2/(n-1) if you have a sample. So, even if you add two distributions that are exactly the same the sum will double but (n-1) will not, it will always be one less than the number of entries. If you have ten entries then the sum will have 20 entries but the divisor will only be 19. The numerator and the divisor don’t grow equally.
If the distributions have different numbers of entries then you have to weight the variances to account for that. If your baseline data set has more entries than your current station entry then when you do the anomaly you have to weight the variances when you subtract.
It’s not obvious that there is *anything* in the climate science statistical analysis of the global temperature that is done properly. It’s done the *easy* way, not the “right” way. And you keep trying to justify it!
“We’ve been talking about measurement uncertainty for close to three years.”
And yet you won’t use the phrase “measurement uncertainty of the mean”. You always just say “uncertainty of the mean”. Why is that?
“This entire discussion started when he was using random variables to model temperature.”
I have *never* used random values to model temperature. You have me confused with bdgwx. Can you get *anything* right?
tpg: “The global temperature is not a dice roll.”
tpg: “Nor is it based on a random, Gaussian distribution.”
tpg: “Nor is the measurement uncertainty random and Gaussian, it does not cancel.”
“Magical thinking.”
This is why I say you ALWAYS apply the meme that measurement uncertainty is always random, Gaussian, and cancels.
“Nor is the measurement uncertainty random and Gaussian, it does not cancel.” (TG)
“Magical thinking.” (bellcurvewhinerman)
He denies it, but his own words betray him.
“He denies it, but his own words betray him.”
EVERY SINGLE TIME!
Yep!
“This entire post is full of idiocy.”
No spoilers, I haven’t read it yet.
“You didn’t demonstrate anything of use.”
This was in response to TG’s claim that:
“To add variances that are not the same you must properly weight the variances.”
The thing is, what I demonstrated was that averaging 5 values (dice rolls) with different variances did not require any weighting of the values in order to get the expected result.
Here’s Tim’s response
“Variance is dependent not only on the range of values but on their “density”, if you will. It’s not obvious that you even understand why variances add.”
Correct this is full of idiocy. In this case I used rectangular distributions so there was no density, if I’d used other distributions the variance would depend on the probability density, but none of this requires you to weight the variances. As so often you makes an incorrect claim, and then tries to change the subject when he is caught out. And then lashes out with another insult in order to deflect from the point.
“variance is dependent on the sum of (X_, – X_bar)^2/(n-1)”
That’s talking about sample variance – in the case of die rolls we already know the variance, so it’s just based on the density of the square differences divided by n. In this case there’s a simple rule for a fair n-sided die – the variance is (n^2 – 1) / 12.
“So, even if you add two distributions that are exactly the same the sum will double but (n-1) will not, it will always be one less than the number of entries.”
Nope, no idea what the point is here.
If you want to know the variance of a random variable you can either work it out logically, as in the case of an assumed fair die, or you could take hundreds of examples and calculate it from those results. If you throw the die enough times the n-1 becomes irrelevant and there is no practical difference in the result if you divide by n.
“If you have ten entries then the sum will have 20 entries but the divisor will only be 19. The numerator and the divisor don’t grow equally.”
I think you are confusing two things – not for the first time. The variance in the individual random variables – which is a property of the probability distribution, and idea of taking the variance of 10 different random variables. But this isn’t what we are doing. I’m taking the average (as a random variable) of the 5 rolls and seeing what the variance of that random variable. You could do the same with the sum of the 5 rolls. You could even work out what the sample variance of those 5 rolls would be as a random variable, which then would mean you’d have the variance of the variance.
But I’ve no idea how you get to adding 10 random variables will give you 20 entries.
“If the distributions have different numbers of entries then you have to weight the variances to account for that.”
Which wasn’t what you said. You said if they had different variances they would need different weightings. I think what you are talking about here is pooling, but that’s not at all what I was doing in my example. Just 5 dice averaged together.
“If your baseline data set has more entries than your current station entry then when you do the anomaly you have to weight the variances when you subtract.”
And now we are back to anomalies, and the question I first asked – what were the random variables x and y representing when you said var(x+y) = var(x) + var(y)?
Regardless, the claim about weighing the variances still makes no sense. You’ve literally just said you are adding two random variables and the resulting variance will be var(x) + var(y) and no you are saying that won’t be correct unless and it should be something like a * var(x) + b * var(y).
“It’s not obvious that there is *anything* in the climate science statistical analysis of the global temperature that is done properly.”
How would you know? You’ve obviously never read any of the analysis – you just keep assuming that all they do is add variances.
“And yet you won’t use the phrase “measurement uncertainty of the mean””
How many more times will you repeat this lie. I keep saying that if you want the measurement uncertainty of the mean you should use equation 10, or the other ones, to determine how much the measurement uncertainty will affect the uncertainty of the mean. Or you can use the TN1900 argument and claim that the variance of daily values is the measurement uncertainty, and use the SEM based on that to get the “measurement” uncertainty of the mean.
“I have *never* used random values to model temperature. ”
So what did you mean when you said var(x + y) = var(x) + var(y)? Even Jim thought they were random variables.
In reality, you might not think you are, but every equation used is based on the concept of them being random variables – that’s the basis of all these uncertainty calculations.
“This is why I say you ALWAYS apply the meme that measurement uncertainty is always random, Gaussian, and cancels. ”
You always say this when you know you’ve lost the argument.
“But this isn’t what we are doing. I’m taking the average (as a random variable) of the 5 rolls and seeing what the variance of that random variable.”
I told you – unless you are willing to address metrology in the real world and how it applies to temperatures I’ll not answer you. Here you are deflecting into dice rolls – which have nothing to do with temperature measurements in the real world and combining them into a GAT.
Argue you it out with yourself.
“I explained why I thought you were wrong.”
Your explanation was garbage. It didn’t address how to add variances of random variables with different distributions and variances!
*DO* you know how to add the variances of random variables whose variances are different?
“ If it was possible to create a global temperature average from a purely random sample”
Now we are back to random variables. Temperature measurements are either independent or they are not. If they are independent then infilling and homogenization contaminates the data set. If they are dependent and can be infilled and homogenized then they do not meet the restriction needed for the CLT to work.
Pick one and stick with it!
“Your explanation was garbage. It didn’t address how to add variances of random variables with different distributions and variances!”
“Now we are back to random variables. ”
Ignores the word “if”, and complains I’m talking about random variables in the very comment where he demands I explain how random variables work.
Come on dude! You are relying too much on basic learning of statistics where everything is 100% accurate and Gaussian.
Ask yourself this, “Can I ever get 10 heads in throw of a coin?”. What then makes you think that every selection of data points from a population will will always have the same distribution?
You DEFINITELY need a reference for this.
Remember the same distribution means the same μ and the same σ. This means the sample means distribution will have ONE value of μ, and the SEM will be zero. I want to see a good reference for this.
“You are relying too much on basic learning of statistics”
Yes, because I’m trying to explain how basic statistics work and you lot keep getting it wrong. You have to start at the beginning – you won’t understand advanced mathematics if you keep claiming that 2 + 2 = 22.
“…and Gaussian”
And now you are just repeating your brother’s lies. I explicitly said the random variable has the same distribution as the population. That may well not be Gaussian. I don’t know why it never penetrates your conscious brain that there is a reason for the the CLT, and that is you cannot assume the parent population is Gaussian. If you could there would be no need to use the CLT because the sum of two Gaussian distributions is Gaussian.
“Ask yourself this, “Can I ever get 10 heads in throw of a coin?””.
This is like being back in first form. Yes you can toss 10 heads in a row – the probability of any 10 tosses of a fair coin being all heads is 0.5^10, or 1/1024. It won’t happen very often, but it will happen.
“What then makes you think that every selection of data points from a population will will always have the same distribution?”
It won’t. It’s almost impossible that a random selection of points will have exactly the same distribution as the population. That’s the whole point of talking about standard errors – the dispersal of values in sampling distribution. All you can say is the larger the selection the closer you are likely to be to the population distribution.
“You DEFINITELY need a reference for this.”
Careful, you’ll be accused of being a sealion if you keep asking for references.
Do you want a reference for the thing I said is almost never going to happen, or for what I actually said, that the distribution will tend to the population distribution?
“It won’t. It’s almost impossible that a random selection of points will have exactly the same distribution as the population.”
You said earlier: “A sample is made up from randomly selected values from the population. As long as the selection is random they will be iid regardless of the distribution of the population.”
Which is it? If they are iid then they must have the same mean and standard deviation.
First you say they will have and then you say they won’t.
As usual, you just say what you think you need to say at the time. And then whine when someone calls you on it!
You simply have no idea what you are talking about, EVER! And yet here you are expounding on how to do metrology while saying everyone from Pat Frank to the GUM is wrong about metrology. What a load of hubris!
He can’t keep his hand-waving consistent!
“Which is it?”
You’re either a troll or an idiot, possibly both.
You just don’t understand the concept of a random variable or what identically distributed means. Two random variables can have the same distribution, it does not mean you will get the same values from them each time. There’s a clue in the word “random”.
“… saying everyone from Pat Frank to the GUM is wrong about metrology”
When have I said the GUM was wrong about metrology?
“You just don’t understand the concept of a random variable or what identically distributed means.”
go here: https://math.stackexchange.com/questions/223373/iid-variables-do-they-need-to-have-the-same-mean-and-variance
or here: https://www.statisticshowto.com/iid-statistics/
—————————————-
“Each distribution has its own characteristics. Let’s say we are looking at a sample of n random variables,
X1, X2,…, Xn. Since they are IID, each variable Xi has the same mean (μ), and variance(σ)2″
——————————————–
Or here: “https://towardsdatascience.com/iid-meaning-and-interpretation-for-beginners-dbffab29022f
—————————————
The notation X ~ IID(μ,σ²) represents sampling of (X1, …, Xn) in a purely random way from the population with the mean μ and variance σ². That is,
————————————————————–
Why do you *absolutely* insist on getting on here and making is inane assertions that are so easily disproven?
“When have I said the GUM was wrong about metrology?”
Every time you claim the SEM is a measurement uncertainty.
I’ve go too much to do. You are going to have to stew in your own juices for a while trying to figure out how you get so much so wrong.
“When have I said the GUM was wrong about metrology?”
Every time he claims uncertainty goes down by averaging disparate temperature data points.
I have tried very hard to show that one needs both training in making measurements and what the GUM is trying to do.
One must understand what “q”, “qₖ”, “q̅”, all mean. Dispersion of measurements attributed to the measurand ARE ACTUAL MEASUREMENTS within an interval defined by the standard deviation of the measurement data.
The standard deviation of the mean does not define an interval containing measurements but an interval where the single value of of the mean may lay.
I don’t know how to tell folks anything else.
He refuses to listen, likely because the cost of acknowledging the truth is too high—would have to let go of these impossibly tiny uncertainty numbers.
“One must understand what “q”, “qₖ”, “q̅”, all mean. ”
It’s all explained in the GUM. q is a quantity that varies randomly – i.e. a random variable, which in this case means a measurement with a random error.
qₖ is one is one independent observations – i.e. a measurement. There are n in total.
q̅ is the arithmetic mean of those n observations.
“The standard deviation of the mean does not define an interval containing measurements but an interval where the single value of of the mean may lay.”
Exactly – and that’s why it it’s described as the uncertainty of the mean. The mean in this case being
“I don’t know how to tell folks anything else.”
I think you did a reasonable job, I just suspect you don’t agree with what you are telling them.
These don’t go together unless n=1.
As I have tried to explain several times, your functional relationship f(x1, …, xn) = (t1+ t2 + … + t_n)/n, will only give you ONE (1) measurement –> [q₁]
You end up with:
q̅ = (1/1)Σq₁ = q₁
You can’t have a variance with just one value. [(q₁ – q̅)²] / (1 – 1) = 0
Where do you get more than q₁?
Where do you think the need for MULTIPLE MEASUREMENTS of the same thing with the same device originated.
“qₖ is one is one independent observations – i.e. a measurement. There are n in total.”
Bad typing. Should have read
qₖ is one of a number of independent observations – i.e. a measurement. There are n in total.
“As I have tried to explain several times, your functional relationship f(x1, …, xn) = (t1+ t2 + … + t_n)/n, will only give you ONE (1) measurement –> [q₁]”
You keep confusing the description of a type A uncertainty for a single thing, with the application of equation 10 to determine a combined standard uncertainty. If you know the uncertainties of each measurement that makes up the function, (whether through Type A or B analysis), then you only need that one calculation of the uncertainty which will be relevant to the one result you get from that function.
You can take multiple measurements of each of the xi, in f(x1, …, xn) and get a different result for the function each time, and use those different results to determine the uncertainty using the experimental standard deviation of the mean if you want. But that isn’t using equation 10, which is what we’ve been talking about.
It doesn’t really matter what your interpretation of uncertainty is. No one that understands it believes your interpretation and that is what matters.
Here is the crux of measurement uncertainty. If you quote the standard uncertainty of the mean, no one can tell how many experiments you did nor what the range of your data was.
For all anyone knows, you had a mechanized process and took 1 million samples of data with to get a standard deviation of the mean.
You could quote your experimental combined standard uncertainty of the mean as ±1×10⁻⁶. Yet your experimental combined standard uncertainty is ±1. Both with a mean of 50. That would mean you know the mean to 50.000000 ±1×10⁻⁶ whereas you only really know the mean to be 50 ±1.
Believe me, it won’t take long for your fraud to be discovered.
Exactly right, he is fooling no one but himself.
“If you quote the standard uncertainty of the mean, no one can tell how many experiments you did nor what the range of your data was.”
Well, you usually wouldn’t just quote the SEM. It’s going to be part of a report where you describe the experiment, including all the relevant details of the sampling method.
“You could quote your experimental combined standard uncertainty of the mean as ±1×10⁻⁶”
You still haven’t got any sense of the scale of things. If your combined standard uncertainty, or your experimental standard deviation of the mean is 1×10⁻⁶ it means you’ve taken a million measurements that already had an uncertainty of 1×10⁻³. And you would have to explain how you are ruling out any dependence or systematic bias in your sampling.
And in fact you go on to say the experimental standard deviation of the measurements is 1, so the only way to get the experimental standard deviation of the mean down to 1×10⁻⁶, would be to take 10¹² measurements. Do you have any idea how long that would take? Even taking one measurement every microsecond is still going to take over 10 days. And at that frequency I doubt you could claim each measurement is independent.
But again, following the GUM, any report needs to fully describe the measurand, and how the measurements were made.
“Yet your experimental combined standard uncertainty is ±1.”
So? You keep begging the question here. You have decided that the correct uncertainty of a mean is the experimental standard deviation of the measurements, and then just assert it is true.
I disagree, it makes no sense, but if you think I’m wrong you need to explain a context where it makes sense.
“The standard deviation of the mean does not define an interval containing measurements but an interval where the single value of of the mean may lay.”
It all goes back to the meme that all measurement uncertainty is random, Gaussian, and cancels. Thus the mean is a 100% accurate TRUE VALUE. The closer you can get to that mean with a sample, i.e. the smaller the SEM is, the closer you are to the TRUE VALUE.
Everyone in climate science or who is supporting the GAT depends on this meme but they either don’t realize it or they are afraid to state it explicitly because of the possibility of climate science supporters, as it exists today, will cancel them.
The nonsense about uncertainty not being an interval, and that the GUM doesn’t use it, is nutty.
The Guide for the Expression of Uncertainty tells you to take the combined standard uncertainty (small u), quantified by standard deviation, not standard deviation over root(N), and multiply it by an appropriate coverage factor (k) to get expanded uncertainty (big U). The GUM then says measurement results (Y) are to be reported as Y ± U.
This is an interval, except in trendology.
“The Guide for the Expression of Uncertainty tells you to take the combined standard uncertainty (small u), quantified by standard deviation, not standard deviation over root(N), and multiply it by an appropriate coverage factor (k) to get expanded uncertainty (big U). The GUM then says measurement results (Y) are to be reported as Y ± U.”
What they say is that it’s recommended and they advocate that the combined standard uncertainty be used as the parameter for expressing the result of a measurement.
They then say
A value that defines an interval, is not the same as saying the interval is the uncertainty.
“A value that defines an interval, is not the same as saying the interval is the uncertainty.”
It is when that interval *IS* the measurement uncertainty!
Begging the question again.
You are assuming the interval is the measurement uncertainty, despite everything in the GUM stating it is a single positive value.
bellman *still* refuses to use the unambiguous definitions of
-measurement uncerainty
-standard deviation of the sample means
bellman is even trying to say that Taylor never uses the term “standard deviation of the sample means when Taylor’s Sec. 4.4 is tittled:
THE STANDARD DEVIATION OF THE MEAN
Taylor’s Chapter 4 is all about *RANDOM, GAUSSIAN” data.
from the intro to Chapter 4:
“Most of the remainder of this chapter is devoted to random uncertainties.”
As usual, bellman is cherry picking stuff he doesn’t understand!
“bellman is even trying to say that Taylor never uses the term “standard deviation of the sample means when Taylor’s Sec. 4.4 is tittled:
THE STANDARD DEVIATION OF THE MEAN”
Do you see an ‘s’ there? Or the word “sample” for that matter?
“Taylor’s Chapter 4 is all about *RANDOM, GAUSSIAN” data.”
I keep telling you this depends on random independent random variables. Taylor does what you keep claiming I say, which is to just assume that nearly all measurement uncertainties are normally distributed. He never uses the CLT, so it’s convenient to just assuming all the measurements are normally distributed, in order for the result to be normal.
“go here”
I didn’t say you couldn’t find references to them – I’m saying you don’t seem to understand them.
Here’s the comment I made and your reply. That’s where you demonstrate your ignorance.
————————————————————–
“It won’t. It’s almost impossible that a random selection of points will have exactly the same distribution as the population.”
You said earlier: “A sample is made up from randomly selected values from the population. As long as the selection is random they will be iid regardless of the distribution of the population.”
Which is it? If they are iid then they must have the same mean and standard deviation.
First you say they will have and then you say they won’t.
————————————————————–
You keep confusing a sample and a random variable. If several samples are made up random variables which are iid it means each random variable has the same mean and standard deviation. It does not mean each sample has the same mean and standard deviation.
“Every time you claim the SEM is a measurement uncertainty.”
I don’t say that. I say the SEM is the uncertainty of the mean (or at least the precision). The measurement uncertainty could be zero and you could still have a large SEM, because it is based on the variation in the values, not just on their measurement uncertainty.
“I’ve go too much to do. You are going to have to stew in your own juices for a while trying to figure out how you get so much so wrong.”
You do realise that this is at least the third time you’ve promised to end the discussion – and each time you follow up with about 100 ever longer comments.
“ “A sample is made up from randomly selected values from the population. As long as the selection is random they will be iid regardless of the distribution of the population.””
I didn’t say that! YOU DID! I was quoting YOU.
“The measurement uncertainty could be zero and you could still have a large SEM, because it is based on the variation in the values, not just on their measurement uncertainty.”
Then why are you arguing that the SEM is a measurement uncertainty?
Because it gives the tiny numbers he needs to prop up his trendology noise.
It gives you a bigger number than the measurement uncertainty.
No, it doesn’t! The standard deviation of the sample means had better be smaller than the population standard deviation!
If it isn’t then the fomula SEM = SD/sqrt(n) has a problem!!! Because tht SD *IS* the population standard deviation. The sample deviation is only used if you don’t know the population standard deviation. That means it is an estimate with uncertainty – even though that uncertainty is never quantified by statisticians in climate science.
If the SD of the sample is so large that after being divided by the sqrt(n) it is bigger than the population SD then you sampling protocol is simply crap!
(Day three of Tim refusing to discuss this any further)
“The standard deviation of the sample means had better be smaller than the population standard deviation!”
The SEM is usually smaller than the standard deviation of the population – but the standard deviation of the population is not the measurement uncertainty of the mean. And you endlessly asserting it is doesn’t make it so.
“I didn’t say that! YOU DID! I was quoting YOU.”
You still don’t get random variables. IID means that two random variables have the same distribution and are independent. It does not mean that a value drawn from each of the random variables will be identical. Two fair 6 sided dice are IID. But if I throw them both there is only a 1/6 chance that they will give the same value.
A sample is made up of values that are randomly drawn from a set of random variables all of which are IID, but that previous one.
“Then why are you arguing that the SEM is a measurement uncertainty?”
Why do you just keep repeating these lies. I am not saying a SEM is measurement uncertainty. A SEM is the standard deviation of a sampling distribution, it tells you the uncertainty of your sampled mean, and that includes and random measurement errors that went into the sample. If you only want to talk about measurement uncertainty you are ignoring the uncertainty caused by the random sampling – you are just looking at the uncertainty of your average as an exact value.
But – regardless the calculations tend to end up the same, because they all rely on the concept of random variables and how you combine them. The uncertainty of any type will be some uncertainty divided by √N when taking an average and the uncertainties are random – becasue that’s how random variables combine. The difference is in which uncertainty you are dividing by √N.
“ It does not mean that a value drawn from each of the random variables will be identical.”
I didn’t say that a value drawn from each will be identical. I said the mean and variance will be the same!
Stop making stuff up!
“I didn’t say that a value drawn from each will be identical. I said the mean and variance will be the same!”
You were talking about two random samples being identical. Look back up this thread to see the claim you were making if you don’t remember.
“You keep confusing a sample and a random variable. If several samples are made up random variables which are iid it means each random variable has the same mean and standard deviation. It does not mean each sample has the same mean and standard deviation.”
Unfreakingbelivable!
What do you think single measurements of multiple things using different devices under different conditions *IS*?
It is a set of samples with different means and different standard deviation!
You have now changed your argument since you were shown to be wrong. Typical.
For the typical use of the CLT – THE SAMPLES MUST BE IID!
If the samples are not iid, i.e. different variances, then you *must* do something to account for this.
Climate science never even calculates the variance of their samples let alone apply corrections for non-iid samples.
And neither do you!
And they never will (and the “they” includes UAH, unfortunately, who doesn’t even report N).
“Unfreakingbelivable! ”
You realize that’s not much of an argument – though it’s about as convincing as most of yours.
“What do you think single measurements of multiple things using different devices under different conditions *IS*?”
I think the answer is in the question. It’s measuring multiple things with different devices ones each.
“It is a set of samples with different means and different standard deviation!”
Yup.
“It is a set of samples with different means and different standard deviation!”
It is not.
Assuming you are averaging all your single measurements of different things you have a single sample, that is the set of all the single things you measured, along with any errors in your measurement.
If these different things were randomly selected from a population, then that random selection means that each measurement can be seen as a selection from a random variable which takes it’s distribution from the population. And hence each random variable will be iid.
“You have now changed your argument since you were shown to be wrong. Typical.”
You say that as if it’s a bad thing – you should try it some time.#
But I don’t think I have in this case – it’s you misunderstand what I say and refuse to listen to any explanations as to why you are wrong.
“For the typical use of the CLT – THE SAMPLES MUST BE IID! ”
The values that make up the sample must be IID. Except they don’t – the CLT can work with non identically distributed variables, it just requires a more complicated proof.
“If the samples are not iid, i.e. different variances, then you *must* do something to account for this.”
And what do you think that “something” is?
I demonstrated sometime ago what happens when you take the average of 5 different sided dice – as always you just blew the example away.
BWAHAHAHAHAHAHAHAHA!!!
Bellman who is a ding a Ling!
You are simply unable to make an honest reply.
“x” and “y” are random variables. They are made up of individual values. They may contain from 1 piece of data to many pieces. Random variables may have different mean, median, or mode depending on the distribution. A random variable also has a variance calculated using the mean comparted to each piece of data.
There, no explain why variances are never calculated or propagated in climate science./
I know they’re random variables. The question is what do you think they represent. Individual temperatures, or averages?
The point which you never acknowledge is that the variance of a random variable representing an average of random variables is not the same as the variance of the individual random variables.
Argument from Ignorance AGAIN?
“The point which you never acknowledge is that the variance of a random variable representing an average of random variables is not the same as the variance of the individual random variables.”
What in hell do you think we’ve been trying to tell you?
Var(X+Y) = Var(X) + Var(Y)
Var(X) ≠ Var(X+Y)
Var(Y) ≠ Var(X+Y)
Keep it up Captain Obvious!
Just keep demonstrating you don’t understand what any of these fallacies actually mean. It’s a pathetic debating style in any case.
“What in hell do you think we’ve been trying to tell you?”
How should I know, you refuse to define your terms and keep changing your argument. I’m still waiting for you to explain what you think X and Y are when using X + Y as a model for an anomaly. It’s clear why you won’t do that. You want them to be averages, yet claim their varience is that of an individual measurement.
Then when I mention averages you bring up the variance of a sum.
Var(X+Y) = var(X) + var(Y)
Correct.
Var([X+Y]/2) = [var(X) + var(Y)]/4
Equaly correct.
Or are you going to feign ignorance of that basic fact?
Now you are getting to the crux of the whole matter.
Let’s look at individual temperatures of Tmax and Tmin at ASOS stations. NOAA shows ASOS uncertainty of ±1.8° F for each temperature reading. That is a standard uncertainty expressed as a standard deviation.
Now lets combine those into a Tavg. By definition, a single temperature reading is a random variable with both a mean and variance. The assumption is that the variance has been predetermined from a statistical analysis of multiple readings that form a normal distribution, and that can be applied to future readings.
Therefore, Tavg is determined in two steps.
Here is where the first disagreement arises. You and others then want to calculate a new variance by dividing by 2 to obtain an average uncertainty.
But first, let’s calculate the total variance of the added random variables. Since they are both of the same size, “1”, they can be added without worrying about sensitivity factors. Variances are added by RSS as follows:
Var_Tavg = σ² = 1.8² + 1.8² = 6.5
σ = √6.5 = 2.6
Now if one assumes an SDOM can be calculated, we can divide by √2 and obtain, SDOM = 1.8. Then expand it by a T factor of 12.7 @ur momisugly DOF = 1, and you get 22.9.
You end up with μ ± 22.9
Just for grins, let’s calculate the standard deviation of two typical temperatures of 80° F and 60° F. I obtained a value of 14.1. So μ ± 14.1.
Now, tell us just why Tmax and Tmin are not random variables consisting of 1 value each, with both a mean and an uncertainty distribution.
He won’t answer because he can’t. He’s sealioning I guess to generate clicks. Makes him feel “big” I suppose.
Is there a time limit before I have to answer every one of your inane questions? I replied at length to Jim’s length comment about four and and a half hours after he posted it. I wasn’t in most of the day, and replied as soon as I got back – but as always my responses tend to go into too much detail, and whilst I’m composing my reply, you are just making snide trollish comments about how I can’t answer.
“Now you are getting to the crux of the whole matter.”
I wish we would, but as so often you switch to talking about maximum and minimum temperatures, and mixing up different means. It would be much easier if we just stuck to the question of what the variance of a random variable is when it’s thew average of two random variables.
“But first, let’s calculate the total variance of the added random variables. Since they are both of the same size, “1”, they can be added without worrying about sensitivity factors. Variances are added by RSS as follows:
Var_Tavg = σ² = 1.8² + 1.8² = 6.5
σ = √6.5 = 2.6”
And this is just you begging the question. With no justification you assert that the variance of an average of two random variables is the same as the sum.
As I said above, the correct variance would be
Var_Tavg = σ² = (1.8² + 1.8²) / 4 = 1.6
σ = √1.6 = 1.3”
Common sense should tell you that the standard deviation of an average cannot be greater than the standard deviation of either value. And you can easily test the figures by generating lots of random values.
“Now if one assumes an SDOM can be calculated, we can divide by √2 and obtain, SDOM = 1.8.”
The standard deviation of the average already is SDOM – it’s literally what SDOM means. But if you meant var_Tsum, raver than Tavg in your above equation the correct calculation would be
SDOM = 1.8 / √2 = 1.3
You are not dividing the variance of the sum by root N, but the standard deviation of the 2 values. Alternatively you could take the standard deviation of the sum, 2.6, and divide that by 2. Both are simple applications of the rules for combining random variables.
“Then expand it by a T factor of 12.7 @ur momisugly DOF = 1, and you get 22.9.
You end up with μ ± 22.9”
Good grief, No. I can’t begin to say how horrendously wrong that is. As so often I think your problem is that rather than trying to understand what these equations mean, you just try to crib things from examples.
The student-t distribution is used for small samples, for one reason. And that’s to reflect the uncertainty in your estimate of the population standard deviation. With a random sample of just 2 values, your sample SD will be a poor estimate of the population SD, and the large confidence interval reflects that uncertainty.
But in this case there is no estimate of the standard deviation. You already know it. It’s 1.8°F. If you can assume this uncertainty is normally distributed, the 95% confidence interval is just 2σ. You end up with μ ± 2.6°F.
“Just for grins, let’s calculate the standard deviation of two typical temperatures of 80° F and 60° F. I obtained a value of 14.1. So μ ± 14.1.”
Again you forgot to divide by √2, and of course, if the sample was bigger √n gets bigger so the uncertainty gets smaller. I’m assuming you don’t mean these are tmax and tmin, because as you must know by now they are not a random sample of the day’s temperatures.
“Now, tell us just why Tmax and Tmin are not random variables consisting of 1 value each, with both a mean and an uncertainty distribution.”
Why should I do that. Tmax and Tmin can be modeled as two random variables, and Tmean is a random variable given by (Tmax + Tmin) / 2.
Of course you need to define exactly what random variable you are talking about. It could be the random variable of an exact daily value with a random measurement error, or you might think in terms of that TN example, where each daily max and min is taken from a random variable representing all possible values during that month.
You have made a simple algebra mistake.
Let’s use Equation. 10 from the GUM
u𝒸²(y) = Σ (∂f/∂xᵢ)² u(xᵢ)²
THERE IS NO DIVIDE BY “n” IN THIS EQUATION!
If you want to find an average, you must divide BOTH sides by “n”.
Your method would then get (the partials of a single measurement = 1):
(u𝒸/2)²(y) = Σ u(xᵢ/2)² = u(Tmax/2)² + u(Tmin/2)²
Please note that this is dividing both sides of the equation by 2 (“n”). Consequently, you end up with a value of:
[(u𝒸)²(y)] / 4
That IS NOT the same as (u𝒸)²(y).
There is a reason the GUM does not divide the combined uncertainty by “n”. UNCERTAINTIES ADD, ALWAYS!
You are trying to sneakily insert a definition of an average into the process of calculating a temperature uncertainty. That is a failure.
Look at the definition of a mean associated with a measurement. qₖ are independent observations of the measurand. The individual measurements are members in a random variable designated Tavg.
GUM 4.2.1, Eq. 3
q̅ = (1/n) Σ qₖ
If the measurand is defined as “Tavg”, then Tmax &Tmin are independent measurements (observations) of the measurand.
Tavg = [70, 50]
The mean of this random variable uses Eq. 3 and becomes:
q̅ = (1/2)(70 + 50) = 60
and the Type B uncertainty of each is ±1.8. Therefore,
(u𝒸)²(y) = 1.8² + 1.8² = 3.24 + 3,24 = 6.48
and
u𝒸(y) = √6.48 = 2.55
So Tavg = 60 ± 3
You simply can’t start off with an average of all your measurements being the measurand. That means you have no other observations to use in evaluating the uncertainty. The only way to do that is to have multiple readings for each Tmax & Tmin.
Now, let’s do it as NIST TN 1900.
t̅ = 60
SD = 14.1
u(τ) = 14.1/√2 = 10
k = 12,71 (T factor @ur momisugly DOF 1 and 0.05)
ε = 127.1
The interval is -67 to 187 @ur momisugly 95% confidence.
This is not unreasonable assuming a Students T distribution that has longer tails. Another calculation can be done using a normal distribution that uses k =1.96 for a 95% interval. This gives the following:
ε =k•u(τ) = 1.96 • 10 = ±19.6
for an interval of 40 to 80 @ur momisugly 95% confidence.
It should be noted that this only calculates the uncertainty contributed from the data variation. TN 1900 assumes that measurement uncertainty is negligible.
This should lead one to the conclusion that Tavg has a lot of uncertainty associated with it. Is it a good measurand to use for a T_month__avg?
Excellent!
Note that using the standard coverage factor k=2 with U=k*u_c, the average becomes Tavg = 60 ± 5!
“THERE IS NO DIVIDE BY “n” IN THIS EQUATION!”
You’ve asked this many times before and I keep having to give the same answer. (remind me about sealioning.)
“u𝒸²(y) = Σ (∂f/∂xᵢ)² u(xᵢ)²”
The answer’s going to be the same as all the other times you’ve asked. When f is an average of n values (∂f/∂xᵢ) = 1/n.
“If you want to find an average, you must divide BOTH sides by “n””
That’s the second time someones claimed that today – no you don’t. If z is an average
z = (x + y) / 2
You do not have to divide z by 2, z is the result of dividing something by 2.
“the partials of a single measurement = 1”
If you mean the partial derivative – no it isn’t. And we are back to the incorrect claim that Tim now denies he made that the derivative of x/n = 1.
“(u𝒸/2)²(y) = Σ u(xᵢ/2)² = u(Tmax/2)² + u(Tmin/2)²”
Wrong in so many ways.
Just use equation 10. f is a function with inputs Tmax and Tmin. It’s equation is Tmax/2 + Tmin/ 2. u(Tmax) is the uncertainty of Tmax, and u(Tmin) is the uncertainty of Tmin.
(∂f/∂Tmax) = 1/2
(∂f/∂Tmin) = 1/2
u𝒸²(Tmean) = Σ (∂f/∂xᵢ)² u(xᵢ)² = (1/2)² u(Tmax)² + (1/2)² u(Tmin)²
= (1/2)² (u(Tmax)² + u(Tmin)²)
Take the square root of each side gives
u𝒸(Tmean) = 1/2 √(u(Tmax)² + u(Tmin)²)
TBC.
Continued.
“UNCERTAINTIES ADD, ALWAYS!”
You are still under the delusion that writing something in all caps makes it true. Do you have a reference for this? It’s strange that none of the books of the GUM mention this important point.
In truth you don;t believe this, as you keep saying uncertainties do reduce when you take an average of multiple measurements of the same thing. You accept that this applies to the average of daily values during a month – as in TN1900. So many sources explicitly state that when you scale a value you must also scale the uncertainty.
“GUM 4.2.1, Eq. 3”
For some reason you miss the 4.2.3 Eq 5, the equation for the variance of the mean. You divide the variance of the individual measurements by n.
“If the measurand is defined as “Tavg”, then Tmax &Tmin are independent measurements (observations) of the measurand.”
You keep making this same mistake over and over. Tmax and Tm in are not independent measurements of Tavg. They are very specifically measuring the points furthest away from Tavg. If you want to use 4.2, to get the average you would need to take two random temperatures during the day. As in a random sample. The uncertainty would be huge as it’s quite possible you take 2 temperatures close to the coldest or hottest part of the day. What you have is a systematic sample where you know the range of values during the day.
“(u𝒸)²(y) = 1.8² + 1.8² = 3.24 + 3,24 = 6.48”
You forgot to divide by 4. The variance is 1.62 °F². The standard uncertainty is 1.27°F, which is 1.8 / √2.
You are claiming the correct standard uncertainty of the average is √6.48 = 2.55°F, and so are claiming it’s reasonable that the actual average could be anywhere in the interval 60±5.1, using a k=2 expanded uncertainty. But you are also claiming it’s reasonable to assume the max and min values are ±3.6 of the measured values. The problem is the only way for the average to be say 65.1 is for say max to be 75.1 and min 55.1. Both of which are outside the uncertainty range you were claiming for the max and min values.
This is why it doesn’t make sense to me to claim the uncertainty of an average can be greater than that of the individual components. However you define measurement uncertainty, as the spread of likely errors, or as the interval it’s reasonable to attribute the measureand to, you arrive at a contradiction. The nature of an average means at worst the measurement uncertainty cannot be greater than the average of the individual measurement uncertainties.
“You simply can’t start off with an average of all your measurements being the measurand.”
I’ll have to keep asking the same questions, and risk being accused of harassing you. If the mean isn’t the measuarand how ware you using equation 10? And if the mean is not the measurand, what is?
“Now, let’s do it as NIST TN 1900.”
You are just repeating the same argument you keep making and ignoring all the points I make where I say you cannot do it the way you want.
“SD = 14.1“.
Wrong. As I’ve said before the standard deviation of all temperatures during the day cannot be greater than the range of values.
You are claiming that there is a one SD interval for daily temperatures which is [35.9, 84.1], despite the fact you know that all values have to be between 50 and 70. ”
Your problem is again that you are treating the min and max as a random sample. It is not.
Everything else that is wrong follows from that
“The interval is -67 to 187 @ur momisugly 95% confidence.”
And you really can’t see the absurdity in that? You have a minimum value, the coldest temperature recorded during the day, of 50°F, yet you have a belief that there’s a 2.5% chance that the actual mean temperature might have been 117 colder than the coldest point of the day.
Your argument only makes sense if you took two completely random temperatures during the day, and then only if you could assume the distribution of daily temperatures was Gaussian – which they most definitional are not. All this demonstrates is that a sample of 2 is not very useful.
“This should lead one to the conclusion that Tavg has a lot of uncertainty associated with it.”
Only if you made lots of wrong assumptions and refused to listen to anyone trying to correct you.
If you want some idea of the uncertainty involved in actually basing the exact average of daily temperatures using just max and min values you could try looking at actual data. E.g. CRN gives values both as TMean and TAvg. Tmean is based on max and min, Tavg on the sub hourly measurements made throughout the day.
You will occasionally find large dependencies, due to some weird shift in temperatures at just the wrong moment, or in some cases due to glitches in the data,. But nothing near what you are claiming for the 95% interval. And certainly no case where the daily average was smaller than the min or greater than the max.
“The answer’s going to be the same as all the other times you’ve asked. When f is an average of n values (∂f/∂xᵢ) = 1/n.”
You are your own worst enemy. The average of the uncertainties is the AVERAGE UNCERTAINTY!
The average uncertainty is *NOT* the uncertainty of the average.
There is no ∂f/∂x when you are finding the average of the uncertainties!
The “n values” are the uncertainties themselves, not the “x” values.
u_c(y)^2 = SUM (∂f/∂x)^2 u(xi)^2
When you divide SUM (∂f/∂x)^2 u(xi)^2 by n^2 you are dividing u_x(y)^2 by n^2 as well. That is finding the AVERAGE UNCERTAINTY.
What do you think u_c(y) divided by n *IS* if it isn’t the average uncertainty?
“The average of the uncertainties is the AVERAGE UNCERTAINTY!”
No it isn’t. Whatever Pat Frank er al say. Random uncertainty decreases as sample size increases, it does not stay the same.
The fact that there is a 1/n in the equation does not make it an average. You not at any point dividing the sum of the uncertainties by n. You are either dividing the sum of the variancies by n² – not n. Or if all uncertainties are equal you are dividing a single variance by n. Or you are dividing the square root of the sum of the variancies by n, or you are dividing a single standard deviation by √n.
Alm of these follow from the equation, and not one gives you the average uncertainty.
The only way you can get the average uncertainty is if there is no independence in the uncertainties and you have complete correlation.
You really need to stop insulting my algebraic skills – it just draws attention to your own.
Judas H. Priest!
z = (u1/n)^2 + (u2/n)^2 + ….
==> u1^2/n^2 + u2^2/n^2 + ….
==> (u1^2 + u2^2 + …..) / n^2
since u(total)^2 = (u1^2 + u2^2 + …)
==> u(total)^2/n^2
z ==> [u(total) / n ]^2
u(tottal) / n IS THE AVERAGE UNCERTAINTY!
In essence you are calculating the SQUARE of the average uncertainty
if you start with z^2 = (u1/n)^2 + (u2/n)^2 + ….
then you wind up with
z = u(total)/n
The average uncertainty.
I’ll stop insulting your algebra skills when you demonstrate you have some!
“z ==> [u(total) / n ]^2”
Assuming by u(total) you mean the uncertainty of the sum of n values, then well done. You’ve finally demonstrated the point I was making 3 years ago. The uncertainty of the average is equal to the uncertainty of the sum divided by n.
“u(tottal) / n IS THE AVERAGE UNCERTAINTY!”
Oh, and you were doing so well. It is not the average uncertainty – it’s the uncertainty of the average. You problem which you’ve had explained to you many times before, is that u(sum) is not the sum of the uncertainties, hence dividing it by n does not give you the average of the uncertainties.
Let’s use your example with just two uncertainties. Let’s say u1 = 1 and u2 = 3. The sum of those uncertainties is 4 and the average is 2.
Now
z = (u1/n)^2 + (u2/n)^2
= (1/2)^2 + (3/2)^2
= [(1)^2 + (3)^2] / 2^2
= 10 / 4
= 2.5
Hence
u(average) = √2.5 = 1.58
And of course
1.58 ≠ 2.00
therefore uncertainty of the average does not equal the average uncertainty.
“The uncertainty of the average is equal to the uncertainty of the sum divided by n.”
” u(sum) is not the sum of the uncertainties”
ROFL!!!
u1^2 + u2^2 + u3^2 + …. is the sum of the squares of the uncertainty.
“u” is *not* a random variable. It does *NOT* have an average. As I’ve pointed out to multiple times, “u” is a constant.
Dividing a constant by n does nothing but scale the value to a lower number. It has *NOTHING* do actually do with finding anything!
u1^2/n^2 is the same thing. It is scaling the u1^2 value to a lower number. It is not calculating anything to do with uncertainty of anything.
Let me highlight an important word there –
“u1^2 + u2^2 + u3^2 + …. is the sum of the squares of the uncertainty.”
And you are not dividing these sums of squares by n, but by n^2.
““u” is *not* a random variable. It does *NOT* have an average.”
u is the standard deviation of a random variable. That is the standard uncertainty of the the random variable representing all possible measurements of that value.
“As I’ve pointed out to multiple times, “u” is a constant.”
You keep laboring under the misapprehension that you pointing something out makes it true.
“Dividing a constant by n does nothing but scale the value to a lower number.”
So why do you keep insisting it gives you the average uncertainty.
“u1^2/n^2 is the same thing.”
Presenting an equation that has no use or relevance to the question, and claiming it is the same thing is pretty weird even by your standards.
“It is not calculating anything to do with uncertainty of anything.”
But in the case I’m talking about, we are using the equation specifically designed to calculate the combined standard uncertainty of something.
At this point you are just throwing any random concept you can to avoid the obvious conclusion. You keep insisting that the equation is giving you the average uncertainty – ignoring all my attempts to explain why it is not, failing to engage with the actual figures I gave you showing that the two are not the same. And all this whilst insisting you have no time and are ending the discussion.
I hate to think how far this will digress when you notice the next UAH figure.
“You do not have to divide z by 2, z is the result of dividing something by 2.”
If z = (x+y)
Then dividing (x+y) by 2 *IS* also dividing z by 2!
Just substitute z for (x+y)!!!!
Your lack of basic skills in algebra is just shining out!
It’s the same with Eq 10.
If you divide the right side by n^2 then you divide the left side by n^2 as well. Then the n^2 values cancel!
In essence you are trying to claim that Σ (∂f/∂xᵢ)² u(xᵢ) doesn’t equal u_c(y)^2. That it equals something else entirely.
If A = B and B = C then most people understand that A = C. But not you!
It’s why you couldn’t figure out what Possolo did!
That is known as the Transitive Property of Equality.
Dividing both sides of an equation by the same quantity is the Division Property of Equality.
“If z = (x+y)
Then dividing (x+y) by 2 *IS* also dividing z by 2!”
Completely missing the point. I’m saying that z is already the result of dividing something by 2
z = (x + y) / 2.
The divide by 2 is already there – you do not then have to divide z by 2.
“Just substitute z for (x+y)!!!!”
(x + y)!!!! is going to be huge.
“Your lack of basic skills in algebra is just shining out!”
You know why you keep having to say this, and I don’t? It’s becasue the evidence speaks for itself.
“If you divide the right side by n^2 then you divide the left side by n^2 as well.”
You are not dividing the right side by n^2, because the right side is already divided by n^2. The equation is saying that the left side (the uncertainty squared) is the same as the right side, which just happens to have a divide by n^2 in it.
“In essence you are trying to claim that Σ (∂f/∂xᵢ)² u(xᵢ) doesn’t equal u_c(y)^2. That it equals something else entirely.”
I’m saying the exact opposite, and it’d beyond my reason that someone of your claimed calculus skills can’t understand this.
u_c(y)^2 = Σ (∂f/∂xᵢ)² u(xᵢ),
∂f/∂x = 1/n
You substitute 1/n for ∂f/∂x in the equation. ∂f/∂x is only in the right hand side of the equation, therefore it would be a mistake to also insert it into the left hand side.
“If A = B and B = C then most people understand that A = C. But not you!”
You are so self deluded. Now claiming I don’t understand transitive relations.
“It’s why you couldn’t figure out what Possolo did!”
Quite pathetic trolling.
“Completely missing the point. I’m saying that z is already the result of dividing something by 2″
You would fail basic algebra. But I’m not surprised.
A = B
z = B/2 so –>
z = A/2
Simple substitution.
u_c(y)/2 IS THE AVERAGE UNCERTAINTY.
“u_c(y)/2 IS THE AVERAGE UNCERTAINTY.”
Only if u_c(y) = u1 + u2.
Does it equal that?
Guess again.
The basic first rule in Dr. Taylor’s book is shown in the image.
Guess what it shows!
That’s the provisional rule – the worst case scenario. Read on and you get the actual rule for random independent uncertainties
δq = √(δx^2 + δy^2)
The direct sum is only correct if there is complete correlation between the uncertainties.
Do you think I don’t know that. If that is what you wanted you should not have used, “u_c(y) = u1 + u2” as your example.
And, in any case,
δq = δx + δy,
is the basis underlying more sophisticated analysis.
This simple equation is also useful in certain situations that Dr. Taylor points out. It isn’t like it is shown to be wrong when used appropriately.
“Do you think I don’t know that”
I try to not make too many assumptions about the extent of your knowledge.
“If that is what you wanted you should not have used, “u_c(y) = u1 + u2” as your example.”
Read what I said. I literally said that Tim would be correct about this being the average uncertainty
You may say z = (x + y) / 2 but that is not what
the GUM defines the uncertainty.
As Tim pointed out, an uncertainty is a number, for ASOS that number is 1.8.
As I pointed out, you defining a measurand’s value as an average gives one value for the a single observation of the measurand as you define it. You CANNOT go forward with using the quantity of “n” in further calculation. “n” is subsumed in the original calculation of the value of the measurand.
It is like saying P = (nRT)/V has a value of “n” = 3 when calculating u_c so you end up with u_c/3.
They are random variables. Even one measurement is a random variable with a mean and a measurement uncertainty distribution surrounding it. It may be a Type B uncertainty that NOAA includes in their manuals, but it is still defines a distribution.
You are trying to show things like a measured temperature and an average are two different things mathematically. If you wish to do that, then consider an individual temperature as the mean (average) of a possible distribution.
You seem to be approaching the point of saying that a random variable doesn’t have a mean value. Good luck with that one.
“They are random variables. Even one measurement is a random variable with a mean and a measurement uncertainty distribution surrounding it. It may be a Type B uncertainty that NOAA includes in their manuals, but it is still defines a distribution.”
That’s what I assumed.
“If you wish to do that, then consider an individual temperature as the mean (average) of a possible distribution.”
It is. But my general point is that an average of many values has a distribution with a small variance than the individual temperatures.
“You seem to be approaching the point of saying that a random variable doesn’t have a mean value.”
No. Any distribution has a mean value. But I suspect you are confusing this with the concept of the mean of different values.
With the implication that because mankind caused it, then we can change it back! Yeah, right. I do not believe we can measure the global temps to that accuracy, or change anything about climate or weather, no way. Just have to ride along and go with it.
Isn’t it difficult to call this NOAA chart as a “misrepresentation?” NOAA researchers are highly educated experts in weather and climate and, it seems, quite capable of providing factually correct information to the people of the US who pay their salaries. Why do they not? Perhaps it is because they are not allowed to and instead are directed by their politically appointed overseers to tell lies so the Administration looks good, or at least good in the Administration’s eyes. Perhaps we need a law or better a Constitutional amendment that prohibits lying by Government employees.
Here is an event that is blamed on climate change. Could have been tsunami.
Another allegedly “scientific” body devolves into pseudo-science.
Perfect example of why when statements (regarding anything remotely relating to ‘climate,’ but not necessarily limited to that these days) like “scientists say” or references to supposed “experts” or “authorities” are made, my immediate reaction is to dismiss what follows.
What if NOAA presented the scores in football games?
Ignore just 3 plays and Alabama beat the Buckeyes in the 2015 playoffs.
Warmest year in N.A. Living in the Pacific Northwest for 20 years. Must say we had the loveliest summer ever. More, many more, please.
I focussed on the Libya event..
from the wiki:“”As recently as 2022, a researcher at the Omar Al-Mukhtar University in Bayda, Libya had warned in a paper that the dams needed urgent attention, pointing out that there was “a high potential for flood risk”. The paper also called officials to urgently carry out maintenance on the dams, prophetically stating that “(in) a huge flood, the results will be catastrophic”.
The Wadi Derna had been known to be prone to flooding, having experienced four major floods in 1942, 1959, 1968 and 1986.
As attached is the bit that breaks your heart – those hapless souls were forced to stay at home.
It was entirely Man-Made – even before Daniel was initiated by ‘migrants’ setting fire to the Dadia Forest of NE Greece
Lies, lies and damn lies. Unfortunately you can’t trust data manipulation and cherry picking.
Their infographic is incredibly stupid and misleading. “Africa had its warmest Dec…” Yes, Africa, all 11.7 million sq. miles.
Yes, Africa, all 11.7 million sq. miles.
With very few thermometers anywhere.
NOAA maps of the region are often all grey for no- data…
… but after the colouring-in session, bright red. !
Like most government departments NOAA has lost its way. It needs to be eliminated or drastically reduced. By reduced I mean from the top down.