By Andy May
Yesterday, Roger Pielke Jr. posted a plot of the 3-year frequency of global major hurricanes (he uses a simple count of them) created by Ryan Maue (@RyanMaue). Dr. Maue also posted this plot on his twitter feed here. I noticed it looked like an inverse sunspot plot and overlaid the SILSO monthly sunspot count. In the figure, the blue is Maue’s plot, and the orange is a plot of monthly SILSO sunspots. The correlation, or strictly speaking, the anti-correlation is obvious and very interesting. I don’t think Ryan Maue’s plot has been formally published yet.
It appears that some extreme weather is influenced by changes in solar activity.

OK, I’ll speculate.
Sunlight penetrates deeply (up to 1,000 meters) into the ocean before it is absorbed. Greenhouse gas radiation cannot penetrate the ocean surface. The residence time of sunlight energy is longer as a result. This magnifies solar changes since Watt-for-Watt changes in sunlight matter more than changes in greenhouse gases.
Storms are a function of temperature differences, when an imbalance (increase in energy storage) happens in the tropics at the top of the solar cycle, the temperature difference between the tropics and the mid-latitudes increases. This causes storminess and hurricanes to increase, the increase doesn’t stop until the next solar minimum. Solar peaks appear to initiate an increase in storminess. Just a guess, take it for what it’s worth.
Interesting correlation, but I doubt causation. The reason is simple.
There is almost no variation in satellite observed TOA insolation over the 11 year solar sunspot cycle. So there can be almost no impact on tropical summer surface water temperatures, which is what enables hurricane formation.
A google search found this decade old paper: https://www.hindawi.com/journals/isrn/2012/517962/
Summary of that paper….. “There seems to be a correlation between sunspots and hurricane counts and ENSO and we’ve shown it in these hexagonal tessellation maps of sunspot counts on various parts of the Atlantic. Conclusion: The maps are pretty. “
There is potential for Maue to take their data and extend his graph back another century, although pre-satellite hurricane counts are suspect. He’s probably done it and wasn’t happy with the curve fit.
I would think that if there are clear correlations on earth, there might be some on the weather of other planets re sunspot counts/cycles
Is anyone aware of such published research?
If I remember correctly changes in the Neptunian atmosphere have been observed. The problem is that the only planets that could show changes are the outer gas giants, and these have long orbital periods and short rotational periods. Uranus has a 98 degree axial tilt. Now that the JWT is in position and has observed these planets then maybe any such correlation may be identified. I believe that ocean temperatures and currents lag solar cycles by 2-3 years, but I’m open to correction.
Northern Hemisphere data on tropical storms and hurricanes from NOAA for all basins involved starts in 1972, but for the Southern Hemisphere it starts in 1980, so if you want global data you cannot extend backward. The North Atlantic has data since the 19th century, but the counts are much lower.
The title is “The Spatial Pattern of the Sun-Hurricane Connection across the North Atlantic”
Also interesting that peak storm activity is roughly 2 years after the peak sunspot activity as it’s building up to it’s peak – I don’t believe in coincidences but I agree that it isn’t sunspot activity on it’s own, or not a direct result of sunspot activity anyway.
But it could be a result of something else that is connected to sunspot activity.
Certainly is an interesting anti-correlation, though !
Certainly not related to atmospheric CO2 😉
We have to separate trains running along parallel tracks, space weather and earth weather research.
Generally one doesn’t want to hear about the other and vice versa, even if there is some who look into the interconnectivity of both, it’s not nearly enough of a funded effort.
In fact, the poverty of research relatively speaking has the topic going to food banks
There seems to a poor correlation of amplitudes, so just a strong correlation of timing of minima and maxima. Definitely not a direct causation.
The sun’s poles flip on a, roughly 11 every 11 years, but the orientation doesn’t seem to matter.
My guess would be seeding of rain by ions created from high energy radiation in the tropics, except there seems to be more ionization of the ionosphere at the sunspot maxima. Does this reduce ions raining down the troposphere?
Doesn’t that imply that hurricanes cause sunspots?
My favorite statistical example was included in ebook The Arts of Truth. There is a strong trend graphing Miss America BMI over time (it declines). The OLS regression has a high r^2. From which I calculated the year the Miss America pageant would end because all the contestants would be dead from anorexia.
What you are describing are correlations that are (formally) spurious, that is there is no reasonable cause and effect relationship, and assumed to be linear when they are probably cyclical. The unstated assumptions will get you every time!
Ah, yes but chaos theory would likely point out that you’ll probably get a steady decline, then a period of chaos where the bmi (and physical sex, most probably) will fluctuate quite a bit before settling down again, either reversing the trend or resetting to a previous level and declining again. In other words, don’t bet on it mate!
Males do tend to have a larger BMI than females 😉
The future of Miss American contest under wokism..
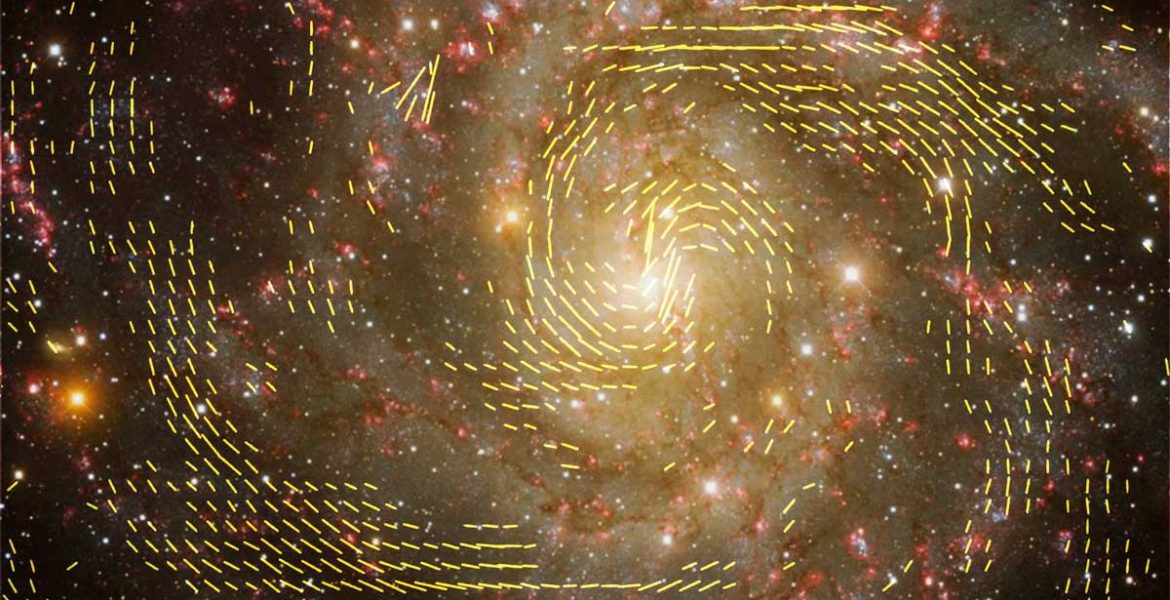
I wouldn’t be so sure Rud. The magnitude of the effects on climate over one solar cycle are very significant. See the attached map (from Javier’s first book) of changes between the 1996 solar minimum and the 2002 solar maximum and latitudinal cross sections for the same period. The change in radiation is small, but not comparable to a change in greenhouse gas radiation that cannot penetrate the ocean surface. Watt-for-Watt solar energy is much more powerful.
The increase in solar irradiance during the 11-yr cycle is about 1.1 W/m2. The expected surface warming (using Stefan-Boltzmann ) for such a change in energy is only 0.025°C and therefore below detection (Wigley & Raper 1990). Temperature data and reanalysis consistently show that the solar signal in global temperature is ~0.1°C, four times larger than expected from the energy change alone (Lean 2017).
We simply must get away from this idea that simple changes in forcing do everything. It is not the simple change in the forcing, it is what the climate system does with it.
Amplifiers do exist, we just don’t know exactly how all of them work. See Joanna Haigh’s work for some of them.
This is a good start:
https://www.imperial.ac.uk/media/imperial-college/grantham-institute/public/publications/briefing-papers/Solar-Influences-on-Climate—Grantham-BP-5.pdf
Doesn’t the sun spot cycle have an impact on the amount of cosmic radiation reaching the earth?
Isn’t there a relationship between more cosmic rays and more cloudiness?
If so, wouldn’t that have an impact on how much short wave radiation reaches the oceans?
Just speculation.
Mark, When the Sun is strong, its magnetic field is strong, and this prevents many galactic cosmic rays (GCRs) from reaching Earth’s atmosphere. The hypothesis is that fewer GCRs mean fewer clouds and warming ensues. This might be one amplifier, but there are many others.
Haigh’s top-down theory is one I like, see reference and link above. When the Sun is strong, higher frequency (UV & visible) radiation increases more than lower frequency (Infrared). This causes more ozone, and a warmer stratosphere, which changes the thermal wind balance. As mentioned, higher frequencies are absorbed much deeper in the oceans, increasing the energy lifetime in our climate system and causing more warming.
Have you got any data about the relative penetration into ocean water for different frequencies?
Just a simple graph would be interesting. 🙂
Blue and green light penetrate the deepest. the lower UV frequencies get pretty deep as well.
iirc, UV carries more energy. It would be interesting to get a closer look at that spectrums penetration into ocean water, and how much the incoming solar spectrum in that range varies throughout a solar cycle.
ps, I looked at this a few years ago, but have lost all the information.
UV is too scattered for such penetration at sea level, no? Asking, not telling
There are some references in this post:
The phytoplankton decline, is there anything to it? – Andy May Petrophysicist
Lots of info on the internet, light penetration in the ocean has been studied for over 100 years.
UV varies more than TSI does over the sun spot cycle.
Thank you! I didn’t realize the light could penetrate that far – I’ve always heard, from innumerable ocean documentaries watched with my sons, that the “midnight zone” started at about 200m. That seems to be at the point orange and yellow disappear.
Right, some light exists in particular areas, up 1,000 meters.
To be fair to the GCR theory there are two hypothesis. Both start with high solar activity is correlated with low GCR activity which is then correlated with lower cloud response. There is a split on what this means. One hypothesis (the original one from Svensmark) is that GCRs are more effective at seeding low level clouds which would cause cooling. The other hypothesis is that GCRs are more effective at seeding high clouds which would cause warming. Either way the evidence in general to support GCR modulation is weak since one hypothesis works pretty well prior to 1960 and breaks down after while the other works pretty well after 1960 but breaks down prior to that. CERN also tested the general hypothesis of cloud seeding cosmic rays and could not demonstrate a significant effect either way. Interestingly they were able to demonstrate a measurable cloud seeding effect from biogenic vapors. It’s possible that the frequency distribution of the incoming radiation could also be modulating the release of those biogenic vapors from the biosphere and in that way the solar cycle is modulating clouds. I’m not saying it’s happening, but it is worth exploring if it hasn’t already. [Riccobono et al. 2014]
solar magnetic field changes and the extent, those changes are also much more dynamic than our own planet’s.
When we get to Galaxy sized magnetic effects, on our star and so ours we’re in unknown territory.
Andy, Tony Heller just referred to your chart in his latest video.
https://sci.esa.int/web/ulysses/-/33618-ulysses-sees-galactic-dust-on-the-rise
“The reason for the weakening of the Sun’s magnetic shield is the increased solar activity, which leads to a highly disordered field configuration. In the mid-1990s, during the last solar minimum, the Sun’s magnetic field resembled a dipole field with well-defined magnetic poles (North positive, South negative), very much like the Earth. Unlike Earth, however, the Sun reverses its magnetic polarity every 11 years. The reversal always occurs during solar maximum. That’s when the magnetic field is highly disordered, allowing more interstellar dust to enter the Solar System. It is interesting to note that in the reversed configuration after the recent solar maximum (North negative, South positive), the interstellar dust is even channelled more efficiently towards the inner Solar System. So we can expect even more interstellar dust from 2005 onwards, once the changes become fully effective.”
As per my two images of the sun’s and galactic magnetic fields
We see more of everything as our sun goes through its cycles, which again points to possible effects on earth that aren’t TSI and Insolation questions.
Folks at Cern did put time into looking at this, but not nearly enough, and were imo browbeat into not putting any more time into researching this, pertaining to effects on earth’s weather and climate
Sun spot numbers relate to the solar cycle, and the solar cycle relate to what comes at us that isn’t solar in origin
Fun note and OT: What happens if enough interstellar dust accumulates on the sun. A micronova. It’s merely a case of how much dust comes in. These have been observed now from non binary stars. All that is needed is matter dumped onto the star. How much matter then becomes the relevant question
“Astronomers discover micronovae, a new kind of stellar explosion”
https://www.eso.org/public/news/eso2207/
With more solar radiation, more oceanic area reaches the surface temperature required to form hurricanes.
Rud, although I remember the “correlation is not causation” meme very well, the (anti) correlation is striking enough to initiate an examination of all aspects of both energy systematics of solar cycles and controls of hurricane variability, which might turn up constructive and destructive interference dynamics. I wonder if there will be follow-up reports examining this issue?
Speaking as a PhD level econometrician, statistically an anticorrelation as here can be treated the ‘same’ as a correlation. Mathematically, all one has to do is reverse the sign of one or the other, flipping it upside down. Of course you cannot then use simple OLS for the ‘goodness of fit’ of two somewhat matching sinusoidals, as here.
You use a transform, a covariance scatterplot technique where 0,0 is perfect correlation (no variance between the two data sets for that time interval). The vertical and horizontal axis are identical plus to minus increments away from 0,0. Then plot everything >0 and >0 or vice versa, and then all >< and <> (few of either for a good ‘fit) for a covariance scattergram where OLS can then be used and an r^2 computed. The more the +/- covariance is ‘tight’ the better the fit.
What accounts for the pretty amazing (to my eyballs) “anti-corrolation” – which is, as you say, a corrolation.
Question, Rud,
Are there variations in the different frequencies in the observed TOA insolation over the 11 year solar sunspot cycle.
I’ll answer this for Rud, the answer is yes. The shorter frequencies, especially in the UV (ultraviolet) increase much more than the lower frequencies, like IR (Infrared). See Haigh, 2011.
Solar-Influences-on-Climate—Grantham-BP-5.pdf (imperial.ac.uk)
The differences in solar spectral irradiance between solar minima and maxima occur at wavelengths below 400nm, there are essentially no differences in visible and longer wavelengths. I used to have SOLSPEC data for quiet, medium and active periods but haven’t dug them out for many years now.
Combined with there being more energy in UV and the penetration of UV into the ocean being quite high. It is certainly an avenue worth exploring.
‘There is almost no variation in satellite observed TOA insolation over the 11 year solar sunspot cycle.’
TOA insolation, no. But what about magnetic field strength?
The magnetic field strength does vary and it makes a difference. Again, see Haigh, 2011.
I get somewhat annoyed when people think the only variable of the Suns energy reaching Earth is TOA insolation, then use that ignorance to say the Sun has no effects.
Yes. This.
To opine that the source of virtually all of the energy entering the Earth’s atmosphere has no effect on the Earth’s temperature, weather, and climate is ludicrous.
so what else do sunspots effect ? focusing on TOA is a dead end as its not changing … cloud formation maybe ? its an unknown unknown at this point …
On the contrary, it’s obvious that the increase in hurricanes prevents formation of sunspots. /sarc
I think ‘if’ there is causation, the answer may be space weather/earth impact related rather than an Insolation/’energy into ocean’ direct input.
Earth responds to solar variation through geomagnetic activity
Do thermospheric winds play a part?
https://agupubs.onlinelibrary.wiley.com/doi/full/10.1029/2022JA031207
Space weather effects on cyclones.
Rapid intensification of tropical cyclones in the context of the solar wind-magnetosphere-ionosphere-atmosphere coupling, yes these are not hurricanes of course.https://www.sciencedirect.com/science/article/abs/pii/S1364682618305765
I am not providing answers here, just thinking aloud. I am not vouching for the validity of the work in these papers, above my pay grade.
I think more is needed to combine space weather with earth weather research, unfortunately there isn’t enough of this type of research going on re earth weather. We have to separate areas of research that where we need a combined effort to look at it.
I am of the undereducated opinion that space weather plays a bigger part than we know.
Rud, there is evidence on the effect of the solar cycle on tropical ocean upper layer heat budget, as published by:
White, W.B., Lean, J., Cayan, D.R. and Dettinger, M.D., 1997. Response of global upper ocean temperature to changing solar irradiance. Journal of Geophysical Research: Oceans, 102(C2), pp.3255-3266.
White, W.B., Dettinger, M.D. and Cayan, D.R., 2003. Sources of global warming of the upper ocean on decadal period scales. Journal of Geophysical Research: Oceans, 108(C8).
At the very least, the temperature of the tropical ocean’s upper layer oscillates in sync with the solar cycle.
The problem is that the change in temperature is too small to explain a significant effect on hurricanes. We all know that bigger changes take place in ocean surface temperature from month to month and year to year. So the mechanism by which the solar cycle syncs with ocean temperature and hurricane formation is very likely to be through its effect on the global atmospheric circulation.
The effect of the Sun on the polar vortex was first reported in 1959, and multiple times since:
Palmer, C.E., 1959. The stratospheric polar vortex in winter. Journal of Geophysical Research, 64(7), pp.749-764.
Labitzke, K., 1987. Sunspots, the QBO, and the stratospheric temperature in the north polar region. Geophysical Research Letters, 14(5), pp.535-537.
It is known to affect the global atmospheric circulation:
Loon, H.V. and Labitzke, K., 1988. Association between the 11-year solar cycle, the QBO, and the atmosphere. Part II: Surface and 700 mb in the Northern Hemisphere in winter. Journal of Climate, 1(9), pp.905-920.
This is the reason why Ryan Maue needs to do a three-year smoothing, to smooth the effect of the QBO.
Veretenenko, S., 2022. Stratospheric Polar Vortex as an Important Link between the Lower Atmosphere Circulation and Solar Activity. Atmosphere, 13(7), p.1132.
In my latest book, I show lots of evidence that the Sun does not act on climate as you think it should, through changes in surface irradiation. It acts through changes in atmospheric circulation altering the amount of heat transported poleward.
When solar activity is low, heat transport increases because the vortex weakens. Hurricanes are an important way for the atmosphere to transport heat, as they contain huge amounts of latent heat, sensible heat, and potential heat. When solar activity decreases, heat transport increases, and one should expect hurricanes to increase. This is what is observed in Ryan Maue’s data.
‘Climate change’ as a political movement is rooted in a one variable pseudo-science with human civilization the assumed cause.
This amazing solar variable correlation does not prove causation, but it does prove that there is more than one variable operating in climate variation. So anyone that is defaulting to the assumption that humans are the problem in ‘climate change’, should also conclude that their position is political and take pause.
What we need is a meta-analysis of all the weather phenomena that demonstrate a statistically significant correlation with the solar cycles. We need to gain insight into how known variables work together and to find pathways to unknown variables and how to measure them in order to increase our understanding of causation.
There isn’t enough time to do all the science needed to fully understand climate as a multi-variate phenomena. We will not avoid the damage ‘climate change’ as a pseudoscience driven political movement will have on human civilization. Yet science remains.
There are other two obvious climate variables the Son and the Earth’s Core, ( with many unknown variables and sub-variables). We could speculate all day long.
Someone needs to read about spurious correlations. The fact that the two cycles are, kind of-ish, if you squint, anti-correlated does not mean there is any causative relationship between them.
Ah, you’ve snipped off the part of the plot where the correlation is non-existent, so you’re aware of the spurious nature of the relationship, you’re just trying to sucker people.
You mean like the climb in atmospheric CO2 while the temperature dropped from1940-1970s.
They didn’t just leave it out, they adjusted to whole darn temperature data.
And GULLIBLE SUCKERS like you still go along with it.
Gullible implies that he doesn’t know he’s lying.
The CO2 increase from 1940 to 1975 was only 7%. The small warming effect was offset by rising SO2 pollution blocking sunlight.
The CO2 rise from 1975 to 2023 was 27%, amplified by falling SO2 emissions after 1980.
You are entitled to your own theories … that I assume will be junk science.
Assume away, because that’s what your claims are based on, assumptions.
Your certainty is founded on assumptions.
I see clouds play no part in your factoring here, even though clouds reflect up to 90% of sunlight, and you’ve no cloud data for 1940 to 1975 for your “small warming effect”. Let not even get into the fact cloud modeling is an ultra low res representation, we cannot model clouds as required, we can only as of today, run experimental studies at a top level, without micro level interactive physics.
Never mind that the “warming” you invoke, comes from a temperature anomaly record that for the 1940 to 1975 period, is missing well in excess of 60% of the planet during that time, and has been adjusted 100s of times post yr2000 to boot.
Also why has warming slowed down in the last 20+ years when the majority of our emissions came after 2000?
So in short, you are missing the biggest feedback mechanism and rely on massively uncertain estimated global anomaly, and then throw it out there with such certainty as to appear as a Greek Satyr.
You mean like Mikey Hockey Stick?
I think people here at WUWT are fully versed in the concept of “ spurious correlations” We are just engaging in the early phase of any scientific investigation- the search for patterns. Then we get down into the weeds to see if causation exists even if it minor and mixed.
AlanJ IQ & Average July High Temp in Atlanta vs time.
spurious or not?
I don’t think you can really look at it like that, it’s more fixed – AnalJ and his shoe size, perhaps?
He must have very small feet!
DonM, does your last name start with an H? You’re snarky enough to be a geologist, a subject I’m an expert in.
I don’t know any H’s. Haven’t worked with any Geologists that I can think of that are H’s. I remember Gunnar; who, given my biases, was sometimes good and sometimes stinky.
AlanJ’s IQ is a pretty constant 2 digit number. !
avg high July temp in Atlanta is 80
The article quite clearly states that all they have is 3 years of correlation and makes a what even the author states to be a guess as to a possible mechanism.
Do your paymasters really require you to be so quick on the denunciation trigger?
No, 42 years is the length of the timescale. I believe the ‘3-year correlation’ just refers to the way Dr Maue processes the storm frequency data.
My bad, I meant to say 3 cycles.
Mr. Layman here.
Sounds like he presented an observation and made a hypothesis.
That’s all.
Time for the scientific method to step in.
(At least he didn’t get CO2 levels and temperatures reversed.)
Thank you, yes, I thought the observation was very interesting. Food for thought.
Definitely no harm in throwing out a hypothesis for consideration. Thanks for posting the article, sorry that some people feel compelled to shut down the debate, but they must get that from dealing with the green climate fascists all the time.
You mean like between increased CO2 and temperature ??
That is a case of spurious short-term correlation… but is the basis of the whole AGW farce.
This would apply to CO2 and warming, but worse, as warming has been adjusted (no intent implied) to match CO2 growth to a concerning degree
Yes, but even with the so-called “adjustments” (all evil and self-serving intents implied) the temperature wiggles around too much to be really tied to CO2 emissions. But science these days isn’t about finding the truth – do articles these days explore the anti-hypothesis anymore, playing devils advocate to poke holes in your own claims and research? Even in highschool I had to do that – but these days articles seem to be press releases, and one only has to wait a few years and a lock-solid headline grabbing piece of research will be totally shot down and be revealed to be a work of fiction.
There’s a huge crisis in research.
The science is settled – like the stinky sludge at the bottom of the tanks at the wastewater treatment plants.
Its also true, as far as I know, that the soil CO2 emissions by IPCC WGs are static rather than temperature dependent, as obviously, to us, not IPCC WGs, that the warmer it gets the more CO2 soil emits, and this source is far greater than human emissions
It doesn’t rule out a causative relationship, and a causative relationship requires correlation (positive or negative). These are the types of things that have to be researched, not dismissed out of hand.
It looks too regular over too many years for just a statistical artifact.
a 4 or 5 year lag seems a long time for something that is seasonal itself.
The sunspots are a symptom of the thing that’s affecting the hurricanes, but what is the thing?
The obvious move is to seek longer record periods.
That’s always a sound approach. Get more data!
“More science!”
Said Michael Mann, never.
Hey, Mickey found that if he turned the data upside-down he could get a whole new set of data.
The problem is that pre satellite hurricane counts cannot be directly compared to post satellite counts. I suspect Dr Maui has done his best. Same problem as EF1-2 tornado counts pre and post doppler radar.
This study is based on “major” hurricane’s (type 3 and above). The principle failing of pre-satellite measurements is the count of minor hurricanes (low wind speed and short duration).
I do not understand the need to dismiss the Sun as the most likely culprit and starting place for investigating many of these questions. The polar vortex story yesterday is another obvious example.
I immediately see a pattern that could be linked to solar cycles. Cycle changes are polarity shifts, yes? So an approximately 11 year span of polar vortexes that abruptly stops near the cycle change boundary sounds like it could be influenced by the polarity of each current cycle. Now that we have crossed another cycle boundary, the pattern has returned.
That giant ball of fire in the sky should be the initial suspect far more often than it is. IMO
Interesting graph. Some thoughts.
Pro – the apparent cycle lengths are close.
Con – too little time to see if there is any slippage between them.
Pro – correlation in time.
Con – what about major + minor hurricanes.
It would be nice if hurricans could be connected to something other than CO2 caused warming!
“It would be nice if hurricans could be connected to something other than CO2 caused warming!”
There is NO connection between hurricanes and mythical, unmeasured, unobserved CO2 caused warming.
Jim just means hurricanes really and truly connected to something else besides the falsely connected CO2 – even the IPCC says there’s no correlation between CO2 and hurricanes but the lie has taken on a life of its own.
Hurricanes connected to CO2? How can they be? CO2 emits infrared radiation when excited. Infrared radiation cannot penetrate more than a molecule or so deep on the surface of the water. The heat it deposits can increase evaporation a bit at the surface but cannot heat the water below. The heating of the water mass is caused by visible light from the sun and perhaps to some extent by volcanic activity below. That is the heat leading to hurricanes, not the tiny bit from CO2.
I guess I forgot to subscribe to this thread. However, what I meant was that it would be nice to have concrete evidence of a major factor, other than CO2, in the development of hurricanes. That evidence could be used to stifle the claim that CO2 causes warming and therefore causes worse hurricanes. I know the evidence that CO2 can’t warm the oceans is already factual, but every piece of evidence helps persuade folks of the insane belief of what CO2 can do.
Gosh, who’d a thunked it. It’s the big, warm orange thing in the sky wot does it
My first though is whynare we looking at a three year moving average of one variable and not the other?
My second question is why are we looking at major hurricanes instead of all hurricanes or at least all landfalling hurricanes. Better yet would be accumulated cyclone energy.
My third thought is that the solar cycle is too weak to affect the global average temperature so is unlikely to affect hurricanes
My fourth thought is the record 11 years between major (cat 3 or higher) US landfalling hurricanes from 2005 (Wilma) to 2017
In 2017 Harvey and Irma struck the continental United States as Category 4 hurricanes in the span of two weeks; this marks the first time the country has suffered two landfalls of such intensity during the same hurricane season.
My fifth thought was to write this and move on to the next article.
Solar cycle is not weak looking at UV radiation or CR certainely affecting clouds and in so far SST.
No observed sunspot effect on the global average temperature
That = weak.
I call BS on this one. I doubt you even thought at all.
A brilliant post. Have it framed and send a copy to yo’ mama
“solar cycle is too weak to affect the global average temperature”
…another anti-science fantasy.
Very much an AGW cultist’s meme.
The Don Rickes of WUWT throws down yet another childish insult.
My first thought…you didn’t actually read the article because it is a running SUM not average. Basically adding deltas.
My second thought…you don’t understand the differences in datasets over the years since there hurricane counts varied greatly in that period due to increasing counts of weak and borderline hurricanes.
My third thought is that you like making generalized assertions
My fourth thought is what does landfall have to do with hurricane intensity?
My fifth thought is not to bother paying attention to your thinking anymore.
Yes, have to avoid counting recent week hurricanes because they wouldn’t have been counted in the past, and because of that cyclonic energy is also unsuitable, for now – after a century from now with comparable consistent data then all the variables can be looked at, for the years they are available.
Landfalling US hurricane counts go back to the 1800s. Strong landfalling counts eliminate most of the rising effect of satellite detection.
Landfalling US hurricanes and strong landfalling US hurricanes have had a declining trend since the 1800s. Where is the influence of sunspots?
The global ACE index could be used after 2000 to avoid the problem of undercounting tropical storm energy before 2000.
No logical theory has been presented to be tested with data. The theory comes first. Then data are searched for to confirm the theory.
Here we start with spurious data and then wild guess a theory
A three month sum is likely to be more volatile than a three months moving average so is even worse.
You criticize my comment but obviously spent time reading it and even more time typing an insult reply.
With five wrong thoughts.
“Landfalling US hurricanes and strong landfalling US hurricanes have had a declining trend since the 1800s. Where is the influence of sunspots?”
Better question: where is the influence of CO2/global warming/”climate change”?
Since they keep telling us “global warming” aka “climate change” is going to make “bad weather” both more frequent and more severe, I guess we can toss the whole “climate crisis” bullshit story into the scientific circular file now, right?!
Reading about the depth of your thoughts explains a lot about the views you espouse.
Yet another childish insult post from the CO2 Does Nothing Nutter pretending to be a climate scientist.
You are a poor little boy trying to piss as far as an adult, without succes, it only drops on your feets… 😀
He quit attending a blog I administrate because he was unhappy that I removed a post for his over-the-top promotion of his website in it while he doesn’t try to fix his link to website that is tied to his name even when I finally told him where the problem was.
He doesn’t know how to speak more gently and need to be more direct to discussing the topic at hand because he is Mr. Assumption.
El Nino correlates with more Pacific cyclones? Just use AI to check for any and all correlations….shark attacks and ice cream sales at the beach is a good one.
And what about Sharknadoes?
More shark attacks. Fewer people go in the water and stay on the hot beach. They buy more ice cream to cool off! 😎
I have no clue if the anti-correlation is spurious, or not.
However, the match is FAR better than a plot of atmospheric CO2 versus Major Hurricane Frequency!
Too right!
We’re trying just too hard here:
a/ Where did the figure of 94knots (108mph) come from?
… the classic definition of ‘hurricane’ (as I search it) is a maximum sustained surface windspeed of 33m/s = 73mph
What is the requirement here for >94knots
b/ Why do we need ‘3 year running totals‘
Esp for one variable and not the other
c/ Why are we told about sunlight penetrating deeply (implying ‘Energy’) then straight away get onto the subject of Temperature.
It totally begs the question, Why not count the accumulated cyclone energy and compare that to spoptspotspots?
The real issue there is = ‘Mud in the water’ – from the outfalls of 3 big rivers (2 in Senegal and 1 in Gambia) draining what has to be constantly dirty muddy water off the desert into the spawning grounds of the hurricanes. Solar energy is barely gonna make 10 metres deep let alone 1,000.
Even before the good people of Nigeria launch countless ‘Flying Latrines and other stink into the water – to fertilise and create an absolute forest of Sargassum Seaweed to soak up ever more of El Sol’s effort – an aquatic forest/jungle that reaches across The Entire Atlantic.
We are told that increased temperature differential causes increased storminess
Kindergarten Science Alert: Because and rather bizarrely, ‘proper’ Atlantic hurricanes need really rather settled weather where they are spawned over Cape Verde Islands
Yes they need a steep vertical differential (lapse rate) but if there’s any significant horizontal convection (as per between different latitudes), the resultant wind-shear yanks the feet out from under them and what was a large thunderstorm remains just that – a thunderstorm.
It may kick off just after lunch but by 3 in the afternoon it fizzles out and dies.
Here’s a thought: Maybe spotspots affect the distance that the people of Nigeria can launch their ‘flying latrines’ or it alters their aim somewhat……
(I’m flattered but it’s OK, I’ve got more than enough Nobels already, let someone else have a chance)
“The real issue there is = ‘Mud in the water’ – from the outfalls of 3 big rivers (2 in Senegal and 1 in Gambia) draining what has to be constantly dirty muddy water off the desert into the spawning grounds of the hurricanes. Solar energy is barely gonna make 10 metres deep let alone 1,000.”
Hmm. While it might not make it to 1000 meters, it will deposit all of its energy in the water. Muddy water within a few meters of the surface might thus get hotter than if the water were not muddy and thus contribute more energy to a hurricane than if it were clear. Is there a correlation between monsoons or rainy seasons and hurricanes?
With “Mud in the Water” I remember that:
No, sorry. It’s the original or nothing for me. No copies or covers really compare to the original Deep Purple track.
All good comments. I suspect that Dr. Ryan Maue will read these comments and try to address them whenever he decides to formally publish his outstanding work. I don’t agree with him on many things, but he is a stand-up guy. He is swayed by the data, which is what we want. There aren’t very many true scientists left.
Remember, so far all we have is an observation and some speculation. These are early days.
Interesting.
Interesting. I doubt that the ocean is the place to look, though, because AFAIK the solar cycle doesn’t show up in ocean temperature. I suspect that the atmosphere is the place to look, and as others have suggested, it may be to do with cosmic rays and possibly regional clouds. It doesn’t appear to relate to ozone. https://ozonewatch.gsfc.nasa.gov/statistics/annual_data.html
Mike,
The solar cycle most definitely shows up in ocean temperature. It just doesn’t show up in global average surface ocean temperature. See this figure from Javier’s first book. This is 1996 (base of solar cycle) to 2002 (top of solar cycle).
Thanks.
It’s the eleven year signature in both signals that’s the give away. If that is ‘coincidence’ then the fact that I am about as tall as my brother is also ‘coincidence’. Since it is highly unlikely that the frequency of hurricanes causes the solar cycle, I am inclined to assume a causal connection, of the solar cycle somehow influencing the frequency of hurricanes as a working hypothesis.
It is temperature difference that drives advection and supercharges convective instability beyond the equatorial zone to spin up convective storms.
There is a definite cycle around 11 year period in the temperature of tropical waters. I suspect this temperature cycle is related to the difference in solar forcing and its annual timing due to both orbit changes and sunspot activity. Those are likely linked through the orbit of the larger planets.
Attached shows your graph aligned with the temperature anomaly for equatorial waters 5 degrees either side of the equator. The temperature is weakly correlated with sunspots and has a phase difference.
I suspect you would get quite good correlations by splitting the cyclone activity across the there tropical ocean basins and comparing with the equatorial temperature in each basin.
Right now, the equatorial western Pacific is anomalously warm with an expansive warm pool to the northeast of Australia. North eastern Australia has already had its second convective storm for this summer. As one resident in FNQ commented, they are stormed out.
So sun spot cycle versus hurricanes seems to show a nice (anti) correlation…Sun spots versus TSI shows a correlation, Sun spots versus cosmic rays show a correlation, Sun spots versus Sea Surface temp shows complete randomness. When we gonna accept random cloud cover and random weather fronts as the cause ?
Sunspots correlate with equatorial temperature. Looking at the whole ocean surface is just stupid with regard tropical convective storms. They require convective potential to spin up and that requires a surface temperature above 26C and will not have enough energy to sustain unless the surface temperature is above 28C.
You have shown curve overlays without any analysis of fit.
I was musing that peak sun spot count is at the time the Sun’s magnetic field changes polarity.
That would mean the field strength would be greatest at sun spot minima correlating with hurricane numbers.
Or am I off at a tangent?
If the correlation holds then Joe Bastardi’s projection for the next Atlantic Hurricane season to be “the season from hell” will be a bust.
Where the oceans are involved time lags must be considered, and the effect must lag the cause. It’s the synchronization that counts. Also, IIRC the UV content of sunlight varies ~10 percent over a solar cycle, this may be important as well. Anyway, the chart is an impressive demonstration of an extraterrestrial effect on climate. Which the ignoramuses will continue to ignore.
“Quadrature” is what to expect from a phase lagged process.
Interesting discussion, the more so in Aug 2023, we learned that clouds on Neptune, have more or less, disappeared – apparently because we are approaching the next sun’s cycle maximum. Really?
If the sun’s 11 year cycle can so affect the climate and clouds of Neptune, how come it cannot (supposedly) also affect much of the climate of the Earth? Odd that.
Link: https://www.cnnphilippines.com/world/2023/8/23/neptune-disappearing-clouds.html
*** (ref below) ” High-energy galactic cosmic rays can penetrate to deep levels within Neptune’s atmosphere to form a substantial ionospheric layer in the lower stratosphere and upper troposphere of the planet. Because cosmic ray (CR) modulation in the interplanetary medium creates an inverse relationship between cosmic-ray intensity and solar activity, the ionization rate in the lower atmosphere will vary with the 11-year solar cycle in such a way that maximum ionization will occur at sunspot minimum and minimum ionization at sunspot maximum. This variable ionization may, by the process of ion-induced nucleation, regulate the formation and optical properties of an upper tropospheric haze in the atmosphere of Neptune and could thus provide a mechanism for modulating the planet’s visual brightness over a solar cycle.”
https://agupubs.onlinelibrary.wiley.com/doi/abs/10.1029/GL016i012p01489
The clouds may be formed by a UV photochemical reaction, cosmic ray initiated reactions or both. As the sun gets more active as it builds up to its maximum, it begins to emit more powerful and intense ultraviolet (UV) light. It has been found that around two years after this UV emission begins, Neptune’s clouds begin to appear, indicating that this UV is perhaps responsible for cloud formation. The cloud-forming aerosols (CR) may be formed further down in the atmosphere and slowly transported to higher altitudes where, where, during solar maximum, UV is the catalyst for methane cloud condensation.
cheers
Using the oceans as a calorimeter to quantify the solar radiative forcing, Journal of Geophysical Research: Space Physics, Volume 113, Issue A11, Solar and Heliospheric Physics, Nir J. Shaviv, 04 November 2008
https://agupubs.onlinelibrary.wiley.com/doi/full/10.1029/2007JA012989
Abstract
Over the 11-year solar cycle, small changes in the total solar irradiance (TSI) give rise to small variations in the global energy budget. It was suggested, however, that different mechanisms could amplify solar activity variations to give large climatic effects, a possibility which is still a subject of debate. With this in mind, we use the oceans as a calorimeter to measure the radiative forcing variations associated with the solar cycle. This is achieved through the study of three independent records, the net heat flux into the oceans over 5 decades, the sea-level change rate based on tide gauge records over the 20th century, and the sea-surface temperature variations.
“… there are three alternative explanations to the large flux. As we shall see, only the first is in fact viable:”
1. “… the well detected and documented heat content variations is that the large amount of heat periodically entering the oceans simply reflect real variations in the energy budget, a flux which is not part of any internal feedback mechanism, whether oceanic or atmospheric.”
2. “… the flux is not “external” but a result of internal feedbacks in the climate system.”
3. “… the apparently large amounts of energy entering the oceans are actually fictitious. This could arise if the small TSI variations excite a decadal oscillation mode.”
“This work clearly demonstrates that there are large variations in the oceanic heat content together with the 11-year solar cycle. Three independent data sets consistently show that the oceans absorb and emit an order of magnitude more heat than could be expected from just the variations in the total solar irradiance.”
“It should be stressed that the observed correlation between the oceanic heat flux and solar activity does not provide proof for any particular amplification mechanism. It does however provide very strong support for the notion that an amplification mechanism exists.”
,,, for what its worth ..
Slotman,
That’s a very well thought out article. Almost has me convinced on Svensmark’s cosmic rays hypothesis, something that I always thought didn’t explain enough energy imbalance….although “cloud cover” is my #1 for SST variation.
DMacKenzie,
As the Svensmark cloud hypothesis goes – higher solar activity generates a more intense solar wind which deflects more cosmic rays away from the inner solar system. Fewer cosmic rays means less ionization in the troposphere and fewer clouds which allows more solar energy to enter the oceans which heats the sea surface. We can see the time lag in the graphs where the excess heat begins to flow back into the atmosphere generating the temperature differential required for increased hurricane activity. Sounds plausible to me.
Nir is basically reproducing and updating White et al. 1997 & 2000 works, which are cited in the paper’s bibliography. It is a solid result, not a spurious correlation.
Yes, exactly. All the evidence points to this conclusion. But the mechanism is known, and Nir Savhiv is ignoring it because he defends a different one that has no supporting evidence. The mechanism by which the Sun affects the climate has been laboriously worked out for decades by many researchers, starting with Joanna Haigh. It is known as the top-down mechanism.
Hi Andy
Dr Judith Curry stated quite clearly a few years ago that they did not know what caused hurricane intensification. Therefore, if the cause of intensification is not known, then the reason for initial formation is not known. That gave me something to do, so I went searching, and found some very interesting atmospheric relationships.
The sun provides heat into the ocean in varying amounts over the cycle, and depending on cloud cover etc, in irregular location intensity. That’s the end of the relationship between the two.
First, Cyclones / hurricanes are NOT storms, they are a separate event entirely.
Cyclones / hurricanes form and intensify because
Its as simple as that. Have a wonderful day. Off to South Africa in the morning for a month or so with my gal.
Life’s great.
Regards
Martin
Ozonebust,
You make no sense. First you say: “they did not know what caused hurricane intensification” then you say “Cyclones / hurricanes form and intensify because.” Which is true?
You write: “First, Cyclones / hurricanes are NOT storms” when of course they are storms.
It is all gobbledygook. Figure out what you want to say and try again. I can make nothing coherent out of this.
Fist a paraphrase of Judith Curry, so Martin realise he has s.th. to do and looks for correlations and write about, no contradiction for me.
Really Krishna, that’s all you have to say.
Sorry for the try to assist.
With all due respect Andy, try reading it again.
They, others, stated by Dr Judith do not know why hurricanes intensify. She also stated that knowledge on the subject has not progressed in the past 25 years (Dr Judith stated 20 years, 6 years ago.
I am telling you what I found and the reason why they form and intensify. What you wrote at the top post is gobbledygook
They are not storms in the classical sense. They form out of necessity. You call them storms because that’s what you call them.
Get down off your high horse and open your mind for goodness sake. Look at what I wrote.
In 2016 on this site, Dr Maue predicted strong likely hood of hurricane formation, I looked at my data and commented very low likelihood. No Hurricanes developed.
Have a wonderful day
Regards
Martin
OK, I took another look, it has been a busy week for me.
First hurricanes and cyclones are storms (Merriam-Webster, NASA, and Oxford)
As for your enumerated points.
History has a tendency to repeat here…
Andy, you’ve come to the same conclusions with the data I used back in 2019, posted here before.
The mechanism you described is the operative one my sun-climate work since 2014 is built upon, the variable absorbed solar radiation at depth that upwells, affecting SST, the weather and the climate.
For instance 2023 ACE was higher than average along with ENSO after 2022/23 high solar activity, per solar threshold theory, something I covered in my 2023 Symposium poster along w/marine heat waves.
My graphic below shows the relationships you described, which I made in September 2019, and was featured at the 2020 Sun-Climate Symposium in Tucson on one of my posters.
Interesting. I’d like to see ACE with 3-year cum. Or possibly plotted for each direction of the QBO (quasi-biennial oscillation). Separate them in west and east like Labitzke did.
https://agupubs.onlinelibrary.wiley.com/doi/10.1029/GL014i005p00535
Could be based on two factors. The oceans have been warming and the +AMO showed up in the mid 90s. This may have finally pushed the ocean heat high enough to where a 2nd factor could have an influence.
Rather than high energy radiation, it could be solar IR radiation. This wouldn’t penetrate as deep and could induce more evaporation. This might produce stronger thunderstorms which then lead to more hurricanes.
The cosmic ray factor might also come into play.
Of course hurricane activity is AMO related, see my comment.
Three solar cycles. Not years