Jim Steele,

Click-bait media, such as the Washington Post, fear mongered the headlines, “Scientists found the most intense heat wave ever”. Due to incessant media propaganda, alarmists falsely believed only rising CO2 concentrations can cause such extreme warming events, and that heat waves are deadly. Indeed, Antarctica’s March 2022 heat wave extraordinarily raised local temperatures at Dome C above its average on March 2022 by 40°C (72°F). Nonetheless, the heatwave only raised temperatures to (minus) -11.8°C maintaining deadly cold temperatures.
Media’s climate narratives commonly suggest in our era of anthropogenic climate change such an unusual temperature heat wave puts us in uncharted territory and many admitted being baffled. However, a large group of objective climate scientists just published Wille et al (2024) The Extraordinary March 2022 East Antarctica: “Heat” Wave” Parts I & II, revealing all the natural weather dynamics that produced that “heat wave”.
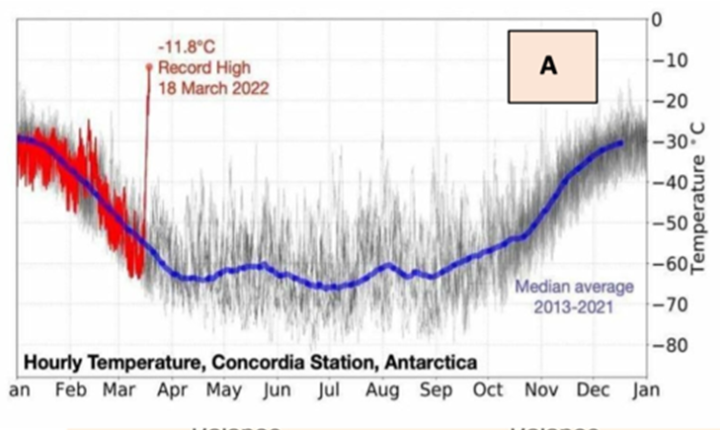
As shown, (illustration A), at Antarctica’s Dome C (Concordia), today’s CO2 concentrations had maintained March temperatures to normally hover around -55°C. But on March 18, 2022, temperatures spiked upwards by 40°C (72°F) in a highly unusual warm event.
Although Antarctica is typically described as a “polar desert”, Wille et al (2024) showed that this Antarctica heatwave was driven by an “atmospheric river” (AR) that transported such abnormally abundant warm moisture it warmed air temperatures. Counter-intuitively it delivered both rain that melted coastal ice yet added enough snow and ice inland that the continent’s overall surface mass balance increased!
Graphic B, from the US National Weather Service’s model, shows for March 17th the moisture content of Antarctica’s atmospheric river that originated northwest of Australia. AR’s are relatively new to science, being first detected in the 1990s. We now know 5 or 6 AR’s are emanating from the world’s rainiest Intertropical Convergence Zone region (light blue) every day.
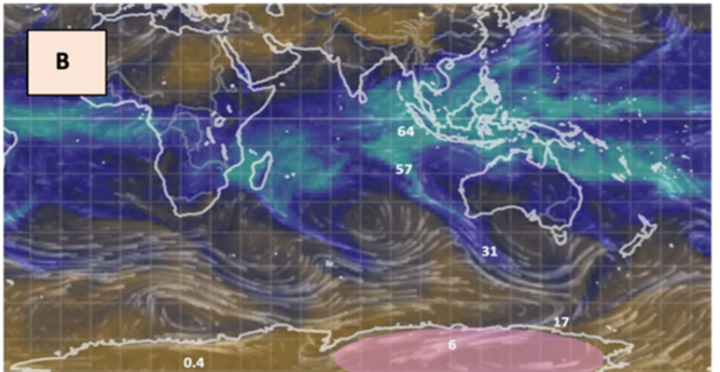
I inserted numbers representing the amounts of moisture, measured in kilograms per meter squared (each kilogram can deliver a millimeter of rainfall). About a fourth of the moisture leaving the equatorial region arrived at Antarctica’s coast. I also inserted a pink oval to outline the extent of the heat wave which received 15 times more moisture than normal for Antarctica’s coast elsewhere.
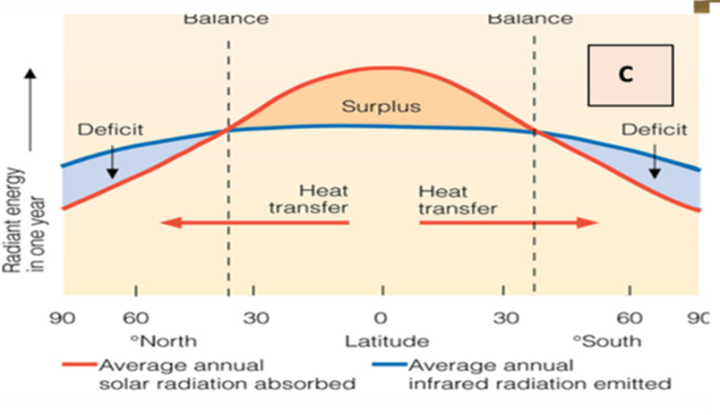
This heat and moisture transfer is a major dynamic that normally contributes to balancing the earth’s climate. As shown in graphic C, the tropics absorb more solar heat than it ever releases. Much of that solar heat is stored and then transported out towards the poles, with heat ventilating along the way, making those regions much warmer than local solar or greenhouse heating can possibly do. Think how the Gulf Stream warms Europe.
The atmospheric river exited the northeastern Indian Ocean, and when reaching the coast of eastern Antarctica brought both warmer temperatures and moisture to the coast. That in turn melted some coastal ice. However further inland, that atmospheric river delivered so much snowfall, Antarctica’s ice sheet overall gained ice.
The atmospheric river increased cloud cover. Those “warm” clouds radiated more longwave heat which warmed the surface below. Most people outside the tropics have experienced a similar dynamic as cloudy winter nights are much warmer than clear sky winter nights. Normally in Antarctica, March’s solar energy declines as the earth approaches the solar equinox, so that exiting (upward) longwave radiation dominates the energy budget driving Antarctica’s seasonal cooling. In contrast, the atmospheric river brought so much moisture that downward longwave radiation dominated, warming the surface, and raising temperatures by as much as 40 C in some places. The atmospheric currents at the time trapped and circulated the resulting clouds which brought large swaths of east Antarctica the so-called heat wave.
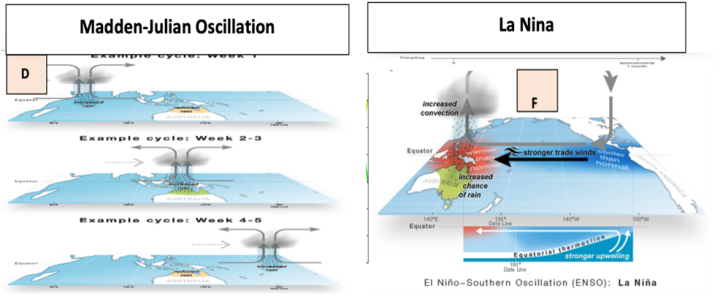
Two natural climate dynamics have been shown to increase the amount of precipitable water vapor that supplies moisture to this region’s atmospheric river transport. One is the 2022 La Nina (graphic F) during which increased trade winds drove more solar heated waters into the western Pacific and Indian Ocean and increased convection. The Madden-Julian Oscillation (graphic D) further increased convection and the amount of water vapor injected into the atmospheric river’s “headwaters” and increased the number of moisture enhancing tropical cyclones.
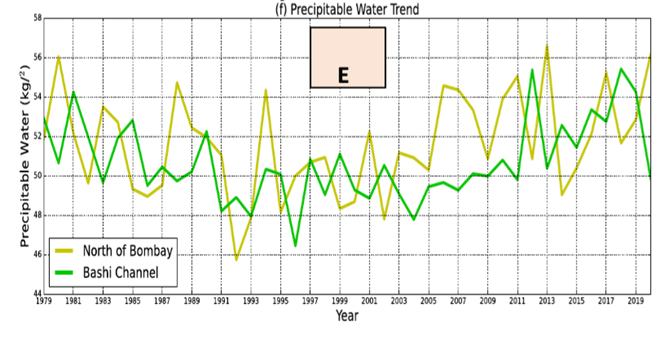
The amount of precipitable water vapor has been blindly suggested by alarmists to be the result of global warming. But studies examining trends in Indian Ocean precipitable water vapor (Graphic E) suggest that La Nina oscillations better accounts for precipitable water vapor trends that correlate with ENSO, but not CO2 concentrations.
All the evidence suggests that 2 natural weather dynamics supplied an atmospheric river with excessive water vapor which warmed east Antarctica and added icy mass to the continent. This event educated blinkered climate scientists and the public, showing them how known natural dynamics can generate extraordinary warming events and why the science is not settled.
At over 3km altitude not surprised that it’s cold, that’s a lapse rate change of 30ºC.
A -11C heat wave.
This is one reason that the current form of anomalies is suspect. If heat keeps moving around the globe then larger anomalies are also going to appear. It is one reason that everywhere is warming faster than the global average. Real global warming should present everywhere.
Just think of the anomaly this is going to interject, yet the temperatures never even got to 0C.
Keep up the good work on “X”. I really enjoy your tweets and the knowledge you obviously have.
Heatwaves over polar regions baffle experts
I wonder why.
The Danish Meteorological Institute (DMI) has pages of information on the daily mean temperature and climate north of the 80th northern parallel.
https://ocean.dmi.dk/arctic/meant80n.uk.php
A week ago, the temperature was about 18 Celsius degrees above the 1958 t0 2002 mean. Click on 2023 {bottom left side} to see a full year. Temperature spikes are the norm. The year 2000 started with a 17 degree spike.
Regarding “atmospheric rivers” – – the name seems to be new while the phenomenon has been known. Perhaps the US West Coast storm from December 1861 and January 1862 is the best known.
See: ArkStorm {etymology: Atmospheric River 1,000}
Yes; atmospheric river, polar vortex, heat dome, firenado, heatflation, cyclone bomb…
These things didn’t exist a few years ago.
Further evidence of climate change!
Don’t forget Pineapple Express.
Known and this expression used LONG before a NEW term, of more general usage, was thought of.
Sort of like naming every storm possible to make weather seem scarier, although at least atmospheric river is a legitimate descriptor.
As much as I agree alarmists have egregiously invented the most fear mongering terminologies, to be fair, the term Pineapple Express simply referred to extreme moisture from the landfall of extratropical cyclones emanating from the direction of Hawaii, and easily observed by meteorologists.
The satellite era allowed and focused dropsonde research allowed scientists to better detect and characterize atmospheric rivers, and algorithms that focused on the 500 to 700 mb altitude elucidating the narrow pathways of concentrated moisture exiting from the high moisture regions of the ITCZ which then travelled thousands of miles eastward, as well as realizing there are 5 to 6 of these happening every day around the world.
I first learned of atmospheric rivers reading Zhu & Newell (1998) A proposed algorithm for moisture fluxes from atmospheric rivers
If you read that paper you will get a strong understanding of the state of the art weather forecasting and models then did not fully account for atmospheric rivers. The more common use of the term atmospheric river today simply reflects a better understanding.
In the article you wrote “However further inland, that atmospheric river delivered so much snowfall, Antarctica’s ice sheet overall gained ice.” – is that from the Wille et al article mentioned or another source?
Back when I used to watch MSM weather programs, the 1960s and again during the early years of the weather channel, mid 1980s the descriptions and explanations of the “Pineapple Express” were of large flows of moisture laden air arriving from Hawaii’s general locale to ram against the Sierra Nevada mountains where those flows of atmospheric moisture lost a great deal of their water content.
I didn’t own or have access to a TV during the 1970s and early 1980s. Nor did I tolerate MSM preaching when we finally installed a TV mid 1980s.
It may well be that the relatively new term “Atmospheric River” is a relatively new thing, but irregular moisture laden atmospheric winds have been recognized well before the 1990s.
If they occurred regularly, they would call it a monsoon.
Atmospheric heat transport = latent flux. This is not controversial. However, the “downward longwave radiation (bold)” is really not smart. The cloud condensation is associated with sensible heat aloft, which inverts thermodynamic temperature gradients. Hotter at height and cooler at surface, so thermodynamic flux becomes quite powerful from sky to surface. Radiation to space continues as usual.
Fascinating commentary and graphs, but, of course, incredibly misleading, as usual. As these graphs shows, ice coverage for Antarctica is at about a record low. Perhaps the poster has found one region where that is not so, in line with WUWT long history of cherry picking data. However, so far for 2024 ice coverage is very, very low.
See here: https://earth.gsfc.nasa.gov/cryo/data/current-state-sea-ice-cover
Low as compared with ??
10,000 years ago, to use your terminology, ice area compared to today was very, very, very, very, very, very, low.
Note: Antarctic ice MASS increased.
To focus on the slight decrease in Antarctic ice area while ignoring the meaningful increase in Antarctic ice MASS is
like someone myopically focusing on a slight decrease in area of a puddle while ignoring the elephant standing in the middle of it.
Elephants are not something to turn your back on. 🌝
Talk about an entrance, Janice!
Well done!
2000 divided by 2,500,000 GIGATONS = 0.08%
What’s the margin of error in measuring an ice cap that’s 1.7 million square Kilometres and 5000 feet deep?
Don’t give this @ssH@t cover.
He is conflating SEA ICE with ice covering land. SO as stated, it rained on the coast, and possibly fell on sea ice and may have had some temporary effect on the sea ice extent or volume, BUT it increased the ice volume ON the continent itself. Ice on the continent was the subject of the post, NOT sea ice extent.
Tonyx knew what he was doing when he posted his BS. For a couple of the readers here to fall for this fraud is disheartening to me, although the posts did call BS on the sea ice non sequitur.
Please, do not let the leftist believers get away with what they always try to do, change the subject.
More alarmist cherry picking projection drivel.
What a loser. 🤣 😂 🤣 😂 🤣 😂 🤣 😂 🤣 😂
“AR’s are relatively new to science, being first detected in the 1990s.”
I would use the word “recognized” instead of “detected”. If I’m recalling correctly, the term “Pineapple Express” used for rain hitting California was prevalent in the 1980’s.Otherwise interesting point how an AR can add mass to the Antarctic icecap despite causing increased melting.
As much as I agree alarmists have egregiously invented the most fear mongering terminologies, to be fair, the term Pineapple Express simply referred to extreme moisture from the landfall of extratropical cyclones emanating from the direction of Hawaii, and easily observed by meteorologists.
The satellite era and focused dropsonde research allowed scientists to better detect and characterize atmospheric rivers, and algorithms that focused on the 500 to 700 mb altitude elucidating the narrow pathways of concentrated moisture exiting from the high moisture regions of the ITCZ which then travelled thousands of miles eastward, as well as realizing there are 5 to 6 of these happening every day around the world.
I first learned of atmospheric rivers reading Zhu & Newell (1998) A proposed algorithm for moisture fluxes from atmospheric rivers
If you read that paper you will get a strong understanding of the state of the art weather forecasting and models then did not fully account for atmospheric rivers. The more common use of the term atmospheric river today simply reflects a better understanding.
“Heatwave” Increased Antarctica’s Ice Sheet!”
The article does not include any ice mass data ro reach the conclusion in the title.
The title refers to ice AREA.
Area makes no sense
The 2023 land mass area of Antarctica was the same as in the 1970s
It was completely covered by ice then and now
The only possible change in the area of the ice would be changes in ice shelves
They may have melted slightly since the 1970s due to underseas volcanoes or shifts in ocean currents
No data are provided
Ice mass is more important because it is directlty related to sea level
No ice mass data are included
No numerical data are included for the ice area or ice mass
The title claims ice has increased in spite of no data
Conclusions not supported by data are the mark of an incompetent author. and thy are never science. Science requires data.
Richard Greene is actually right – there should have been graphs and links to the ice mass, or volume at least.
Ice extent isn’t a proper metric for the amount of ice at the poles – in the past year or so, ice extent in the south was reduced not because it got thinner and melted but high winds blowing into the Antarctic continent resisted the flow of ice, in effect bunching it up so less extent but it was thicker and on the whole, there was more ice than before.
That’s why the ice volume or mass needs to be tracked rather than the extent that’s at the mercy of winds.
I learned to ignore Richard Greene. He has a mindless hard on for me and whenever I say white he will always accuse me of not saying black.
For those who doubted the accuracy of my reporting, I provided the name of the papers I referenced. For anyone who sincerely wanted to view the supporting data, one simply had to read the papers.
From Wille et al (2024) The Extraordinary March 2022 East Antarctica “Heat” Wave. Part II: Impacts on the Antarctic Ice Sheet
“The March transition to winter meant that most of the AR precipitation across East Antarctica fell in the form of snow, resulting in an overall large net-positive surface mass balance (SMB) gain. The extent and intensity of the moisture transport resulted in an extreme precipitation even over portions of the interior East Antarctic polar desert (see Turner et al. 2019). Over the whole ice sheet, total precipitation in March 2022 was 306 Gt in MAR (43-Gt anomaly relative to 1980–2021), 298 Gt in ERA5 (43-Gt anomaly), and 326 Gt in MERRA-2 (54-Gt anomaly) (Figs. 1 and 2). The event accounted for 32% of the March 2022 ice sheet-integrated total precipitation and up to 90% of theMarch 2022 total precipitation in local areas of the East Antarctic Ice Sheet (MAR). MAR, ERA5, and MERRA-2 show similar March total values as well
as totals specific to this event.”
Jim,
If your comments about R G are correct, and I do not doubt what you say, than ONE of his multiple personalities must be specifically activated after reading one of your posts. Apparently that vicious incompetent personality then takes over for the rest and creates the responsive vile comment.
BTW: Although it is not necessary IMO to respond to the R G comments other than as sarcasm or ridicule (especially as to LION Battery Life, much less than he claims in cold weather) thank you for the added elucidation.
Facts are a tough thing for R G to deal with.
Drake
He was just pointing out that ice mass data should have been provided – there’s nothing wrong with that and that would have been the icing on the cake proving the point of Jim’s otherwise very good and interesting article.
I really don’t know why everyone is piling on Richard so much for asking for obviously missing information.
You must be Greene’s alter ego. Greene NEVER asked for the data, He just tried to denigrate the article like he always does
No I’m not RG’s alter ego and I’ve criticised his comments before – I just don’t have the courage like you do to use my real name because I work for the government and I have mouths to feed. But my 1st name is Jim like yours.
RG’s comment: “The article does not include any ice mass data ro reach the conclusion in the title.”
Somebody replied about ice extent, to which he replied, essentially, that extent doesn’t really show how much ice is actually there, and then thankfully you provided some ice mass data.
If you can provide links to trusted sites with up to date ice mass data that would be much appreciated. The resources provided by WUWT menu bar seem to not update on their own.
The information isn’t missing it has been shown many times on this blog and easy for anyone who is a real climate realists.to find it.
Richard Greene is a man with an anvil on his shoulder which is why he is constantly whining about everyone else…….
Give me a break! If it’s not in the article then it’s a glaring omission – if I was proving a point I would provide the evidence to prove it. Jim said that the atmospheric river was melting ice at the extremities and piling up ice in the core – all totally logical and expected by any rational sensible scientist or scientist at heart, knowing that Antarctica is frigidly cold and any moisture would obviously end up in the ice cap – but it would be nice to see the proof, no? He later provided some general proof of increasing ice mass in Antarctica in a comment above, but it still would be great to have proof, evidence, data of the current issue – especially if I want to cite Jim’s article to calm down some climate bedwetter alarmed by the latest
propaganda, I mean news.You were overly harsh towards Richard Greene – I was expecting to see ice mass or volume data too – you had a very good discussion of how the warm wet flow was melting ice at the extremities and how it was piling up snow in the interior but data showing that wasn’t provided until your comment here.
I’m firmly in the camp that there’s nothing to worry about at either pole, and in fact the gentle warming we’ve experienced over the last half century and also since the end of the Little Ice Age is beneficial and I hope continues – and if the polar caps reduce and recede then that added water in the biosphere will be another boon.
But the ice mass data was a glaring omission from your otherwise great article.
LOL It certainly looks like PCman999 is just another of Greene’s alter identities!
You are making yourself sound stupid and childish – just because you left out proof of the increasing ice mass due to the atmospheric river you discussed in the article. You provided other data and graphs to cover your other assertions, and I don’t doubt the logic of what you were saying about the ice mass, but why not show your work?
And why not just provide the info I requested instead of “LOL It certainly looks like PCman999 is just another of Greene’s alter identities!” – how does that help?
Just check with the moderator, they should be able to confirm I not him.
And thank you for providing the proof in the comment above – I didn’t realize til now that it’s from the article you were talking about at the top of the page. Sorry for the bother, I didn’t think it was a big deal to point out that the ice mass graph should have followed the paragraph where you said it grew after the March 2022 event, as not everyone can get to Wille et al.
Thank you – I didn’t which journal Wille’s article was in and it probably would have required an expensive subscription, so many thanks for providing the graphs.
In my other comments I didn’t realize these are from the actual article you were referencing, and so I thought it was from a previous time to March 2022.
I think a lot of us aren’t in academia so don’t have easy access to the journals or even how to look up an article to see what journal it’s in.
Thanks for providing the graphs – no one doubted your veracity – and obviously it’s Wille et al’s article and it’s results aren’t controversial to anyone who is a rational, sensible thinker – I just wanted the pretty pictures!
So, your alleged irate is caused by protecting RG from malicious WUWT?
For this you thread bomb like an adolescent?
Bad bluff on your part.
“Most people outside the tropics have experienced a similar dynamic as cloudy winter nights are much warmer than clear sky winter nights”.
This is especially noticable as you move up in elevation. The thinner air is more sensitive to radiational cooling, or lack thereof, depending on not just cloud cover, but also things like smoke from fires upwind, so it isn’t just in winter when you can see the effects.
Remember that the Tonga eruption in January 2022 put record observed water vapour in the atmosphere.
That water had to go somewhere. It couldn’t just hover over Tonga.
Increasing the carrying capacity of atmospheric rivers would seem to be an obvious result of the (purely natural) eruption.
Tonga’s water went to the stratosphere. Atmospheric rivers are a troposphere phenomenon. It is the unusual warming of the oceans in 2023 (which could be a result of Tonga) that increased water in the troposphere.
That volcano had no observable effect on the global average temperature
It allegedly increased stratosphere water vapor 10%. The stratosphere only had 1% of total atmospheric water vapor to begin with.
“The stratosphere only had 1%”
Insignificant?
Atmospheric CO2 is “only” 0.04%
And atmospheric CO2 is also insignificant compared to water vapour.
So if an extra 10% on top of the 1% that is stratospheric water vapour, and so I get .1% extra water vapour in total.
Is that insignificant? I thought water vapour already saturated it’s IR bands. Though, I guess more water vapour would aid in convective and conductive heat transfer, but again it’s only 0.1% extra.
Why is everyone piling on Richard Greene today, for just basic comments?
-3 just for going along with RG?? Why, does he have the cooties? Was the 10% of 1% thing he mentioned wrong?
Willis, who is always a gentleman and a model scholar, agrees:
https://wattsupwiththat.com/2023/08/07/hunga-tonga-mysteries/
Hunga Tonga was a dud. Read the article, one always learns a lot from reading one of his articles, especially how to think logically and critically.
Convection.
It speeds up or slows down to keep system temperature stable.
All that is needed to eliminate any thermal effect from our emissions or anything else is a miniscule adjustment that would be imperceptible within natural variability.
For this we are destroying our civilisation and handing the world over to barbarians.
A side effect of a polar heat wave is that the planet loses more energy. Due to the low greenhouse effect in the Arctic in winter and Antarctica all year round heat escapes more easily to space there. It is like having your feet outside the blanket on a cold night. They get cold much faster by radiating more.
Also, notice in the last figure that precipitable water had an inflection point in the mid-1990s. This is when heat transport changed its state globally in a climate shift that triggered a lot of coordinated changes in the surface, troposphere and stratosphere, including the start of Arctic warming. Global warming and CO2 increase could not cause the sudden trend shift that took place in a multitude of phenomena.
Your feet or your head. That’s why I wear a hat to bed in the winter.
At 67 I still have plenty of hair, so no need for a hat, yet.
You make a great point Javier. Polar “heatwaves are one example of an insidious climate paradox that always gets misinterpreted as a bogus climate crisis.
The transport of heat to the poles creates temporary instrumental warming via heat ventilation but is mistakenly interpreted as CO2 global warming, when in fact that ventilating heat is cooling the earth and balancing the energy budget.
The same paradox explains how heat ventilating from the Arctic Ocean is incorrectly explained as climate warming when it is actually cooling the earth.
Ditto for El Nino events.
Nice explanation. It’s how a refrigerator works! Moves the heat to someplace it can be radiated away! My guess is that none of them understand what the radiator in an ICE vehicle does, or the transmission cooler. It really makes you wonder just how much real world experience climate scientists have let alone how much actual thermodynamic training they’ve taken.
LOL in 1993 I visited Siberia during a “heat wave” of -14°C, I was wearing thermals but the locals had their coats open.
That was me here in Colorado the other day. Because it’s usually windy here, when the wind stops, everything automatically feels at least twenty degrees warmer.
Great Article Debunking WAPO’s Heatwave article by Kasha Patel
Story Tip
I did some research/Fact Checking on this March 2022 “Heatwave” a while ago too, and the term Heatwave is way overblown, hyperventilating as usual.
I pulled the Data from the AMRDC Depository at the University of Wisconsin at Madison, for Dome C II for March 2022 and the Table attached is the result. There were only 4 Days where the Average Temperature dipped below -30 C. Maybe a more appropriate Title would be “The Heatwave that never Was!”
Read more about this here too: Concordia HEAT Record March 2022 (aaadts.com)
Jim Steele, I have more interesting Data research on Antarctica, I am happy to share – email me at fbuningh@hotmail.com
Or you can watch the Stuart Turley Show next Thursday January 25 at 1 pm EST, I will be on explaining the Misinformation and the Fuzzy/Fraudulent Math about Antarctica by the Climate Change Institute of the University of Maine.
Maine, isn’t that the state where the S of S thinks she can unilaterally block a candidate from the ballot much like they do for Putin opposition candidates in Russia.
I thought so.
Chaos and Weather Prediction
The weather is a chaotic system. Small errors in the initial conditions of a forecast grow rapidly, and affect predictability. Furthermore, predictability is limited by model errors due to the approximate simulation of atmospheric processes of the stateof- the-art numerical models.
These two sources of uncertainties limit the skill of single, deterministic forecasts in an unpredictable way, with days of high/ poor quality forecasts randomly followed by days of high/poor quality forecasts.
https://www.ecmwf.int/en/about
Very nice.
What role does air circulation play in the transfer of heat toward the poles?
http://tropic.ssec.wisc.edu/real-time/mtpw2/product.php?color_type=tpw_nrl_colors&prod=global2×pan=24hrs&anim=html5
We are currently seeing an “atmospheric river” over the UK. There will be an unusually high amount of water with high temperatures.
