From Dr. Roy Spencer’s Weather Blog
2023 Was the Warmest Year In the 45-Year Satellite Record
The Version 6 global average lower tropospheric temperature (LT) anomaly for December, 2023 was +0.83 deg. C departure from the 1991-2020 mean, down from the November, 2023 anomaly of +0.91 deg. C.

The 2023 annual average global LT anomaly was +0.51 deg. C above the 1991-2020 mean, easily making 2023 the warmest of the 45-year satellite record. The next-warmest year was +0.39 deg. C in 2016. The following plot shows all 45 years ranked from the warmest to coolest.

The linear warming trend since January, 1979 still stands at +0.14 C/decade (+0.12 C/decade over the global-averaged oceans, and +0.19 C/decade over global-averaged land).
It might be partly coincidence, but the +0.51 deg. C number for 2023 from satellites is the same as the surface air temperature estimate from the NOAA/NCEP/NCAR Climate Data Assimilation System (CDAS). Note that the CDAS estimate is only partly based upon actual surface air temperature observations… it represents a physically consistent model-based estimate using a wide variety of data sources (surface observations, commercial aircraft, weather balloons, satellites, etc.). [UPDATE: it appears the CDAS anomalies are not relative to the 1991-2020 base period… I recomputed them, and the CDAS anomaly appears to be +0.45 deg. C, not +0.51 deg. C]:

Various regional LT departures from the 30-year (1991-2020) average for the last 24 months are:
| YEAR | MO | GLOBE | NHEM. | SHEM. | TROPIC | USA48 | ARCTIC | AUST |
| 2022 | Jan | +0.03 | +0.07 | +0.00 | -0.23 | -0.12 | +0.68 | +0.10 |
| 2022 | Feb | +0.00 | +0.02 | -0.01 | -0.24 | -0.04 | -0.30 | -0.49 |
| 2022 | Mar | +0.16 | +0.28 | +0.03 | -0.07 | +0.23 | +0.74 | +0.03 |
| 2022 | Apr | +0.27 | +0.35 | +0.18 | -0.04 | -0.25 | +0.45 | +0.61 |
| 2022 | May | +0.18 | +0.25 | +0.10 | +0.02 | +0.60 | +0.23 | +0.20 |
| 2022 | Jun | +0.07 | +0.08 | +0.05 | -0.36 | +0.47 | +0.33 | +0.11 |
| 2022 | Jul | +0.36 | +0.37 | +0.35 | +0.13 | +0.85 | +0.56 | +0.65 |
| 2022 | Aug | +0.28 | +0.32 | +0.25 | -0.03 | +0.60 | +0.51 | +0.00 |
| 2022 | Sep | +0.25 | +0.43 | +0.06 | +0.03 | +0.88 | +0.69 | -0.28 |
| 2022 | Oct | +0.32 | +0.44 | +0.21 | +0.05 | +0.17 | +0.94 | +0.05 |
| 2022 | Nov | +0.17 | +0.21 | +0.13 | -0.16 | -0.50 | +0.52 | -0.56 |
| 2022 | Dec | +0.05 | +0.13 | -0.02 | -0.34 | -0.20 | +0.80 | -0.38 |
| 2023 | Jan | -0.04 | +0.05 | -0.13 | -0.38 | +0.12 | -0.12 | -0.50 |
| 2023 | Feb | +0.09 | +0.17 | +0.00 | -0.10 | +0.68 | -0.24 | -0.11 |
| 2023 | Mar | +0.20 | +0.24 | +0.17 | -0.13 | -1.43 | +0.17 | +0.40 |
| 2023 | Apr | +0.18 | +0.11 | +0.26 | -0.03 | -0.37 | +0.53 | +0.21 |
| 2023 | May | +0.37 | +0.30 | +0.44 | +0.40 | +0.57 | +0.66 | -0.09 |
| 2023 | June | +0.38 | +0.47 | +0.29 | +0.55 | -0.35 | +0.45 | +0.07 |
| 2023 | July | +0.64 | +0.73 | +0.56 | +0.88 | +0.53 | +0.91 | +1.44 |
| 2023 | Aug | +0.70 | +0.88 | +0.51 | +0.86 | +0.94 | +1.54 | +1.25 |
| 2023 | Sep | +0.90 | +0.94 | +0.86 | +0.93 | +0.40 | +1.13 | +1.17 |
| 2023 | Oct | +0.93 | +1.02 | +0.83 | +1.00 | +0.99 | +0.92 | +0.63 |
| 2023 | Nov | +0.91 | +1.01 | +0.82 | +1.03 | +0.65 | +1.16 | +0.42 |
| 2023 | Dec | +0.83 | +0.93 | +0.73 | +1.08 | +1.26 | +0.26 | +0.85 |
The full UAH Global Temperature Report, along with the LT global gridpoint anomaly image for December, 2023, and a more detailed analysis by John Christy, should be available within the next several days here.
The monthly anomalies for various regions for the four deep layers we monitor from satellites will be available in the next several days:
Lower Troposphere:
http://vortex.nsstc.uah.edu/data/msu/v6.0/tlt/uahncdc_lt_6.0.txt
Mid-Troposphere:
http://vortex.nsstc.uah.edu/data/msu/v6.0/tmt/uahncdc_mt_6.0.txt
Tropopause:
http://vortex.nsstc.uah.edu/data/msu/v6.0/ttp/uahncdc_tp_6.0.txt
Lower Stratosphere:
http://vortex.nsstc.uah.edu/data/msu/v6.0/tls/uahncdc_ls_6.0.txt
I about froze in 1979. Good to see we’re still headed in the right direction.
Just confirms we are still thawing out from the Little Ice Age.
Send in the trendologists…
I’m here! I’m here! Don’t start without me.
“Global warming isn’t happening.”
“And if it is, it’s a good thing.” <—– You Are Here
“And if it isn’t, humans didn’t cause it.”
“And if they did, there’s nothing we can do about it.”
“And if there is, we shouldn’t do it because it will hinder economic prosperity.”
It’s “climate change” and it always does, change, just like weather.
In fact it has to change. Climate is weather averaged over a reasonably long period of time, 30 years being typical. Weather is chaotic so all it’s parameters exhibit irregular aperiodic oscillation (within a large, relatively fixed range). Chaotic oscillations exhibit what is called strange statistics, meaning their averages also oscillate aperiodically.
In short climate always changes because of the way weather always changes.
The climate period ought to be something like 200 years- not 30. I’ve already been around for 2.5 of those and I see only trivial improvements in the weather.
There are definite signs of an approximately 1000 year cycle. That is probably a better measure of climate, outside of the cosmic cycles of orbit, inclination, etc.
Joeph, 300 hundred would be better, ten 30-yearlong “weather cycles”. How did anyone come up with climate is weather averaged over 30 years? Ridiculous. If I had a vote, it would be 1,000 years. A blink of an eye in geologic time.
That’s one reason I love the science of geology.
Geologists See Climate Change Differently
So, just to clarify, what is the 1991-2020 mean figure that we’re supposed to be using these days? I can’t seem to find it anywhere in the article. I would have thought it was important enough to repeat, just as a clarification, but it seems to be missing.
I’m assuming you are asking what the absolute temperature is of the 1991-2020 baseline…263.19 K for December.
263.19 K ??? Are you living on a “snowball earth”? That’s almost 10° C BELOW freezing at the warmest time of the year globally. (That’s about 18° C lower than the estimated peak of the Last Glacial Maximum 20,000 years ago. 🙂
Yes. It’s pretty cold. I’m not sure about the comparison with the LGM. I’m not aware of any data regarding the temperature around 700mb in the paleoclimate record.
As StuM pointed out, 263.19K is almost -10 deg C. The baseline is supposed to be the average for the 30-yr interval. Are you suggesting that the global average has been well below freezing for the previous three decades? Why did you get any up-votes?
And he knows this number to FIVE digits?
Oh yeah, sure he does.
Yes. The global average as reported by UAH is below freezing and around -10 C for December.
You could have reminded us that it was for an average altitude of 5Km.
So it’s my fault that people forgot that UAH measures the temperature of the troposphere with an effective height of 700 mb?
There is no single “1991-2020 mean figure” since “global temperature” varies by about 3.8°C over the year. Consequently each month will have a different mean which varies from approximately 12.1°C to 15.9°C (using the 14.43 / + 0.43 figures shown in the sidebar from temperature.global).
(If you accept the validity of the whole concept of a meaningful “global temperature” which can be accuratelymeasured. 🙂 )
That’s why anomalies are computed from 12 different baselines instead of 1. The baselines from UAH range from approximately 263 K to 266 K. I can provide exact values later when I get back home.
So December the same as January DESPITE the El Nino.
So what you’re saying is that the global average for any month is several degrees below zero? This is for 2023? How does 2022 compare? I’m sure NOAA gave the GAT 2022 as being 14.76°C – which would mean a difference of about 20°C between land and atmosphere temperatures?
Someday climate science will wake up, I hope, and recognize that this use of averages is not only unscientific but stupid. Averages alone ignore the ranges, i.e. the variance in the distribution and you end up with answers showing the whole globe is below freezing.
You would think that climate science would look at this and say, “What is occurring here”, but they don’t.
Some points, averaging NH and SH temperatures ignores the fact that they have different seasons. I hear so much about needing to remove seasonality and then, bingo, except for an average of global temperature.
Using averaging to add decimal points to readings whose resolution is far less is a scientific joke. If I tell you I measured the battery voltage to the nearest one-tenth of a volt and the average is 1.534 volts, what is the variance. Heck it could be an interval of 1.0 to 2.0 volts and how would you know?
Not one, and I mean not one, document on measurement uncertainty teaches that a stated value should be quoted to a more precise value than the uncertainty. NOAA shows a maximum error of 1.8F for ASOS stations and a maximum error of 0.3C (0.5F). At the least, temperatures with more decimal places than these values are unsubstantiated fiction!
I haven’t posted these for awhile; on the UAH FTP site are the baseline files they use to calculate their temperature anomalies, one for each month of the year. Each has ~10,000 data points in Kelvin, one for each of the 2.5×2.5 degree spherical grid points.
Here are the points from two different months for the lower troposphere (LT), December and April, converted to °C and formed into histograms. Note the sharp peaks near freezing, which the right-side panes show zoomed in. The peaks are all from tropical oceans (like the Red Sea), while the very cold points are polar.
It is important to keep in mind that there is no single temperature of the lower troposphere—the NOAA satellite microwave detectors respond to signals from altitudes of zero (the surface) up to about 10 km. In this region the air temperature is decreasing with altitude roughly linearly. The microwave detectors have a roughly Gaussian response profile with altitude, with the peak response at about 5 km.
UAH claims an uncertainty of ±0.2°C for this “temperature”.
The uncertainty of 0.2C makes one wonder if a trend of 0.14C has any significance. The interval would be from +0.3 to -0.1C.
Do you know if this is an expanded standard deviation of the mean?
I have no idea how they came up with this number. From Pat F’s comments I doubt it came from an uncertainty propagation.
Yeah, i figured. I couldn’t find anything either. I am not satellite informed and couldn’t really assess all the adjustments needed.
My only doubt is that even CRN stations have a 0.3C error. I’m not convinced satellites can do better.
“I have no idea how they came up with this number.”
Have you asked them?
And have you gotten around to explaining to them your own carefully constructed uncertainty value of several degrees?
Or do you prefer just to whine from the sidelines?
Do you think satellites have a smaller uncertainty than the very best temperature sensors installed in CRN stations.
No. I think satellites have a lot of uncertainty attached to them. That’s why I’ve spent so much time being called a satellite denier, when I argue that they shouldn’t be preferred over over data sets, just becasue they show less warming. You’ve only got to see how much satellite data has varied between versions to get some idea of how many problems they might have.
But that doesn’t mean I would just pluck an improbably large uncertainty value out of the air, claim it means that all satellite data is useless, accuse the creators of fraud, and not do them the courtesy of explaining why you think their work is flawed.
As to CRN, it’s great and I would assume it’s much more accurate than other data. Which that doesn’t mean it’s perfect. But it’s only covering the US at the moment and only goes back a couple of decades. At present it seems to be showing more warming than other data sets, but it’s far too soon to draw any conclusions.
I think it may come from comparing with radiosonde data – I’m pretty sure I read somewhere that UAH consistently agrees with the radiosondes with only a 0.1° or 0.2° margin of error.
What I remember is they compared temperature versus time slopes for the two, not absolute temperatures. Somehow from this they inferred the 0.2°C. Could be wrong, though.
Yes. Though, it’s not me saying it. It’s :Dr. Spencer and Dr. Christy.
No. 1991-2020. That is the period you asked about.
Here are the values for 2022.
Correct.
Right. I had actually worked out that the figures you had provided as the 1991-2020 averages were as you said, the question was more rhetorical, and seeing if you had the 2022 December average that I could compare with the NOAA December 2022 land figure – apples with apples so to speak.
Has anyone done a comparison of the UAH and NOAA averages to see if that 20°C difference is consistent, changes over the annual range or has changed over the years?
Just curious.
Richard Page
” … which would mean a difference of about 20°C between land and atmosphere temperatures? ”
bdgwx’s numbers are valid for the lower troposphere (LT) only, which is UAH’s lowest observed atmospheric layer. Above them, you have
The higher you go, the lower the observed temperature.
Here are the averages of the 12 month means for 1991-2020.
MT: -22.47 °C
TP: -47.71
LS: -61.26
These numbers you obtain by processing the 2.5 degree grid climatology data available below UAH’s 6.0 main directory
https://www.nsstc.uah.edu/data/msu/v6.0
As always thank you Bindidon.
AlanJ , still pretending to himself that this El Nino was caused by human CO2.
How sadly and pathetically anti-science
As usual warmist/alarmists lies about what many state here, no one actually said no warming at all it is period of no warming at all is pointed over and over that shows no sign of CO2 doing anything.in those “pauses” that have been 10 years long twice.
Doesn’t sound as crazy as the oceans are boiling; that we ought to panic; that the polar bears are going extinct; that the polar caps will all melt; that billions of people will become climate migrants; that we should all become vegans.
AlanJ, as long as you and other alarmists insist on describing what climate realists are claiming here’s a little auto-correct:
“Global warming isn’t happening.”
(Catastrophic global warming isn’t happening)
“And if it is, it’s a good thing.” <—– You Are Here]
(And the slight amount of warming is a good thing)
“And if it isn’t, humans didn’t cause it.”
(And Mother Nature causes most of it)
“And if they did, there’s nothing we can do about it.”
(and we know there’s nothing worthwhile we can do about it)
“And if there is, we shouldn’t do it because it will hinder economic prosperity.”
(And if there is, we shouldn’t do it because warming and CO2 is good for economic prosperity)
You, AOC and other like-minded alarmists are here: “Less than wise”.
Please consider the amendments before attempting to explain what someone is stating.
AlanJ
“Global warming isn’t happening.”
(Catastrophic global warming isn’t happening)
“And if it is, it’s a good thing.” <—– You Are Here]
(And the slight amount of warming is a good thing)
“And if it isn’t, humans didn’t cause it.”
(And Mother Nature causes most of it)
“And if they did, there’s nothing we can do about it.”
(and we know there’s nothing worthwhile we can do about it)
“And if there is, we shouldn’t do it because it will hinder economic prosperity.”
(And if there is, we shouldn’t do it because the warming and CO2 is good for economic prosperity)
(You and other like-minded alarmists are here: “Less than wise”
“And if there is, we shouldn’t do it because it will
hinder economic prosperity[be the instrument of global tyrannical government while destroying economic prosperity as an unavoidable side effect].”“Good to see we’re still headed in the right direction.”
Agree. And the title of this post could easily be “Global Temperature Update for December, 2023: -3 deg. C during last 10k year avg.”
Or 2023 Was the Warmest Year In the 45-Year Satellite Record which actually appears as the header in Dr. Spencer’s blog article.
Who cares?
I won’t start taking any notice of the climate porn graphs until they get real and start reporting changes in whole 1-degree trends, not hundredths or tenths of 1 degree C over decades.
Even then, I would only take note of differential comparisons between same rural stations unadjusted hourly max & min records.
And I’ll hit the “X” button at the first mention of “average temperature”.
Sure, a lot of data points to crunch, but don’t extraordinary claims demand extraordinary evidence?
Got to agree Mr. How many decimals point do you need to make your data look interesting. Also for a site that lectures everybody about junk science, what happened to error bars. This data is presented every month as scientific fact with no level of uncertainly. I guess no one would be interested in climate porn if it was statisically insignificant.
The use of error bars would imply there might be errors- so those are unwanted. After all, it’s settled science to any number of decimal places you might desire. Greta said so. /sarc
I recall, when Roy Spencer was talking about the 15/16 El Nino, he said something to effect that the satellite microwave measurements have an uncertainty of +/- 0.2 degrees C so in reality it was impossible to say if the 15/16 high was any different than the 97/98 one.
The UAH figures are presented in the format adopted by the rest of the world to avoid name calling and bomb threats, but need to be recognized as within the proper accuracy range.
That’s a mathematical uncertainty range. Without knowing the instrument and reading error range those figures are fairly meaningless.
Is it the case that- information presented to the public- since most wouldn’t know an error bar if they tripped over it- the publishers simply ignore it- which of course will lead the dummies to think the numbers are precise scientific facts? Maybe that’s one reason idiots like most journalists will write, “the science says” and “it’s settled science- after all, they gave us numbers!”
OK, now make the politicians see reason or you objections are to no avail.
I would imagine Dr. Spencer would care if someone changed the content of his article.
Your petty meaningless comments is not scientific evidence.
You still haven’t been able to produce a single bit of evidence of human causation.
You’re right. It’s not a matter of science. It’s a matter of plagiarism and/or the unethical alteration of someone else’s work.
Gotta use the NON-HUMAN-CAUSED EL NINO.
It is all you have. !
As water from the Tonga eruption leases the stratosphere, global average temperature should continue dropping.
Leaves.
Spencer and Christy already said the Tonga eruption added at most hundredths of a degree to global temperatures. Recent monthly temperature anomalies are a degree of magnitude higher than the previous records. The Tonga eruption isn’t the cause.
TheFinalNail,
Please stop trolling.
You could always answer the point being made. Or maybe you couldn’t, on reflection.
Your point is absolutely meaningless… based on your abject ignorance.
Even as a mindless trollette, you are totally inept.
Why don’t you put forth an alternative explanation for the temperature spike?
And how would Spencer and Christy know that and why do you give them credit for that?
The Tonga eruption is unprecedented in the modern record, and the change in stratospheric water vapor is unprecedented. Therefore nobody really knows what its full effect is going to be. Models predict substantial surface warming from the Tonga eruption for a few years. So much that it could push us above the dreaded +1.5ºC.
Jenkins, S., Smith, C., Allen, M. and Grainger, R., 2023. Tonga eruption increases chance of temporary surface temperature anomaly above 1.5° C. Nature Climate Change, 13(2), pp.127-129.Jenkins, S., Smith, C., Allen, M. and Grainger, R., 2023. Tonga eruption increases chance of temporary surface temperature anomaly above 1.5° C. Nature Climate Change, 13(2), pp.127-129.
And if not for the media, absolutely nobody would notice.
and ain’t that the real situation 🙁
Spencer and Christy are aware of the research.
Jucker et al. 2023
Jenkins et al. 2023
Zhang et al. 2022
Zhu et al. 2022
Sellitto et al. 2022
Your own reference says it will only have a few hundredths of degree effect at most.
Your own reference says it only increases the probability by 7%.
Millan, L., Santee, M.L., Lambert, A., Livesey, N.J., Werner, F., Schwartz, M.J., Pumphrey, H.C., Manney, G.L., Wang, Y., Su, H. and Wu, L., 2022. The Hunga Tonga‐Hunga Ha’apai hydration of the stratosphere. Geophysical Research Letters, 49(13), p.e2022GL099381.
According to models, it is like 6 years of CO2 increase concentrated in one. That is not 1/100th of a degree if we are to believe the models. More like 1/10th
Of course, models could be wrong and it could be a lot more or a lot less. Models are notoriously bad at reproducing the stratosphere.
You really cannot discard the eruption as the cause of the warmest year evah.
I don’t disagree. But your reference does not support that conclusion as they only show a few hundredths of degree effect and that is the peak around 2026/7 while the change in UAH from 2021 to 2023 is +0.37 C.
Your Jenkins reference says HTHH could push the surface above 1.5 C over “preindustrial” baseline.
Yes…because when it is within a few hundredths of degree of 1.5 then it only takes a few hundredths.
So, in your opinion, from -0.04 C anomaly in January 2023 to 0.93 C in October has negligible HTHH component. A few hundredths would be three or four, not nine.
First…it’s not my opinion. It’s from Javier source. Second…it’s hard to tell from the Jenkins et al. 2023 diagram what the exact value is, but it does not look like nine hundredths to me. It looks like half that.
No, the figures are from UAH, showing that Spencer and Christy’s guess from August was promptly shown wrong.
I’m addressing your statements “in your opinion” and “A few hundredths would be three or four, not nine”.
Again…it’s not my opinion. It is the conclusion from Javier’s source. That conclusion does not appear to be nine hundredths. It looks like about half that according to figure 1. It is hard to tell because it is so small.
Yep, current warming is tiny and basically irrelevant. !
Particularly as there is no proven human causation.
Your own references don’t support your point. In fact, they agree with S&Cs’ assessment that the effect is very minor.
I’m fairly certain we had this exact same conversation with Javier a month or two ago.
That would not be a surprise.
What would really be a surprise if it you were able to produce a single bit of scientific evidence that the current warming spike from the major El Nino, has any human causation whatsoever.
Would also be a surprise if you could tell us all just how much warmer it must have been over a long period of time, for peat to have formed where now there is permafrost.
“exact same conversation with Javier a month or two ago.”
Yet you remain belligerently IGNORANT.
Who’s fault is that !!
The Hunga Tonga eruption and its effects are unprecedented. It seems clear it should produce surface warming. We’ve had a very anomalous 2023 with lots of surface warming. I’m following the evidence, as I always do. You are the one who is saying it is not the volcano without the evidence to support that affirmation. The probability that you are wrong is higher.
“We’ve had a very anomalous 2023 with lots of surface warming.”
Yes, we did.
What unusual event happened before this anomalous surface warming? An underwater volcanic eruption that put unprecedented amounts of water vapor into the upper atmosphere is what happened.
Then we get unusual warming afterwards.
Coincidence?
In an relatively recent article in the UK i newspaper James Dyke from Exeter University’s climate department acknowledged that the warmth this year had been affected by both Hunga Tonga and the reduction in sulphur based fuels in world maritime shipping.
OK it’s not a ‘peer reviewed paper’ but considering Dyke is author of the book ‘Fire, Storm and Flood:The violence of climate change’ it is an admission other factors are at work..
I don’t disagree. The question is…how much?
First…I cited 4 other lines of evidence in addition to the one you cited. All 5 (including your preference) all say that the HT effect is small; too small to account for the large spike in the UAH TLT record.
Second…If you don’t think Jenkins et al. 2023 is evidence then why did you post it?
Then post evidence backing up your statement. If you’re so confident about it then it should be easy to post say 5 studies suggesting an effect on the order of several tenths of a degree by 2023 to offset the 5 (including the one you cited) that says otherwise.
So what.. that doesn’t make it correct.
They are great at radiation physic and its use for determining atmospheric temperatures.
But not so good with other things.
No, they don’t. Clearly you didn’t read them.
Where? Be specific. What page number and paragraph or figure from Jenkins et al. 2023 is inconsistent with S&C?
Umm, it’s title and abstract.
There is no mention in the title and/or abstract in Jenkins et al. 2023 in which the HT eruption is going to have any more than a few hundredths of degree impact on the global average temperature as depicted in figure 1.
I did pixel measurements and estimated a 0.03 C effect for 2023 with the SSP2-4.5 pathway.
The authors say the eruption should boost warming over the supposedly dangerous 1.5 C level. How does that possibly support your “no effect” fantasy>
They absolutely do NOT say that. Here is what they say.
We show that HTHH has a tangible impact of the chance of imminent 1.5 °C exceedance (increasing the chance of at least one of the next 5 years exceeding 1.5 °C by 7%), but the level of climate policy ambition, particularly the mitigation of short-lived climate pollutants, dominates the 1.5 °C exceedance outlook over decadal timescales.
I didn’t say it had “no effect”. I said Jenkins et al. 2023 conclude that it has but only a small effect on the global average temperature.
This is statistical nonsense—an invalid extrapolation from linear regression of bogus air temperature data and bogus “climate” models. Typical UN propaganda that is regurgitated over and over.
And once again, the GAT is a meaningless number that cannot represent “the climate”.
It certainly is sensible and reasonable that “nobody really knows what its full effect is going to be”- so they shouldn’t pretend they do.
Funny how you always think what they say is wrong. Do you think their projection of Tonga effects could be wrong?
Yes, of course. But they aren’t alone and they seem to mainly be agreeing with what other groups are reporting.
Those who have to discount the effect of HT, to push their CO2 warming fakery.
Have you got even the slightest evidence this the 2023 El Nino had any human causation whatsoever ??
Simon will be upset 😉.
Most papers predicted warming of the troposphere and cooling of the stratosphere, and that has happened.
Milo
Sure?
You just need to look at how much LS cooled in 2020 compared to 2022 to understand that the LS cooling caused by Hunga Tonga was minimal.
Can you really be this ignorant, or are you just playing so in hopes of the ignorant buying your lies?
Stratospheric cooling means tropospheric warming. That’s global warming gospel.
Yes, was thinking about that too, just now. Nail can’t wait to call them deniers usually.
Everyone is entitled to their opinion. That one may be correct, but..
“Recent monthly temperature anomalies are a degree of magnitude higher than the previous records. The Tonga eruption isn’t the cause”.
This is entirely possible, but then what is the explanation for the outlier temps, a degree of magnitude is significant? Are you suggesting a static 2ppm increase in co2 caused it? By what mechanism? A tipping point? Which one, there are so many?
Please show your work as well.
Currently, i’m unaware of any other event that could have affected 2023 the way it did. But i’m just some guy who reads a lot.
You can absolutely bet that fungal will not be able to show any form of human causation for the El Nino that is singly responsible for the warm spike of 2023.
“Everyone is entitled to their opinion.” And ultimately that’s about all we really have regarding the climate- certainly not enough to panic and destroy our economies and landscapes out of fear.
Isn’t that the truth!
somebody gave you a negative hit- so I canceled it 🙂
must have been one of the few here who quake in fear of what the settled science says 🙂
Ditto. The hockey stick alarmists can’t defend their pseudoscience, so they just push the red button instead.
the hockey shtick!
“The Tonga eruption isn’t the cause.”
Just because Roy says “doesn’t appear to” is not evidence of any sort whatsoever.
Have you got even the tiniest bit of evidence that the current El Nino has any human causation at all ???
Or are you going to avoid producing such evidence, like you always do…
… hence PROVING that the El Nino was TOTALLY NATURAL. !
Or are you going to go down the la-la-land route and say the warm year wasn’t caused by the El Nino.
That would be even more idiotic than what we usually get from you.
Shortly after the 15/16 high, UAH measurements showed the fastest drop ever recorded. whatever happens this coming year is the interesting thing to watch.
That is their opinion, not established fact.
Just how much of this so called man made warming has been due to the switch from recording temps with glass thermometers over to digital thermometers.
Currently am doing my own reseach on this and the results so far suggest its a far bigger factor then man made C02 will ever be.
Could be. Imagine how much trouble there was reading those glass thermometers in a satellite.
Well they don’t quote a satellite when a record day time high is reached now do they!
UAH does not report daily values at all.
They are not reporting WEATHER, is that what you mean ?
Now, now – there aren’t any digital thermometers in a satellite either, are there? As you well know it’s done using lasers and proxies, calibrated to give a value representative of an actual temperature reading.
Whups, that’ll teach me to post before checking. They do, of course, use Microwave Sounding Units and proxies to give a value of an actual temperature reading.
Well yes…if you accept the broad definition of a “thermometer” as being anything that measures temperature then the whole MSU itself could be considered a thermometer. I was assuming you were asking in the more traditional sense of a directly sensed temperature though. As I said below, there are 2 (at least) RTDs onboard.
There is no such thing a a direct measurement of temperature. For instance, your fluid in glass thermometer uses a proxy measure of the expansion of the fluid to interpret the temperature.
I don’t disagree. It’s a point I make frequently as well. I’m only using the term “directly” in this context as an antonym to “remotely”.
To be pedantic…yes. There are 2 RTDs used to measure the temperature of space and the hot target.
bdgwx,
Within 50 metres of a typical land surface temperatures screen are objects, natural and human. 50m around a satellite, not so much. Troublesome interferences can arise. Geoff S
The body of the satellite is within 1m of the radiometer. It creates troublesome interference.
But it is constant and unchanging.
Totally the opposite of surface stations.
I don’t think anyone can say this strong El Nino effect was caused by humans !
Where did you get the “man-made warming” idea from ?
What am saying is that the only man made factor in this current warming is likely to be the switch from glass thermometers to digital thermometers.
This is not a strong El Nino. It is still much smaller than 2015/16 and 1997/98. Yet look at the record warm temperatures.
lt may not be a strong El Nino, but just look at the amount of windshear over the Eastern Pacific at the moment to transport that heat through the atmosphere.
taxed,
Fungie doesn’t understand science. He just knows how to look at the slope of a ruler.
So it’s not the El Nino now, it’s windshear? What next, Godzilla?
Your total lack of understanding of anything to do with anything, especially El Nino, is hilarious.
Now, any evidence of any human causation.????
or are you agreeing that this MAJOR EL NINO was TOTALLY NATURAL
Retreating into a fantasy? Stop doing that and do try to remain in the real world for once will you.
ROFLMAO.
Look at the atmospheric temperature response. UAH charts show it clearly starting from the ENSO area in April
This is a major El Nino event
Just because you are confused and very ignorant about EL Ninos, doesn’t change that fact.
They are ALL that way truly stupid to ignore a big oceanic outflow of energy into the much lower mass atmosphere which is why we see those rapid upward temperature changes then when El-Nino drops way down the temperature plunges soon afterwards.
“much smaller” by what measure?
Two years ago on 1st January 2020 new limits on the sulphur content in fuel oil used by world shipping came into force and most ships now use very low sulphur fuel oil (VLSFO)
There are over 105,000 vessels making 4.6m port calls a year according to UNCTAD which thousands of vessels are at sea at any one time.
Use of VLSFO could obviously have an effect world temperature
“which means|”
UAH temperature is derived from remote sensing instruments on satellites, it does not rely on thermometers.
And that is supposed to make it more accurate for temperature? Since they measure irradiance which is affected by cloud cover, and they don’t know the cloud cover at the point of measurement, how can they convert the irradiance value into a temperature with an accuracy in the hundredths digit?
I did not say satellites were more accurate, I said they are not based on thermometers, so the argument forwarded by Taxed cannot apply.
It is more than a little amusing, however, that satellite records were heralded as the gold standard by WUWT readers until the satellites started showing things they didn’t want to see.
The “gold” standard is made up by you! Where UAH is important is the coverage of most of the globe on an equal basis. UAH provides a second view of what is going on. Similar to USCRN, providing a check on UHI and a check on “global” temperature.
What a moronic statement !
UAH data just highlights the massive effect the current El Nino has had on atmospheric temperatures.
Something the surface fabrication are totally incapable of doing, as they are so totally CORRUPTED by urban, airport, land-use, bad siting, thermometer issues, agenda-driven and homogenisation maladjustments etc.
The UAH satellite record correlates with the weather balloon data (97 percnt)..
The NASA/NOAA surface temperature data do not correlate with the weather balloon data.
So which database should we take more seriously?
Yeah…UAH matches IGRA because S&C adjusted IGRA to match UAH. Your source even says that. And you have been told this multiple times. You are doing the digital equivalent of putting your fingers in your ears and screaming “la..la..la” really loud.
And yes, I know. You’ll repeat the same story over and over again and feign like you didn’t know. So I post this for this lurkers only.
It’s only this site and a few and diminishing others like it that claim UAH is the most reliable global temperature record; hence its presence on the side panel here.
The precision of the monthly updates is a result of the averaging of the temperatures, by the way; it’s not a reflection of the accuracy of the instruments used, whether surface or satellite.
“The precision of the monthly updates is a result of the averaging of the temperatures, by the way; it’s not a reflection of the accuracy of the instruments used, whether surface or satellite.”
Anyone who has ever installed kitchen cabinets knows that the precision of the the cabinets can’t be better than the accuracy of the measurement device used to size the space.
Averaging doesn’t increase precision except to someone that has no experience in the real world.
As Dr. Taylor says in his book, the stated value of the measurement should have the same magnitude as the uncertainty of the measurement. That means the average should have the same magnitude as the accuracy of the average as indicated by its measurement uncertainty.
Precision is not accuracy. Anyone that believes that an average can increase anything beyond the components making up the average is only fooling themselves.
With respect, I think you’re missing the point here. If you have a series of numbers that you need to find the average for then you will inevitably start accruing spare decimal places. It’s just an artefact of the mathematical process of averaging, even if you only start out with whole numbers.
It has nothing to do with the distinction between precision and accuracy.
“spare decimal places” — HAHAHAHAHAHAAHAHAH
Hand-waved nonsense.
Only if you are using a computer that “accumulates”. Proper programming would recognize Significant Digits and properly apply the rounding rules.
By the way, this doesn’t only apply to scientific endeavors. You’ve never had any accounting training either have you? Do you think banks accumulate decimal places when calculating their accounts?
“you will inevitably start accruing spare decimal places.”
Your mathematical and scientific comprehension reaches an absolutely new LOW
…. and it was well below zero to start with. !
TFN,
Repeated raw satellite observations are rather close to IID, independent and identically distributed. Averaging them is closer to ideal statistical purity than averaging typical daily land surface temperatures. Close to one instrument for years at a time, one enclosure, one data cruncher, system designed for the purpose (not for miscellaneous events like aircraft control conditions) – but you know all this. You just choose not to talk about it much. Geoff S
Yawn.
You come here to learn.. yet you have failed utterly and completely.
You don’t seriously think the surface data fabrications, contaminated and corrupted as they are by urban, airport, land-use, bad siting, thermometer issues, agenda-driven and homogenisation maladjustments etc…
… can possibly give even a remotely accurate representation of global temperature changes over time.
…. are you that much in fantasy la-lal-land ??
Now.. What is the human causations of the warming released by the current El Nino, which is the only thing causing this years warm spike.
You still keep running away like a mindless headless chicken-little
This is your evidence that WUWT declares “UAH is the most reliable global temperature record”? Beyond pathetic.
So what they are recording then is the amount of heat passing through the atmosphere.?
Has ther been any reseach into how increased windshear through out the atmosphere would effect the instruments readings.?
No. They are using the recorded microwave emissions from oxygen molecules captured by the MSUs and then using a complicated a model map that into meaning temperatures which are then gridded, corrected, infilled, and spatially averaged.
Microwave sounding units on satellites measure the brightness of layers of the atmosphere, and scientists use models to convert this data into temperature estimates. There are a lot of adjustments applied to correct for things like satellite orbital drift or instrument miscalibration.
“applied to correct”
Yes. Here are the corrections that UAH has applied over the years. For convenience I include how the correction changed the overall warming trend with the exception of the inaugural version for which I could not find information regarding the magnitude of the effect.
Year / Version / Effect / Description / Citation
Adjustment 1: 1992 : A : unknown effect : simple bias correction : Spencer & Christy 1992
Adjustment 2: 1994 : B : -0.03 C/decade : linear diurnal drift : Christy et al. 1995
Adjustment 3: 1997 : C : +0.03 C/decade : removal of residual annual cycle related to hot
target variations : Christy et al. 1998
Adjustment 4: 1998 : D : +0.10 C/decade : orbital decay : Christy et al. 2000
Adjustment 5: 1998 : D : -0.07 C/decade : removal of dependence on time variations of hot target temperature : Christy et al. 2000
Adjustment 6: 2003 : 5.0 : +0.008 C/decade : non-linear diurnal drift : Christy et al. 2003
Adjustment 7: 2004 : 5.1 : -0.004 C/decade : data criteria acceptance : Karl et al. 2006
Adjustment 8: 2005 : 5.2 : +0.035 C/decade : diurnal drift : Spencer et al. 2006
Adjustment 9: 2017 : 6.0 : -0.03 C/decade : new method : Spencer et al. 2017 [open]
ROFL!!
Those “corrections” are based on adjusting the individual measurements which creates a different base.
Those “adjustments” are guesses, perhaps informed judgements but still guesses. Guesses carry uncertainty. Meaning all those individual measurements have measurement uncertainty. Meaning the average carries with it the propagated uncertainties of the measurements.
Again, quoting anomalies out to the hundredths digit for measurements with uncertainty in the tenths digit (or more likely in the units digit) is only fooling yourself. That hundredths digit is part of the GREAT UNKNOWN.
In bingbongwaxmonkey’s world, the everything is static and one-dimensional, serving as his basis for applying consistent adjustments -whether adding or subtracting – to all physical measurments.
I’m not the one applying adjustments. That is Dr. Spencer and Dr. Christy who did that. I’m just the messenger.
First…I think you have me confused with someone else. I don’t advocate for applying constant adjustments. I think the adjustments need to be applied in a way that mitigates error even when the error is different in different situations…dynamically.
Second…the adjustments Dr. Spencer and Dr. Christy make to the raw satellite data is not always constant. In fact, I’m not sure if any of their corrections are constant. For example, the correction for the instrument body effect involves a 4000 equation model that applies a correction suitable for the specific satellite and time in question…dynamically.
Do you not realize the absurdity in that sentence?
There is nothing absurd about it. I get it though. You think making corrections to mitigate error is absurd. May I suggest you let Dr. Spencer know about your incredulity about the absurdity of what he is doing with UAH? You can post on his blog. He even responds to some of the criticisms of his work. You may even want to petition Anthony Watts to have it removed from the WUWT site. I don’t know.
More of the usual clown show to defend the fraudulent and un-defendable “error adjustments” to historic air temperature data.
No adjustment to any past climate data will ever work. It involves making assumptions, and the recorded temperature at a given time is influenced by numerous factors. The fact that you think these corrections mitigate any error at all just highlights your cluelessness.
You’ve made your position abundantly clear. Have you told Roy Spencer and Anthony Watts how you feel about it? Have you told NIST?
Why should he?
Because some weather/hockey stick clown (i.e. yourself) demanded he do so?
Exactly.
Do you want me to ask Dr. Spencer why he using what you feel is an absurd methodology on your behalf?
You will ask “Dr. Spencer” regardless of any answer you might get here.
Seems like the bitterness is kicking in after your epic failure in the El Niño thread. Not as smart as you thought you were huh? Your trolling antics only confirm the sour taste of your own inadequacies.
I’m trying to help you out. Dr. Spencer has proven himself to be receptive to criticism. He even introduced version 5.3 of UAH in response to discussion that occurred here on WUWT. I would present your concern with respect. I’m not going to throw you under the bus so to speak if that is what you are worried about. That’s not my style.
sure.
What about this? UAH continues to publish their products as they’ve always done. But in addition to that it could be requested that they also publish products in which no adjustments/corrections are applied.
You want them to publish raw microwave irradiance data?
Absurd.
Okay, but it doesn’t really change the fact that the record is inhomogeneous due to instrument change and adjustments. That’s the whole issue.
I’m not sure what you’re proposing then. Is the request that he stop publishing UAH products then?
In order to PROPERLY mitigate errors you *have* to know the entire situation at the point in time the measurement is taken. That’s impossible unless you can account for all variables.
As Walter has pointed out several times, for surface measurements that includes the microclimate conditions at the point in time the measurements are taken. Modern weather stations can record lots of data that apparently isn’t being used today, including UV levels, pressure, humidity, wind, etc. All of these could be used as factors in a metric that would be much more informative than “temperature”. But climate science stubbornly sticks to 17th century techniques because of “TRADITION”.
The satellite measurements are no better. Unless the atmosphere can be appropriately characterized; e.g. cloud cover, etc.; at the point in time an irradiance measurement is taken then the actual measurement can’t be related to any other measurement where the “microclimate” is different.
Bottom line: The so-called adjustments are GUESSES. Guesses whose accuracy is questionable at best. They only ADD to the measurement uncertainty associated with the final result.
But hey, this bgw dude psychic, he’s able to discern such numbers from decades ago and remove all “error”.
And the clowns will never admit to this reality.
The Official UAH data is reported to three decimal places, Tim. This is because of averaging. Mathematics. Not measurements.
IDIOT.
Why don’t you bother making some scientific arguments for once, instead of hiding behind a facade of superiority. Maybe then you’ll realize how utter hypocritical and foolish you appear when you throw around insults like ‘idiot.’
Been around the circus rings many times in the past with these clowns, no need to repeat. They are utterly and completely clue-resistant.
“Why don’t you bother making some scientific arguments for once”
You mean like you HAVEN’T.
You keep proving you are hypocritical fool !.. well done. !
It isn’t an insult. It was an accurate descriptor based on the monumentally stupid reply that TheFinalNail gave.
How many references do you want?
Significant Figures Lab | General Chemistry Lab News (middlebury.edu)
significant (purdue.edu)
If you need more references I can supply them. Please note, these are university lab references. If you wish to refute them, please do so with your own references.
“For example, if your average is 3.025622 and your standard deviation is 0.01845, then this is the correct number of significant figures for the average: 3.03, because the first digit of the standard deviation is in the hundredths place, so the last significant digit of the average is in the hundredths place.”
Have you written to NIST yet to explain why TN1900 Ex2 is wrong?
There they get a standard deviation of 4.1°C, yet report the average as 25.6, rather than the mandatory 26°C.
Or the GUM, where they give an example of temperature measurements, with a standard deviation of 1.49, yet they report the average to a hundredth of a degree.
Hmmm! 4 point 1, and 25 point 6. Seems like a correct use to me.
Do you understand decimal places? I see:
1 point 49
0 point 33
100 point 14
I see 1.489 rounded to 1.49.
I see 0.333 rounded to 0.33
I see 100.145 rounded to 100.14
You don’t appear to have an understanding of how Significant Digits work. I think you need more study in measuring things using real world devices. I’ll ask again, what physical lab courses have you had in college?
“Seems like a correct use to me.”
I’m not disagreeing. But it is incorrect according to your first reference.
Your emphasis.
The first digit of 4.1 is 4. Therefore if you accept this argument, the last significant digit of the average should be in the units column.
“You don’t appear to have an understanding of how Significant Digits work”
I keep telling you I agree with the GUM and others that say round your uncertainty to a reasonable number of digits, 1 or 2, usually, then round the result so it agrees with the magnitude of the uncertainty. That is, if your uncertainty is 0.33, your answer should have two decimal places.
“””””I’ll ask again, what physical lab courses have you had in college?”””””
You haven’t answered my question!
Go do your own studying to find your answer.
Anyone who has had junior and senior level college lab courses understands what is going on here.
“You haven’t answered my question!”
Correct. Because I have no interest in letting you drag this down into yet another ad hominem argument. Argue the facts, not the qualifications. I don’t care if you have a PhD in applied use of a tape measure, or if you learnt everything from random things found on the internet – the facts should speak for themselves.
I’m not looking for an ad hominem. I want to know where your expertise comes from. Honestly, it appears you have no appreciation nor understanding of making exacting scientific measurements capable of withstanding commercial or legal examination.
You can’t get the FACTS right because you can’t read.
It’s FIRST DECIMAL PLACE.
Which you would know if you had any qualifications or experience in measuring things in a physical science lab. Or if you had any applicable real world experience such as in designing something as simple as a staircase going up to 2nd floor deck on a house. How precisely you calculate the average length of your boards won’t help when you wind up 1/4″ short of reaching the needed height.
“It’s FIRST DECIMAL PLACE.”
Hilarious. So now it matters what size the units are. So let me try to get t his straight. Measure a number of wooden planks in meters, get a sd of 0.123, and I’m only allowed to report the average to the nearest 0.1m. But measure them in cm, get a sd of 12.3, and I can report the average to 0.1cm. Is that what your rules are now telling you?
“Which you would know if you had any qualifications or experience in measuring things in a physical science lab.”
As Jim said, when you have to resort to ad hominems you’ve already lost the argument.
If you are measuring in meters then your average should be in meters. If you are measuring in centimeters then you average should be in cm.
You keep trying to come back to the inane assertion that averaging can increase resolution. It can’t. Never has, never will.
If you can’t understand measuring in meters is different than measuring in centimeters then you need to put down the bottle!
What units should I use to measure how far over the Gormans’ head these points keep flying.
You are claiming, on the basis of a clumsily worded article on significant figures, that the rule is now that you stop at the first decimal point of your uncertainty. This means that you can have as many digits as you like to the left of the decimal point, and only have to worry about those to the right. I’m trying to explain to you why this rule makes absolutely no sense. Measuring in meters or centimeters is identical except where you put the decimal point. 0.123m = 12.3cm. But one the first decimal place is also the first significant figure, and for the other it’s the third.
“You keep trying to come back to the inane assertion that averaging can increase resolution”
Stop changing the subject. This is about the claimed correct number of significant figures. The “rule” quoted isn’t even talking about the uncertainty of the average, it’s using the standard deviation.
“If you can’t understand measuring in meters is different than measuring in centimeters then you need to put down the bottle!”
How is it different a[part from the decimal point? They are just different scales of the same thing, the measurement. Do you think it would be different if I used some antiquated units like yards or inches?
Only because you don’t want to understand the concept. It is not simple although it is straightforward.
There are any number of university lab instructions on the internet. Why don’t you post one that is well written and supports your position that Significant Digit are a waste of time? I, for one, would love to see a lab instructions at university level that doesn’t require their use when analyzing experimental data. If you can’t find one, you have lost any argument concerning them.
“Why don’t you post one that is well written and supports your position that Significant Digit are a waste of time?”
A bold lie. I don’t think they are a waste of time, just that it’s better to use them as described in the GUM etc, than in introductory texts. They only give an approximation of a correct uncertainty propagation, and those that insist that the uncertainty of a mean cannot be better than the individual measurements are just plain wrong. They make sense for averaging the same thing a a few times, but are nonsense if you apply them to a large statistical sample.
“those that insist that the uncertainty of a mean cannot be better than the individual measurements are just plain wrong. “
Says the man who has never built stud walls for a room and then had to contend with the wavy drywall attached to those walls!
Says the man who has never built a staircase and had it come up 1″ short while his SEM of the average was ZERO, i.e. his mean of the boards was exact!
Says the man who has never had to survey land to lay out a road bed and had to order extra gravel to build it up while the SEM for the average height was 0 (zero).
You are still depending on the argumentative fallacy of Equivocation – trying to substitute the SEM for measurement uncertainty by using a deprecated definition of the SEM as being the uncertainty of the mean.
From the GUM.
I take 30 daily measurements to determine the monthly average.
What better describes the dispersion of values attributable to the measurand?
σ –> Standard Deviation, or
s = σ/√n –> Standard Error of the Mean
You *KNOW* what he’s going to say.
The standard deviation of the sample means, i.e. “s”.
Did you expect an answer from Tim?
Obviously the second option is best, as described in TN1900.
“Says the man who has never built stud walls”
These ad hominem arguments are so weird. You can’t point out the flaws in the Gormans’ understanding of statistics unless you’ve personally built a house with your bare hands. Yet they have no problem claiming that everyone who’s ever produced global anomaly data is a fraud, despite the fact that I’m sure none of them have ever produced their own global data set.
It all has to do with REAL WORLD EXPERIENCE IN MEASURING THINGS!
Something which you totally lack.
I have produced my own data set since 2012 (actually since 2002 but I seem to have lost 2002-2011).
It’s why I KNOW that the daytime temp is a sinusoid and the nighttime temp is an exponential decay. Something climate science totally ignores – and so do you!
It’s why I KNOW that degree-day is a better measure of the climate than the median value between a sinusoid distribution and an exponential distribution.
You can’t even accept that the variance of an anomaly is the addition of the variance of the components used for the anomaly! And that variance is a measure of uncertainty1
You continue to want to shove everything into a statistical world where all data is random and Gaussian and any uncertainty cancels. The real world just doesn’t work that way!
“You are claiming, on the basis of a clumsily worded article on significant figures, that the rule is now that you stop at the first decimal point of your uncertainty.”
If you are quoting your measurement in terms of meters then you must live with that. That *is*, by definition, measuring in terms of meters.
If you measured with a finer resolution, i.e. centimeters, then you quote the measurement in centimeters!
The only thing clumsy here is your attempt to extricate yourself from the hole you dug for yourself.
Every time I think we’ve reached a new low, you go under it. Have you ever quoted a measurement in meters? What do you think the point of a decimal point is? If a value is written in meters, everything tot he left of the decimal point is in meters, everything to the left is in fractions of a meter. It’s how the decimal system works. Even you’ve probably had top use decimal currency. If something is priced at $1.23 do you think, that’s wrong it should be 123 cents?
“Every time I think we’ve reached a new low, you go under it. Have you ever quoted a measurement in meters?”
Have you ever measured a football field with a micrometer?
You didn’t answer my question. Do you know what scientific notation is for?
You didn’t address how you get a measuring device that can measure long distances down to the micrometer. It goes back to you not understanding resolution OR uncertianty.
Money is a COUNTING thing, not a measurement thing. This has been pointed out to you multiple times but you just keep coming back to using counting scenarios.
Come on dude. If you measured planks to the nearest meter, just how do you get an uncertainty in the one thousandths.
Take three boards 1m, 2m, and 4m. What is the average? 7/3 = 2.3333333333333… . Where exactly do you stop decimal places and why? Is it just up to the individual to decide how closely to portray the values of the dispersion of measurements that can be attributed to the measurand? Exactly what is the measurand in your example? Even a half-width is ± 1/2 meter.
Better yet how do you get an uncertainty that is less than 1 meter in value if you are only measuring to the nearest meter.
Here is a document you should read about resolution uncertainty.
https://www.ncbi.nlm.nih.gov/pmc/articles/PMC4654598/
Please take note of the following towards the end of the document.
I know you have taken so-called refutation of Dr. Pat Frank’s paper on resolution uncertainty to heart and consistently denigrate what he has proposed. This document should educate further about how resolution uncertainty must be greater than the standard deviation of the mean.
“What is the average? 7/3 = 2.3333333333333… . Where exactly do you stop decimal places and why?”
Firstly, I wouldn’t be taking the average of just 3 boards – or at least I’d want to know the purpose of the average. Secondly, I’d try to use the most appropriate number for the purpose. Ideally I’s say it was 2 1/3, but otherwise 2.3 or 2.33 seem fine. 2 would be misleading highly misleading.
If I follow the rules for any of the metrology books you recommend, I’d first get the SEM, 0.882, so depending on which rule I was using I could say 2.3(9)m, or 2.33(89)m. Or probably more likely, 2.3 ± 1.8m with a coverage factor of k=2.
“Better yet how do you get an uncertainty that is less than 1 meter in value if you are only measuring to the nearest meter..”
When I say I’m measuring in meters, I hoped you would understand that does not mean to the nearest meter. No wonder you are confused about this.
“Here is a document you should read about resolution uncertainty.”
Thanks, I’ll have a look – but this argument has nothing to do with resolution. Look a the example “For example, if your average is 3.025622 and your standard deviation is 0.01845”, nothing to do with the resolution of the measurements, entirely to do with the standard deviation.
“Firstly, I wouldn’t be taking the average of just 3 boards – or at least I’d want to know the purpose of the average.”
Again, no real world experience. You are a carpenter creating a staircase. How many boards will you have for use as a stringer?
“SEM”
The SEM is *NOT* a metric for the measurement uncertainty of the boards. It’s how accurately you calculated the mean.
If your measuring tape was a bad one, say an error of +/- 1″, your SEM could be zero but your measurement error would significant.
That means the stringer you build for the staircase could be as much as 1″ short! Even though your SEM would be 0 (zero)!
You just never quite seem to be able to understand this.
Now go tell the customer you have to charge him for 4 stringers because you missed with the first two!
“When I say I’m measuring in meters, I hoped you would understand that does not mean to the nearest meter. No wonder you are confused about this.”
Malarky! Did you *really* think anyone would buy this excuse? If you are measuring is units LESS than a meter, e.g. in cm, then why would your result be anything different from measuring in cm?
“Thanks, I’ll have a look – but this argument has nothing to do with resolution.”
You STILL don’t get it! You can’t have an average of 3.025622 if your resolution is only in the tenths or hundredths digit! Where did the extra digits come from? The GREAT UNKNOWN? Your cloudy crystal ball.
We’ve been down this road before. My frequency counter reads out to the unit digit (i.e. 1 hz) but it’s uncertainty is in the tenths digit. I can quote the hz figure but it would be misleading to anyone trying to measure the same frequency. I simply don’t know what that 8th digit is!
“You are a carpenter creating a staircase. How many boards will you have for use as a stringer?”
And why would you want to know the average of the three boards?
“The SEM is *NOT* a metric for the measurement uncertainty of the boards. It’s how accurately you calculated the mean.”
Nobody said anything about measurement uncertainty. The assumption is these are three boards selected at random from a large population of boards and we are using the average of the three as a very uncertain estimate of the population average. How accurate that is is very much what we want to know.
“If your measuring tape was a bad one, say an error of +/- 1″, your SEM could be zero but your measurement error would significant.”
Then you’re screwed. Use a better tape measure, preferably a metric one. Again, the example we are arguing about is talking only about the standard deviation of the values p- it says nothing about what happens if you use a bad tape measure.
“That means the stringer you build for the staircase could be as much as 1″ short! Even though your SEM would be 0 (zero)! ”
Could you explain exactly how you use the average of three boards of completely different lengths to construct your stringer. Suppose you didn’t take the average but the sum, or just the length of each individual board. How would not using the SEM make your measurements any more accurate. You’ve added 2.5cm to each measurement – you’ve got problems no matter what value you are taking.
“Did you *really* think anyone would buy this excuse?”
I’m sorry. Maybe sometimes I overestimate the intelligence of an American not used to using scientific measurements. It’s quite normal to quote a value in meters that contains a fraction. If someone is asked to give their height in meters they might say 1.85m. They would not round this to 2m. Even in the olden days I’m sure people would give measurements in fractions of an inch.
“If you are measuring is units LESS than a meter, e.g. in cm, then why would your result be anything different from measuring in cm? ”
It wouldn’t. That’s my point. the problem is if you insist on basing uncertainty as the first significant figure after the decimal point.
“You STILL don’t get it! You can’t have an average of 3.025622 if your resolution is only in the tenths or hundredths digit! Where did the extra digits come from?”
From the example we were talking about.
“And why would you want to know the average of the three boards?”
So I can figure out how many board-feet to charge the customer for! Again, your total lack of real world experience just comes shining through in everything you post.
“Nobody said anything about measurement uncertainty. “
Measurement uncertainty is the ENTIRE TOPIC! *YOU* keep wanting to shift it to how precisely you can calculate the population average – the SEM. You have yet to give a real world example of how those of us living in the real world care one iota about the SEM – and that includes temperature in the real world.
” How accurate that is is very much what we want to know.”
NO! NO! NO! How precisely you locate the population mean is of no use if you don’t know the measurement uncertainty of the mean!
When you are building a staircase, designing the o-ring for the Space Shuttle fuel system, or estimating the carrying load of a beam, YOU WAN’T TO KNOW THE MEASUREMENT UNCERTAINTY!
It simply doesn’t matter if the average value of the item in question is 13.25″ or 13.26″ if the measurement uncertainty is +/- .2″! You can calculate the mean out to the millionth digit but if the uncertainty interval is wider than the decimal place you calculate out to then how do you even evaluate if the millionth digit is correct or not? You can’t measure any member of the set to more than a +/- 0.2″ accuracy anyway!
“Then you’re screwed. Use a better tape measure, preferably a metric one. “
Once again, your lack of any real world experience is shining through! It doesn’t matter if it is 1″ short, .25″ short, or .125″ short – IT’S TOO SHORT! How do you lengthen it?
“Again, the example we are arguing about is talking only about the standard deviation of the values p- it says nothing about what happens if you use a bad tape measure.”
Once gain, no actual real world experience at all. In the real world ALL tape measures are bad. Some are just less bad than others! That’s what uncertainty is all about!
“Could you explain exactly how you use the average of three boards of completely different lengths to construct your stringer.”
Again, no real world experience! I DON’T USE THE AVERAGE LENGTH! It’s why I don’t CARE how many digits you calculate the mean out to!
I use the minus interval of the uncertainty interval to make sure the stringer is long enough and then I cut it to fit if it’s too long!
“How would not using the SEM make your measurements any more accurate.”
Did you think about this for even a second before you posted it?
” It’s quite normal to quote a value in meters that contains a fraction.”
Again, you’ve never ever studied Taylor or Bevington at all. All you do is cherry pick. What units is the uncertainty given in? The stated value should match that. If your uncertainty is in cm then you state the measurement in cm. If your uncertainty is in mm then you state the measurement in mm. In the REAL world you are going to find that most people don’t measure something very long using a micrometer. It’s too hard to make a micrometer that long that doesn’t have uncertainty greater than the differences you are trying to identify! It’s why GHz frequency counters don’t usually have resolutions in the units digit. The counting interval is so long that minor variations in the signal and/or the measurement device mask the digits at that resolution.
I’ll reiterate – you are so used to seeing stated values with no uncertainty interval that you think all stated values are 100% accurate!
“It wouldn’t. That’s my point. the problem is if you insist on basing uncertainty as the first significant figure after the decimal point.”
You *HAVE* to have common units in the stated value and in the uncertainty interval. It’s the only way you can relate different measurements. You keep wanting to ignore what the whole purpose of measuring thigs *is*. Does the term “scientific notation” mean anything to you at all?
“So I can figure out how many board-feet to charge the customer for! ”
Assume I’m someone who has never charged anybody to build a staircase, and explain exactly why you would use the average of the 3 boards to work out your charges, rather than the total length.
“It simply doesn’t matter if the average value of the item in question is 13.25″ or 13.26″ if the measurement uncertainty is +/- .2″! You can calculate the mean out to the millionth digit but if the uncertainty interval is wider than the decimal place you calculate out to then how do you even evaluate if the millionth digit is correct or not?”
The example here is that you have three boards of length 1m, 2m, and 4m. No mention of the resolution of the measurement. For all I know the boards were just measured to the nearest meter, so the resolution is 1m. The average is 7 / 3, which is the most exact average you can have given the information available. If you don’t like fractions you can approximate this as 2.3 or 2.33. Your logic is that you should actually quote the figure as 2m. I’m really not sure why you think this is the best option.
The reference you where using says nothing about the resolution of the measurements. It says to take the standard deviation of the three values and use that as the uncertainty. The sample standard deviation is 1.528. You say that this means take the first significant digit after the decimal point as the basis of the magnitude of the uncertainty. Hence using their rules I should quote the figure as 2.3m, despite the resolution only being 1m.
“Again, no real world experience!”
Which is why I’m asking you to explain, rather than assume constructing a stringer is something everyone knows how to do.
” I DON’T USE THE AVERAGE LENGTH! It’s why I don’t CARE how many digits you calculate the mean out to!”
So why did you bring it up as an example of an average. Really this whole “real world experience” is just an excuse to continuously miss the point. The question is about the uncertainty of an average. You keep bringing up examples of things where you would not need an average – making those examples worthless. If you want to impress me with your real world experience, point me to an example where you actually needed to know the uncertainty of the average of a large number of different things.
“Again, you’ve never ever studied Taylor or Bevington at all.”
This is the small world Tim lives in. I can’t make a statement about having a fraction of a meter, without having studied all the works of metrology. I doubt he’ll point me to the section where Taylor says you cannot state a measurement in fractions of a meter, I doubt it exists, but if it does then Taylor would just be wrong. As single book by a single author does not get to dictate how the rest of the world measures things.
“What units is the uncertainty given in?”
The same as the stated value – obvs.
“If your uncertainty is in cm then you state the measurement in cm.”
So?
“In the REAL world you are going to find that most people don’t measure something very long using a micrometer.”
In the real world, this has nothing to do with what you use to measure with, it’s what units you use to report the result. All this is just the typical Gorman distraction. Your origional claim was clearly nonsense – I gave a simple counter argument, and rather than addressing it, you are now taking us on a never ending wander through your “real” world, debating if you can have a fraction of a meter, rather than address the simple point I was making.
You claim that when the article says you should use the first “decimal place” as the magnitude of the uncertainty, that they mean literally the first significant digit after the decimal point. Whether they do or not, I think that’s nut, and give as an illustration of why that makes no sense a comparison of reporting something in meters verses centimeters – could just as well be any SI units, possibly even the legacy imperial ones.
E.g. I can calculate the mean and sd of a few things using any units I want. In meters I might get a mean of 0.8765m with an sd of 0.1234m. I could just as easily report that as 87.65cm and 12.34cm. Applying the Gorman rule for significant figures I would have to write the first as
0.9 ± 0.1m
but the second as
87.6 ± 12.3cm
and if I reported it in mm I would be
876.5 ± 123.4mm
It makes no sense to me to use the position of the decimal point to change how many figures you are allowed to quote when the measurements are all the same.
“Assume I’m someone who has never charged anybody to build a staircase”
I don’t have to assume that. You’ve proved it over and over and over again!
“explain exactly why you would use the average of the 3 boards to work out your charges, rather than the total length.”
Your lack of real world experience is showing again! Have you ever worked up an estimate of charges for a customer?
“The example here is that you have three boards of length 1m, 2m, and 4m.”
You didn’t address the issue. No amount of word salad can cover that up. How do you asses the accuracy of something you can’t know?
“Which is why I’m asking you to explain”
No, you are trying to cover up the fact that you are wrong.
“The question is about the uncertainty of an average.”
NO! THE QUESTION IS ABOUT THE **ACCURACY** OF AN AVERAGE!
Once again, the engineers for the o-ring on the space shuttle could have calculated the SEM of the sample measurements out to the millionth digit assuming the stated values were 100% accurate AND IT WOULD HAVE STILL FAILED! They wouldn’t have properly allowed for the accuracy of those measurements.
That is what you are arguing. That the number of digits in your precisely calculated mean is of more importance than the actual accuracy of that precisely calculated mean.
Until you can get the difference into your head there isn’t any use in arguing with you. You are stubbornly fixated on assuming every measurement distribution is random, Gaussian, has no systematic uncertainty, and all measurement error cancels. out – leaving the SEM (a measure of your sampling error and not the accuracy of the mean) as the most important factor for ANY measurement distribution.
It simply isn’t real world. And it will never be so!
https://www.ncbi.nlm.nih.gov/pmc/articles/PMC4654598/
I take it you read this part.
This is what I keep trying to say. If the distribution of your population is a lot larger than the measurement resolution, the resolution becomes irrelevant. This article is looking at the case where you are measuring the same thing multiple times, with noise less than the resolution.
“This is what I keep trying to say. If the distribution of your population is a lot larger than the measurement resolution, the resolution becomes irrelevant. This article is looking at the case where you are measuring the same thing multiple times, with noise less than the resolution.”
Do you actually understand what you are saying here?
If the distribution of the data is higher than your measurement resolution then what caused that to happen?
And why does the measurement resolution become irrelevant?
This isn’t just a matter of resolution. How do you distinguish if the differing measurement data is due to noise or due to instrument uncertiainty?
“Do you actually understand what you are saying here?”
Yes, do you?
“If the distribution of the data is higher than your measurement resolution then what caused that to happen?”
Measuring things of different sizes. Or possibly having a very noisy measuring device.
“And why does the measurement resolution become irrelevant? ”
I’m quoting the paper I was asked to read.Why do you think they say that if σ is much greater than the resolution, the resolution becomes infinite?
I could try to explain it to you yet again, but you either have very a bad memory, or just a very selective one.
“Measuring things of different sizes. Or possibly having a very noisy measuring device.”
Then how do you locate the average more precisely than you can measure?
“Why do you think they say that if σ is much greater than the resolution, the resolution becomes infinite?”
I can’t find that anywhere in the document. The factor R is the resolution and is fixed at one unit. I suspect you are cherry picking again and confusing the conclusion that the number of possible values contained in the expanded probability interval grows has something to do with resolution.
“We note that in Fig. 8, and in the associated three statistics in Table 1, the containment probability only addresses the question of what fraction of errors (for a particular μ, σ) are contained in the uncertainty interval; “
” However, even for the infinite resolution case of a Gaussian population, 95 % is the expected fraction of error containment, and any finite sample size will have slightly more, or slightly less, than 95 % of the deviations from the mean contained within 2 s. “
This “infinite resolution” has nothing to do with measurement resolution.
“In the special test scenario, repeated observations are used to calculate both the sample mean (which in general will not be an integer) and the standard deviation, and these can be expected to approach the discrete population mean and standard deviation x s, in the limit of large sample size.”
“We can imagine that this measurement is repeated a large number of times and then ask what fraction of the errors are contained in the uncertainty statement”
As usual, you are taking a situation with multiple measurements of the same thing and trying to apply it to the temperature data which does *NOT* meet the requirement of multiple measurements of the same thing with the same device under repeatability conditions.
As usual, you understand nothing of the context in the document you are reading. You simply can’t relate to the real world of measurement of different things using different devices at all.
At it’s root, this document does little except confirm that Taylor and Bevington are correct – that in the case of random and Gaussian error from measuring the same thing multiple times, there is cancellation of the errors and the mean is the best estimate of the value of the measurand.
You are back to cherry-picking things you don’t understand. . Do you really believe in infinite resolution?
You interpreted the statement to say “resolution becomes irrelevant”. I really don’t know how you misinterpret this statement to arrive at your conclusion.. This statement actually says the document will examine σ < 1 because large σ, i.e., σ > 1 is equivalent to infinite resolution! You also didn’t read “Section 7 Special Test Scenario”.
Did you not look at the figures?
You also didn’t quote the results of the “special test scenario” in Section 7. Why not? That is where my quote came from and describes the result of what you cherry-picked! You didn’t you read thIs did you? It doesn’t appear that you understood what it says.
Let me quote another statement that comes just shortly after the above.
Think about all the times you’ve been told that averaging large samples doesn’t reduce uncertainty. Here is another example of that from another expert.
“You are back to cherry-picking things you don’t understand”
And here we go again. Jim quotes a conclusion from a report without mentioning an important piece of context. When I quote that context, I’m attacked for cherry-picking.
“Do you really believe in infinite resolution?”
It’s the words of the report you insisted I read, not mine. But the meaning is clear – standard deviations larger than the resolution make the resolution practically irrelevant.
“I really don’t know how you misinterpret this statement to arrive at your conclusion.”
What do you think they mean by “infinite resolution” then. Why limit σ < 1, if you think there is anything worth investigating for much larger values?
“This statement actually says the document will examine σ < 1 because large σ, i.e., σ > 1 is equivalent to infinite resolution!”
Which is what I’m saying.
“You also didn’t read “Section 7 Special Test Scenario”.”
The one where Rule 3 treats the uncertainty when s > 0.6 R, as being the SEM – that is treating the resolution as infinite.
and their final conclusion is
“That is where my quote came from and describes the result of what you cherry-picked! You didn’t you read thIs did you? It doesn’t appear that you understood what it says.”.
Talking of cherry-picking. Look at the previous sentence.
.
You see. that sentence you quoted is talking about Rule 1 – the one derived from the GUM, which they go on to say overestimates the uncertainty.
“Let me quote another statement that comes just shortly after the above.”
What part of “For small σ, e.g., σ < 0.5” didn’t you understand?
“Think about all the times you’ve been told that averaging large samples doesn’t reduce uncertainty.”
And what do you think Rule 3, with s > 0.6 implies? The uncertainty of the mean is s / √N, what do you think that means as N becomes larger.
“It’s the words of the report you insisted I read, not mine. But the meaning is clear – standard deviations larger than the resolution make the resolution practically irrelevant.”
THAT IS NOT THE SAME THING AS INFINTE RESOLUTION! You are already backing away from what you asserted!
This is EXACTLY what we’ve been trying to tell you and which you have adamantly refused to believe. If the standard deviation determines the uncertainty then RESOLUTION is irrelevant. it also means that you need to review your measurement protocol, measuring device, and definition for the measurand. It probably means you are measuring different things under different conditions at the very least!
“Which is what I’m saying.”
You don’t even understand what you are saying. How can σ be greater than the range of the distribution?
“Rule 3 more closely matches the expanded uncertainty to the 95th percentile error while still maintaining a 95 % error containment probability.”
I don’t think you actually understand what this is saying!
“And what do you think Rule 3, with s > 0.6 implies? The uncertainty of the mean is s / √N, what do you think that means as N becomes larger.”
IT MEANS YOU HAVE MULTIPLE MEASUREMENTS OF THE SAME THING TAKEN WITH THE SAME DEVICE UNDER REPEATABILITY CONDITIONS!
What does this have to do with global temperature data sets?
Not a darn thing.
“THAT IS NOT THE SAME THING AS INFINTE RESOLUTION!”
Stop shouting. I didn’t use the phrase infinite resolution, the paper you are claiming supports your argument does. There is only one interpretation of infinite resolution I could think of, a resolution so large that it is not a restriction on the average of many measurements. Just as the paper goes on to explain in the conclusion.
“If the standard deviation determines the uncertainty then RESOLUTION is irrelevant.”
Standard deviation is not the uncertainty of the mean. Standard deviation divided by √N, i.e. the SEM, is the uncertainty of the mean – just as the paper explains in its Rule 3.
“it also means that you need to review your measurement protocol, measuring device, and definition for the measurand. It probably means you are measuring different things under different conditions at the very least!”
Which as I keep explaining to you is exactly the condition when resolution becomes irrelevant.
“How can σ be greater than the range of the distribution?”
Why are you asking? This is another example of you just pulling arguments out of the air in order to distract. σ is not greater than the range. Nobody has said it’s greater than the range. What it can be is greater than 1, where 1 is set as the resolution increment.
“I don’t think you actually understand what this is saying!”
As always when I quote something that refutes Tim’s claim he’ll just claim I didn’t understand it without explanation of what he considers to be the true explanation.
“IT MEANS YOU HAVE MULTIPLE MEASUREMENTS OF THE SAME THING TAKEN WITH THE SAME DEVICE UNDER REPEATABILITY CONDITIONS!”
(Once again the capslock key serves to demonstrate the lack of an actual argument.)
It can be all that, but only is the noise of the measurements is more than 0.6 of the resolution. As I keep saying, resolution is more of a systematic error when you are measuring exactly the same thing with the same accurate instrument. If an instrument has a lot of random uncertainty the resolution uncertainty is more random. The same goes when you are measuring lots of different things, such as global temperatures.
Nothing in the paper depends on this only being measurements of the same thing, it’s all just treated as random values from a distribution.
“What does this have to do with global temperature data sets?”
And there’s the final irony. They produce this paper to prove the uncertainty of global mean temperatures is limited by the instrument resolution. Then when they realize it says the exact opposite, they’ll insist that it says nothing about global mean temperatures.
“ I didn’t use the phrase infinite resolution, the paper you are claiming supports your argument does. “
*YOU* used the quote to imply infinite resolution!
And the paper did *NOT* use infinite resolution, it used R and set R=1!
“Standard deviation is not the uncertainty of the mean.”
The SEM is NOT the accuracy of the mean. It is the ACCURACY of the mean that is important, not how precisely you calculated the inaccurate mean!
Can you get that into your head? Write it down 1000 times.
“The SEM is not the accuracy of the mean!”
The purpose of a measurement is to be able to use it! And it needs to be specified in terms that someone can duplicate it!
The SEM meets neither of those purposes. And yet you stubbornly cling to the idea that the SEM is some kind of real use in the real world! It’s a measure of the sampling error of inaccurate data – and does nothing to allow increasing the accuracy of that inaccurate data!
“Which as I keep explaining to you is exactly the condition when resolution becomes irrelevant.”
You keep saying this and it’s always a garbage assertion! Resolution is ALWAYS relevant. Resolution and accuracy are related but resolution does *NOT* guarantee accuracy.
You can’t even get it into your head what the SEM *is*. The SEM is actually the standard deviation of the sample means. For statisticians those sample means are considered to be 100% accurate and you can calculate their standard deviation.
In truth the sample means carry with them the propagated uncertainty from the values making up the sample distribution. If your sample is is x1+/-u1, x2+/-u2, x3+/-u3, …. then the actual sample mean is the average of x1, x2, x3, …. +/- the quadrature addition of u1, u2, u3, ….
Thus your samples become s1+/- us1, s2+/-us2, s3+/-us3, …..
Now, what exactly is the SEM in this case? *YOU* wan to just throw away us1, us2, us3, etc. The same thing you always want to do with the uncertainty! It’s all random, Gaussian, and cancels, right?
Remember, SEM = SD/sqrt(N). If you know the SD then the SEM is meaningless. What matters is that SD = SEM * sqrt(N).
And it is SD, the standard deviation of the population that determines the values that can be reasonably attributed to the measurand, not the SEM.
Watching the Gormans go through these mental contortions to avoid the obvious point is truly impressive, but I worry I might be doing them permanent harm. In this case they are now denouncing a paper they championed yesterday, just because it turns out to make the opposite point to what they thought.
“And the paper did *NOT* use infinite resolution, it used R and set R=1!”
Yes, becasue as they say if the sigma is greater than 1 the resolution “effectively” becomes “infinite”.
“The SEM is NOT the accuracy of the mean. It is the ACCURACY of the mean that is important, not how precisely you calculated the inaccurate mean!”
I’d love to see Tim in ancient Greece. “No Pythagoras the square of the hypotenuse does not equal the sum of the squares of the other two sides. What if you have a wonky ruler, what if the sides are not straight. Stop peddling lies.”
“You keep saying this and it’s always a garbage assertion!”
So why promote a paper that says just that?
“You can’t even get it into your head what the SEM *is*.”
A lecture on what the SEM is from someone who thinks all statisticians are wrong.
“The SEM is actually the standard deviation of the sample means.”
That’s what I think. Why are you disagreeing? It’s the standard deviation of the sampling distribution of the mean.
“For statisticians those sample means are considered to be 100% accurate and you can calculate their standard deviation.”
If a sample mean was 100% accurate, why would you need to talk about the error? The whole point is that no sample is 100% accurate, it’s a random sample from a population and the sample mean will only be an estimate of the population mean.
“In truth the sample means carry with them the propagated uncertainty from the values making up the sample distribution.”
Which is part of the SEM. If each measurement has a random uncertainty associated with it that is part of the standard deviation of the measurements. It’s the same assumption as when you measure the same thing multiple times. The measurement uncertainty contributes to the standard deviation of the measurements – and in the case of measuring the same object it will be close to 100% of the contribution.
For some reason Tim thinks this works when taking the average of a single thing, but the same rules of probability fail when measuring multiple things of different sizes.
“If your sample is is x1+/-u1, x2+/-u2, x3+/-u3, …. then the actual sample mean is the average of x1, x2, x3, …. +/- the quadrature addition of u1, u2, u3, …”
And there he goes again. Still clinging to the incorrect assumption that for some reason when averaging different things the uncertainties will not be the sum of the uncertainties. This makes zero sense, and it’s been explained to him countless times why it makes no sense and contradicts all the books he uses as reference. It’s just a religious believe with him that is incapable of any logical refutation.
“Now, what exactly is the SEM in this case?”
There’;s a simple way of testing this – run a Monte Carlo simulations. But Tim won’t do this becasue he knows what the result will be – so he”l just come up with some ridiculous reason why the simulation doesn’t represent reality.
“*YOU* wan to just throw away us1, us2, us3, etc.”
No, I’m saying the standard deviation of all your sample means is the SEM. No need to add extra uncertainty that is already in the sample means.
” It’s all random, Gaussian, and cancels, right?”
The parrot will never get this but the SEM, or the equation SEM = SD / root(N) does not depend on the distribution. It works with any distribution. It does require that the samples are random independent samples. But as always he want’s to use this condition as a get out jail of free card for simply dismissing the SEM. A systematic error in all your measurements will result in a mean that has the same systematic error. And that is true if you are adding values, or doing anything else with measurements. For some reason Tim only sees it as a problem when taking an average.
“If you know the SD then the SEM is meaningless.”
Now he’s just going into his weird phase, where words seem to have no meaning. I think this is referring to some strange believe that the purpose of the SEM is to estimate the population SD. They truly believe that in order to estimate the standard deviation, you should take multiple samples of a specific size, work out the standard deviation of all those sample means, and then multiply that by the square root of the sample size to get the population standard deviation.
In more ways than one, this is just backwards.
“And it is SD, the standard deviation of the population that determines the values that can be reasonably attributed to the measurand, not the SEM.”
Which is the final mistake. Misunderstanding what measurand we are talking about. The uncertainty of the mean is the uncertainty associated with the mean – the mean is the measurand. The standard deviation will not tell you the uncertainty of the mean, it will tell you the uncertainty of an individual value in the population. Sometimes this is a useful value to know, often it’s a better value to know than the uncertainty of the mean – but it is not the uncertainty of the mean.
“Yes, becasue as they say if the sigma is greater than 1 the resolution “effectively” becomes “infinite”.”
You don’t even understand what this means!
“I’d love to see Tim in ancient Greece. “No Pythagoras the square of the hypotenuse does not equal the sum of the squares of the other two sides. What if you have a wonky ruler, what if the sides are not straight. Stop peddling lies.””
Which only shows you simply can’t distinguish between the standard deviation of the sample means and the standard deviation of the population elements. You can’t even admit that the sample means inherit uncertainty from the elements in the each sample!
All you know is “all measurement uncertainty is random, Gaussian, and cancels.”. Everything you state follows from that assumption.
“That’s what I think. Why are you disagreeing? It’s the standard deviation of the sampling distribution of the mean.”
What does that have to do with the accuracy of the mean? The SEM of a wildly inaccurate set of data can be ZERO! While the mean of the population is wildly inaccurate! So what does a Zero SEM tell you about the accuracy of the population mean?
You are lost in the weeds and aren’t interested in getting out. You are stuck on the SEM being some kind of measure of the accuracy of the mean and you simply won’t accept *any* explanation of how wrong that is.
You won’t even accept the simple fact that the population SD is the SEM * sqrt(N). And that the SD defines the dispersion of the values that can be ascribed to the measurand – the very definition of measurement uncertainty EVERYWHERE!
Now, come back and admit that you aren’t interested in the accuracy of the mean but only in figuring out sampling error. If you can’t admit that then you are lying to yourself. As R. Feynman said: The easiest person to fool is yourself”.
lol, Bellman. You have the patience with these idiots that I used to have. Keep it up.
“There’;s a simple way of testing this – run a Monte Carlo simulations.”
Key, easy to do with any freeware on any modern laptop, with or without a special app, and the reason why the Gorman’s never will do this. It’s actually esthetically pleasing to see the statistical laws dissed by the G’s displayed right in front of you.
Expanding, it’s particularly instructive to try and falsify SD/sqrt(N) by using other worldly collections of disparate probability distributions for your data points. Yes, you can see temporary excursions from the mean as those oddball distributions are encountered, but as N increases, the truth always ends up told.
What you call “truth” is nothing more than how precisely you have calculated the mean. It tells you nothing about the accuracy of that mean. It is the ACCURACY of that mean that is of primary importance, not how precisely you calculate it.
My brother-in-law highway patrol officer stops you on a long stretch of road to give you a ticket. He tells you he took three measurements and their average is precisely 70.67mph in a 70mph zone. He’s going to round that up to 71mph and ticket you. You take it to court. What defense do you use? How precisely he calculated the mean? Or how accurate the data used to calculate it is?
What are your metrology qualifications, blob?
How much time have you spent studying the GUM?
Monte Carlo simulations require you to have a functional relationship of known factors and parameters which can be varied to give different outcomes.
What is the functional relationship you think you can analyze using Monte Carlo techniques when it comes to temperature measurements from different measurement stations in different micro-climates?
You are throwing out buzzwords you apparently have no understanding of.
bellman and bdgwx are fond of Monte Carlo simulations using made up random variables that have no physical functional relationship defined. Apparently so are you.
We used Monte Carlo techniques when I worked in Long Range Planning for a major telephone company. We knew the functional relationship we wanted to use in analyzing potential capital investment projects. The variables included things like tax rates, interest rates, labor costs, loan rates, and on and on – sometimes up to 25 or more variables. We could vary each one individually or in varying combinations. It was a valuable technique to use in comparing projects.
Why don’t you provide the functional relationship equation you would use for determining temperature and we’ll see if a Monte Carlo simulation can be done?
An MC simulation also needs reasonable estimates of the ranges over which the random variables could be expected to vary,
“Monte Carlo simulations require you to have a functional relationship of known factors and parameters which can be varied to give different outcomes.”
Yet the Gorman’s were quite happy to champion a paper on resolution uncertaint which based entirely on random variables from a normal distribution. Until they realised it said the opposite of what they claimed.
“normal distribution”
And does real world temperatures provide normal distributions?
That document was meant to show that assuming the true value is the average of a normal distribution is incorrect. It *does* show that.
And that fact just blew right over your head and bob’s head.
it’s just more proof that the SEM can NOT even be trusted to properly bracket a true value in a random, Gaussian distribution developed from a set of measurements taken of the same measurand by the same device under the same conditions.
Again, that blew right over your heads.
You two are truly indicative of why climate science loses more and more integrity in the public’s eye every single day.
“And does real world temperatures provide normal distributions?”
No. Which is why it is so instructive to see SEM’s devolve to u/sqrt(N), as N grows, using MCS, even with wild combinations of varying distributions for the data. In fact, I believe that there is a boring old statistical law that tells us why….
As an aside, mid westerners, today’s training for my upcoming masters swimming event is for ~3 hours of heavy weight bearing exercise, here at home and at the Y later. My mid day posts are a procrastination from pushups to exhaustion to start (I hate ’em). Unless you’re in a care facility, what’re your excuses for hour upon hour of repetitive posting?
Translation: “Boy am I GOOD!”
Malarky!
The SEM does NOT tell you the accuracy of the mean. If every temperature in the world was off by 1C your SEM could be just as small as if every temperature was dead on. BUT THE AVERAGE VALUE WOULD STILL BE INACCURATE!
It’s a damn good thing you aren’t designing parts to go in a space vehicle!
The SEM is a statistical descriptor of the population. It is *NOT* a measuand of anything.
There is *NOT* a statistical law that tells you that the SEM can make the mean 100% accurate no matter how large your sample size is, even for a Gaussian distribution. Bevington even goes into this in detail in his book
What you are referencing is the CLT and LLN. They say that if you take enough samples of a population that the means of those samples will form a Gaussian distribution. That’s NOT* the distribution of the population! It’s a metric for the sampling error and that is all it is.
Remember, if you have only ONE SAMPLE, the CLT and LLN doesn’t even apply! You can’t form a distribution of sample means from ONE SAMPLE!
You have a perfect description of what the SEM describes, that is, the interval within which the ESTIMATED mean lays. That interval DOES NOT describe the dispersion of the values that can be attributed to the measurand.
You need to find a GUM reference that describes the uncertainty as the SEM.
“You have a perfect description of what the SEM describes, that is, the interval within which the ESTIMATED mean lays.”
That’s not what the SEM describes. It describes the standard deviation of the sampling distribution. You can use it to make a confidence interval, but then you need to know the shape of the sampling distribution. Fortunately, due to the CLT this is likely to be approximately normal for large enough sample sizes.
“That interval DOES NOT describe the dispersion of the values that can be attributed to the measurand.”
Again, this vague definition causes so many problems. You really need to look at likelihood estimates, or Bayesian statistics to correctly define what is meant by the dispersion of values the measurand could be, but the GUM seems to hedge it’s bets and never defines it’s terms properly.
“You need to find a GUM reference that describes the uncertainty as the SEM.”
4.2.3, though they rename it as the experimental standard deviation of the mean.
Or, if you don;t like that, you could provide the reference where they say the uncertainty of the mean of different things is equal to the uncertainty of their sum. Or that the standard deviation increases with sample size. Or just accept that the GUM isn’t a statistical course, and is mainly about finding the uncertainty of things in a laboratory.
“ Fortunately, due to the CLT this is likely to be approximately normal for large enough sample sizes.”
The CLT does *NOT* make any specific sample into a normal one no matter what size it is. It makes the means of MULTIPLE samples a normal distribution. A single sample had better give you the same kind of distribution as the population or your analysis is screwed up.
You can’t even get this one correct. Wow!
“Again, this vague definition causes so many problems.”
You are being willfully ignorant. It is *NOT* vague. The GUM spends a significant amount of time on defining it.
…………………………………………………
JCGM 100:2008:
“2.2.3 The formal definition of the term “uncertainty of measurement” developed for use in this Guide and in the VIM [6] (VIM:1993, definition 3.9) is as follows: uncertainty (of measurement) parameter, associated with the result of a measurement, that characterizes the dispersion of the values that could reasonably be attributed to the measurand”
“2.2.4 The definition of uncertainty of measurement given in 2.2.3 is an operational one that focuses on the measurement result and its evaluated uncertainty. However, it is not inconsistent with other concepts of uncertainty of measurement, such as
⎯ a measure of the possible error in the estimated value of the measurand as provided by the result of a measurement;
⎯ an estimate characterizing the range of values within which the true value of a measurand lies (VIM:1984, definition 3.09).
Although these two traditional concepts are valid as ideals, they focus on unknowable quantities: the “error” of the result of a measurement and the “true value” of the measurand (in contrast to its estimated value),
respectively. Nevertheless, whichever concept of uncertainty is adopted, an uncertainty component is always evaluated using the same data and related information. (See also E.5.)”
………………………………………………………….
The SEM *ONLY* defines an interval in which the mean of the sample means gives. It is a measure of sampling error and helps locating the mean of the population. IT DOES NOT TELL YOU THE DISPERSION OF THE VALUES THAT COULD REASONABLY BE ATTRIBUTED TO THE MEASURAND.
You are stuck trying to define the mean as the TRUE VALUE and the SEM as the best estimate of the mean. Yet the GUM states “Although these two traditional concepts are valid as ideals, they focus on unknowable quantities: the “error” of the result of a measurement and the “true value” of the measurand (in contrast to its estimated value), respectively. ”
Have you written out “UNCERTAINTY IS NOT ERROR” one thousand times yet?
Uncertainty is a way to describe the GREAT UNKNOWN. It does *not* specify the error of a measurement.
“The CLT does *NOT* make any specific sample into a normal one no matter what size it is.”
It says the sampling distribution will tend to a normal distribution. That’s exactly what I said
This is a classic example of the bad faith arguments that keep being used here. Tak a sentence out of context, claim it’s saying something different and finishing up with some variation of “OMG! Why can’t you get anything right!!!!”
“but the GUM seems to hedge it’s bets and never defines it’s terms properly.”
That’s not a fault of the GUM. It’s because of your lack of reading comprehension skills and your inability to understand that uncertainty is not the same thing as error.
Have you written out “UNCERTAINTY IS NOT ERROR” one thousand times yet?
“Or, if you don;t like that, you could provide the reference where they say the uncertainty of the mean of different things is equal to the uncertainty of their sum. Or that the standard deviation increases with sample size.”
It’s all in Eq 10 of JCGM 100:2008
u_c(y)^2 = Σ (∂f/∂x_i)^2 u(x_i)^2 from 1 to N
As N grows the number of terms in the sum grows – meaning u_c(y)^2 grows as well.
It’s in the formula SD = SEM * sqrt(N)
See the attached graph. Both curves have the same average. Which curve has the largest variance, the one with a smaller range or the one with the larger range? Range is a direct factor for variance. And variance is a measure of uncertainty. As you add MEASUREMENTS OF DIFFERENT things into the distribution the range *will* grow. Leading to an increase in the variance. Leading to an increase in the uncertainty – i.e. the possible values reasonably attributable to the measurands.
(note carefully the use of the plural – MEASURANDS)
Every single temperature used in a temperature data set is a separate measurand. Thus multiple MEASURANDS.
Really! I could explain this to a six year old and they would understand. Yet you, bob, bdgwx, nick, etc can’t. Why is that? Willful ignorance? Religious faith? What?
forgot the graph
Again, it’s the paper you insisted I read. As so often you pull one sentence out of context, insist that the paper proves you point, and then attack me for agreeing with the paper when you realize it says the opposite of what you claimed.
If you want to know what happens when the distribution is not normal, do the work yourself. I’ve no idea why you would think the resolution issue will be different if the distribution is not normal, I’ve demonstrated any number of times why the distribution doesn’t matter. But if you think you can prove otherwise, then do it.
“That document was meant to show that assuming the true value is the average of a normal distribution is incorrect.”
Now you are just making stuff up. Still an exact quote with context should clear that up.
To be clear the document I’m talking about is this
https://www.ncbi.nlm.nih.gov/pmc/articles/PMC4654598/
The resolution issue *is* the same for non-normal distributions. It is also true for normal distributions.
You keep avoiding the conclusion of the paper. It’s what Bevington said clear back in 1969! You can only drive the SEM so far by increasing sample size. That’s what the example in the paper proves.
Why you can look something plain as day right in the eye and ignore it is beyond me.
“Hence all of the measurements used in the uncertainty evaluation to determine s (based on a large sample of measurements) will depend on the particular value of μRef, and different values of μRef will yield different values of s; see Fig. 2b. Note that the best estimate of the reference artifact, xbar_Ref, is discarded since it provides no information about the value of the future measurement result.”
It simply doesn’t matter how Gaussian your measurements are, the average you calculate will be contaminated by an uncertain uRef.
“Most metrologists expect approximately 95 % of the potential measurement errors to be contained in the expanded (k = 2) uncertainty interval. However, even for the infinite resolution case of a Gaussian population, 95 % is the expected fraction of error containment, and any finite sample size will have slightly more, or slightly less, than 95 % of the deviations from the mean contained within 2 s.” (bolding mine, tpg)
Does this mean NOTHING to you?
They are talking about the values that can be attributed to the mean. That is 2s of the population, not the SEM.
And if any finite sample size will have slightly more, or slightly less then the SEM will also suffer the same, regardless of the sample size. You simply can’t substitute the SEM for the standard deviation of the population.
Again, it’s exactly what Bevington said in 1969.
STOP CHERRY PICKING!
“Why you can look something plain as day right in the eye and ignore it is beyond me.”
What bit of rule 3 didn’t you understand.
That’s you never see Monte Carlo runs used in climate science. Part of the problem with MC is that the data you use is not certain. One has to assume the input data is 190% accurate or have standard uncertainties to use. One only has to read TN 1900 examples to see how probability distribution functions and/or standard uncertainties are needed in the MC simulations in NIST’s error calculator.
Temperature is a continuous function with so many confounding variables it is difficult to get a correct answer.
It won’t work of course. I’ve tried it many time, along with real world examples. They have to many cognitive biases to actually accept something that suggests they might be wrong.
What is wrong is refusing to accept that no matter how precisely you calculate the average it tells you NOTHING about the accuracy of that average.
You and bob just refuse to accept that reality.
Apart from all the times I’ve told you I accept it. Of course if your measurements are not true, then your average will not be true. Same as your sum will not be true, same as your standard deviation will not be true, same as any measurement will not be true.
What you’ve never explained is why you think substituting the uncertainty of the sum helps get rid of these inaccuracies.
It doesn’t get rid of them – it SUMS them! It’s why every measurement should include a piece of Type B uncertainty in its total uncertainty.
Calibration drift is a systematic and UNKNOWN uncertainty in every field instrument. Since it’s unknown you can’t subtract it out. But you can put a value in the uncertainty interval for it using a Type B uncertainty.
YOU and your compatriots just want to ignore things like calibration drift by assuming the stated values are 100% accurate and seeing how precisely you can calculate the average of those assumed 100% accurate values. The precision of your calculation becomes you measurement uncertainty.
I’ll repeat it one more time. This stems from always assuming that measurement uncertainty is random, Gaussian, and cancels. Thus the SEM can be used as the measurement uncertainty.
The problem is that measurements of multiple things a single time using different devices simply won’t develop a random, Gaussian distribution. That’s a problem for climate science (and statisticians) so they just assume it away like Possolo did in TN1900!
Meaning you have absolutely NO idea what the real measurement uncertainty of the GAT is – none at all.
All your info is ok but not applicable.
Let’s look at what the special test scenario is.
This does not apply to temperature measurements because repeated measurements of the same thing.
Now how about the measurement scenario.
This is typical of commercial metrology where a large number of nearly identical artifacts or workpieces are produced and only a single measurement, having finite resolution, is recorded.
Does this sound like a monthly average? It does to me. What does the conclusion say.
Lastly, in the conclusion the following is stated.
And, let’s not forget that the resolution uncertainty is only one factor to include in U(c).
And that the GUM F.2.2.1, shows that thermometers read to nearest integer, i.e., a value of 1, have a resolution component of
uncertainty of u = 0.29°.
Gets worse and worse doesn’t it? Assuming a resolution of 0.1° would add 0.09 to the 0.872° uncertainty from TN 1900 raising the expanded uncertainty to ±2.0. I would say that isn’t a negligible amount.
“All your info is ok but not applicable.”
You were the one claiming it was applicable. If you don;t think it is why insist I read it?
“Typically this will involve repeated observations of the quantity, each recorded with finite resolution. The best estimate of the measurand is considered to be the mean of the repeated observations“
And we are back to the question of whether you think an average of different temperatures is a measurable quantity.
“This does not apply to temperature measurements because repeated measurements of the same thing.”
Yet you accept the idea of daily values being measurements of the monthly average, e.g. TN1900.
Everything you two say seems top become a case of pleading exceptions. What you never do is accept the maths for what it is. You can;t accept that if a theory works describes one case it also describes other cases. If an argument based on assuming measurements of the same thing with a sufficiently large standard deviation will not be restricted by resolution, it will also apply in the case of averaging different things with a sufficiently large standard deviation.
“Does this sound like a monthly average? It does to me.”
Really? You think a global average is based on a single measurement?
”
You really think this scenario is more applicable to a global average than the special case:
And if so, why did you start by quoting from section 7, and insisting I read that section?
“Yet you accept the idea of daily values being measurements of the monthly average, e.g. TN1900.”
You can’t even enumerate the ASSUMPTIONS that went into TN1900, can you?
TN1900 was a TEACHING EXAMPLE. Just like all the examples in your statistics textbooks that do not give data values as “stated value +/- uncertainty”. As teaching examples they make assumptions that are not valid in the real world! And you can’t seem to get that into your head!
“Everything you two say seems top become a case of pleading exceptions.”
As opposed to you who thinks all data is random and Gaussian so that random error cancels?
“You can;t accept that if a theory works describes one case it also describes other cases.”
Unfreaking believable! Not all data is random and Gaussian! Theories that work with data that is random and Gaussian do *NOT* describe cases that are *not* random and Gaussian!
“If an argument based on assuming measurements of the same thing with a sufficiently large standard deviation will not be restricted by resolution, it will also apply in the case of averaging different things with a sufficiently large standard deviation.”
NO! NO! NO!
Standard deviation doesn’t even apply to non-random, non-Gaussian distributions like temperature!
From “The Active Practice of Statistics” by Dr. Moore.
“The five-number summary is usually better than the mean and standard deviation for describing a skewed distribution or a distribution with strong outliers. Use y_bar and s only for reasonably symmetric distributions that are free of outliers.” (bolding mine, tpg)
Climate science doesn’t eve USE standard deviation/variance. They ignore it. Even if temperature data *was* reasonably symmetric and free of outliers they don’t use a full description of the data!
While Dr. Moore doesn’t directly address multi-modal distributions they can be considered to be a skewed distribution with STRONG outliers!
“Really? You think a global average is based on a single measurement?”
It’s based on the median value of a multi-modal distribution. In other words it is garbage from the word go and doesn’t get better by averaging. Averaging garbage give you garbage.
“in this paper we take R = 1, hence x must be an integer.”
Your lack of reading comprehension skills is showing again! If x must be an integer then the average of multiple x’s should be an integer as well!
“In the measurement process scenario an uncertainty evaluation is performed on a measurement system and then a future (single observation) measurement result, x, which represents the best estimate of the measurand is assigned an uncertainty based on the prior evaluation. “
You can’t even comprehend what this is telling you!
Like this, of which none of them will even try to think about the implications:
Your lack of reading comprehension skills are showing again.
from the reference: “first decimal place”
It’s *NOT* the first digit. If’s the first DECOMAL PLACE!
This guy is such a dunderhead, he will never be able to grasp these very basic concepts.
You obviously don’t recognize how ignorant you appear with these statements. You should take a moment and consider your lack of knowledge in making measurements before you confirm what everyone knows about your lack of education.
ROFLMAO.. So let’s take them all to nearest degree..
Warming disappears completely !!,
That’s how little warming there has been !
Your understanding of mathematics is “extremely poor” at best !!
averaging cannot increase resolution. The final resolution of an average is determined by the individual element with the worst resolution. Using temperature data from the turn of the century or before means you get a resolution of 1C at best. Averaging can’t fix that. It means that any “anomalies” you see are nothing more than fantasies, similar to what a carnival fortune teller see’s in their cloudy crystal ball.
Even using today’s best devices gives you a resolution in the tenths of a degree, not in the hundredths of a degree. The issue is that the resolution can’t be better than the measurement uncertainty. Once again, pushing an average is nothing more than saying “my cloudy crystal ball says x”.
UAH claims ±0.2°C temperature uncertainty, then reports averages to the hundredth of a degree.
It’s like NO ONE (except Pat Frank) in climate science understands measurements at all. As someone else on here has pointed out (Walter?), the natural variation in weather and microclimate is larger than the hundredths digit. And the natural variation and microclimate are *NOT* random noise that can be assumed to cancel out over time. Climate science even averages NH and SH temps together with no regard to the individual variances or the variance of the combined data!
UAH completely disregards all the variances and distributions in their averaging.
And in relative uncertainty, 0.2K for a 250K measurement is ±0.08%! This is way beyond what absolute cavity radiometers are capable of.
If any of them had real-world metrology experience, they would understand this.
People who fail to comprehend this likely do so out of a deliberate choice – could it be driven by their ego? Is there an underlying agenda at play? Why do they steadfastly support such flawed methodical practices? Even a six-year old could grasp the flaw if explained to properly.
Money or religious belief. It’s *always* one or the other with those telling others how they should live.
At least several of these persons are Nick Stokes groupies—why they would pay heed to Stokes’ propaganda I have no idea, but they are all-in for the IPCC pseudoscience.
Wasn’t there an adjustment in version 5.6 between 5.2 and 6.0?
You may right. I’ll research that when I get time. Thanks for heads up on that.
I did a bit of research. My table above excludes version 5.3, 5.4, 5.5, and 5.6. The reason is because I could not find peer reviewed literature documenting the changes. However, Dr. Spencer has left the readme file documenting the changes on his site here. Most of the changes (and adjustments) are satellite specific. However, the change in 5.3 is interesting since it affected how the interannual cycle is handled. Some of the monthly anomalies got changed by 0.1 C on the update!
Basically the same changes that NOAA made to their STAR satellite data. Both UAH and STAR pretty much have the same information now which leaves RSS out in the cold.
These are scientific adjustments for known issues
Unlike the surface data which only does random agenda-driven adjustments for fantasy issues, and doesn’t adjust at all for the known issues of bad siting, urban warming, airports etc etc etc
Sad you are incapable of telling the difference.
They are recognized systematic corrections for known biases. It’s funny how you folks are adamant about how homogenization and other “corrections” make surface temperatures much more “accurate”, but God forbid that satellite folks can do the same.
Here’s another study about UAH and comparisons with other temperature databases.
https://www.researchgate.net/publication/323644914_Examination_of_space-based_bulk_atmospheric_temperatures_used_in_climate_research
Examination of space-based bulk atmospheric temperatures used in climate research
“4.4. General remarks
When examining all of the evidence presented here, i.e. the correlations, magnitude of errors and trend comparisons, the general conclusion is that UAH data tend to agree with (a) both unadjusted and adjusted IGRA radiosondes, (b) independently homogenized radiosonde datasets and (c) Reanalyses at a higher level, sometimes significantly so, than the other three. We have presented evidence however that suggests UAH’s global trend is about 0.02°C decade
−1 less positive than actual. NOAA and UW tended to show lower correlations and larger differences than UAH and RSS –indeed UAH and RSS generally displayed similarly high levels of statistical agreement with the radiosonde
datasets except that UAH was usually in closer agreement regarding trends. UW tended to display the lowest levels of agreement with unadjusted and adjusted radiosondes (e.g. Figure 13) while NOAA displayed a peculiarity in that low latitude trends over the ocean were much more positive than the other datasets. We have presented evidence that strongly suggests the satellite data during the 1990s contains spurious warming of unknown origin, revealing itself least in UAH data due to its intersatellite trend-adjusment process.
Summary
We performed this intercomparison study so as to document differences among the four microwave satellite temperature datasets of the bulk atmospheric layer known as TMT.
While all datasets indicated high levels of agreement with independent data, UAH and RSS tended, in broad terms, to exhibit higher levels of agreement than NOAA and UW. This conclusion does not apply however to the test-statistic of the trend where UAH tended to agree most closely with independent datasets.
One key result here is that substantial evidence exists to show that the processed data from NOAA-12 and −14 (operating in the 1990s) were affected by spurious warming that impacted the four datasets, with UAH the least affected due to its unique merging process. RSS, NOAA and UW show considerably more warming in this period than UAH and more than the US VIZ and Australian radiosondes for the period in which the radiosonde instrumentation did not change. Additionally the same discrepancy was found relative to the composite of all of the radiosondes in the IGRA database, both global and low-latitude.
While not definitive, the evidence does support the hypothesis that the processed satellite data of NOAA-12 and −14 are characterized by spurious warming, thus introducing spuriously positive trends in the satellite records. Comparisons with other, independently-constructed datasets (radiosonde and reanalyses) support this hypothesis (Figure 10). Given this result, we estimate the global TMT trend is +0.10 ± 0.03°C decade −1.
The rate of observed warming since 1979 for the tropical atmospheric TMT layer, which we calculate also as +0.10 ± 0.03°C decade −1, is significantly less than the average of that generated by the IPCC AR5 climate model simulations. Because the model trends are on average highly significantly more positive and with a pattern in which their warmest feature appears in the latent-heat release region of the atmosphere, we would hypothesize that a misrepresentation of the basic model physics of the tropical hydrologic cycle (i.e. water vapour, precipitation physics and cloud feedbacks) is a likely candidate.”
end excerpt
And the reason the RSS satellite reads differently from the UAH satellite is RSS uses satellite data that was “spuriously warm” according to Roy Spencer. Roy eliminated this data from UAH. The same spuriously warm data that NASA and NOAA use to jack up the surface temperatures.
Tom, did you read the part about S&C adjusting the radiosonde data to match the satellite data? What did you think about that part?
Like an “average” cloud cover for the globe!
So if there was increase in the rate of which the atmosphere transported heat through the atmosphere then the satelllite instruments would pick this up as warming.
No. The transport of heat only moves it around. The global average remains the same assuming negligible enthalpy changes that is. What the satellites will pick is the heat transfer from the land and/or ocean like what happens during El Nino or the transfer of heat from the atmosphere to space, land, and ocean like what happens during La Nina.
So that’s exactly what am saying.
Any increase in the transport of heat from surface to space would be picked up by the satellites instruments as warming.
Yes and no. The MSUs don’t actually see the surface radiation so it would only pick up heat transfer to/from the surface if no other transfer are happening which is unlikely. Remember, it’s only measuring the temperature over a deep layer of the atmosphere.
The transfer of heat from the lower atmosphere to the upper atmosphere is what am talking about here. A increase in windshear within the layers of the atmosphere increases the rate at which the atmosphere can transport this heat to space.
As windshear has the effect of spreading this heat over a larger suface area as it moves up through the atmosphere and so losing its heat to the upper atmosphere more quickly. This increased heat transport is what the satellites are picking up as warming.
The satellites aren’t measuring heat transport though. They are measuring microwave emissions and mapping those into temperatures.
Enthalpy changes you say.
I should have been more clear. I’m talking about the enthalpy of fusion and vaporization…changes in the phases of matter.
This is why climate science *SHOULD* be using enthalpy instead of temperature as a metric. The data to do so has been available for 40 years or longer.
We *could* have had a 40 year long record of enthalpy if climate science wasn’t so tied to using mis-adjusted, mal-adjusted, incoherent “adjustments” to the temp record.
Thinks El Nino is the opposite action to La Nina…. hilarious.
You know nothing about heat! First, H2O contains latent heat which is hidden from measurement by temperature. Secondly, temperature alone is a poor proxy for heat. The quantity “Q” is dependent on variables like mass, specific heat, and temperature.
I should point out that NASA has updated their STARS satellite data and it pretty much agrees with UAH. Too bad for you!
None. Satellites do not use LiGs.
However, if you are referring to traditional surface records then [Hubbard & Lin 2006] is a good place to start your research.
So far my study is suggesting that when the sun shines digital thermometers are effected by it to a greater amount then glass thermometer.
Can you post a link to a reference so that we can review it?
Who are “we”?
Anybody. It’s better to share knowledge and data so that it can be scrutinised.
Temperature error‐correction method for surface air temperature data – Yang – 2020 – Meteorological Applications – Wiley Online Library
I’ll include the following.
Oh no, it can’t be this large.
Not according to climate science? According to climate science there is either no error or it is “adjusted” away!
Ag science measures soil temps. Why doesn’t climate science use that data to get “surface” temperatures?
Surely you aren’t using either type of thermometer in direct sunlight?
Each station exists in a unique microclimate. That microclimate has an impact on the temperature reading of the station. That’s true even for an aspirated enclosure in the shade. It’s why something like the GAT has so much in-built measurement uncertainty.
The issue here is that often the weather station itself is placed in direct sunlight and the digital thermometer looks to more prone to been effect by this then glass thermometers. Because as l understand it digital thermometers use solar power fan to blow air across the thermometer during sunshine. What if this does not fully offsetting the effects of the warming.
Here are three documents that address this issue.
https://www.researchgate.net/publication/252980478_Air_Temperature_Comparison_between_the_MMTS_and_the_USCRN_Temperature_Systems
https://rmets.onlinelibrary.wiley.com/doi/full/10.1002/met.1972
https://www.bing.com/ck/a?!&&p=820960a7fc4287feJmltdHM9MTcwNDI0MDAwMCZpZ3VpZD0xOTcwYjQ2Ny1jNjU2LTY2ZGQtMjA4NC1hNzNjYzdhNzY3NGMmaW5zaWQ9NTI2MQ&ptn=3&ver=2&hsh=3&fclid=1970b467-c656-66dd-2084-a73cc7a7674c&psq=mmts+versus+lig&u=a1aHR0cHM6Ly9hbXMuY29uZmV4LmNvbS9hbXMvcGRmcGFwZXJzLzkxNjEzLnBkZg&ntb=1
Two big takeaways from these. One, each station must be evaluated uniquely to obtain proper correction curves. Two, there are hig uncertainties with simple readings obtained from stations, regardless of their types.
The second link says’
2.84°C is a large error value that appears to be the result of the shield alone. It doesn’t account for other systematic errors.
Here’s what satellites use to measure temperatures:
https://www.researchgate.net/publication/323644914_Examination_of_space-based_bulk_atmospheric_temperatures_used_in_climate_research
“Since late 1978, the United States included microwave sounding units (MSUs) on board their polar-orbiting operational weather observation satellites. With the launch of the National Oceanic and Atmospheric Administration’s NOAA-15 spacecraft in 1998, a new instrument, the Advanced MSU (AMSU) began service that has continued to be placed into orbit by succeeding U.S. NOAA and National Aeronautics Space Administration (NASA) missions as well as those of the European Space Agency. For the layer discussed here (roughly the surface to 70 hPa), the radiometer on the MSU channel 2 and AMSU channel 5 measures the intensity of emissions, which is directly proportional to temperature, from atmospheric oxygen near the 53.7 GHz band (Spencer and Christy 1990).”
Or the switch from actual temperatures to anomalies above or below the mean, which doesn’t get mentioned as an actial figure very often.
Switching the baseline has no effect on the warming trend. Here is the UAH data in absolute terms which shows the same +0.14 C/decade trend.
Plot this in °C…
Trying to hide the FACT that the warming only occurs at El Ninos.
Dearie me. !
Taxed,
Want to swap notes on this instrument change? I am at outlook.com
Just use my WUWT user name. My studies are for Australia. Geoff S
You might want to read these articles on that very topic
https://wattsupwiththat.com/2023/06/29/the-verdict-of-instrumental-methods/
https://wattsupwiththat.com/2011/01/22/the-metrology-of-thermometers/
https://wattsupwiththat.com/2011/01/20/surface-temperature-uncertainty-quantified/
Here is a stacked graph of the monthly UAH temperatures. The top of each rectangle represents the temperature in that month of the year of corresponding color, You can see how the last six months of 2023 dominate.
Looks like a paint store sample display.
That’s the palette for an asylum.
My printer had a malfunction this morning and all I got were pages that looked just like Nick’s.
I was so plssed off.
Printer ink cartridges cost a motza these days.
Look into getting an Epson Ecotank.
UAH “temperatures”
It’s as if they don’t know that the warming could be solely due to the draw of the baseline averages themselves.
You deserve more upvotes than I can give for that reply. What is this ‘1991-2020 mean temperature’ figure? It’s not mentioned in the article
Fairy dust :-D.
263.19 K for December.
The “warming” is due to the bastardization of the surface temperature record.
The temperature data mannipulators disappeared the warming before 1979 in the global temperature record.
If the warming before 1979 was included, then it would be obvious that there has been little or no warming since the initial warming after the Little Ice Age ended that took place to the 1880’s, then there was a cooling period from the 1880’s to the 1910’s, and then there was another warming period from the 1910’s to the 1940’s, a warming equivalent to the warming of the 1880’s, and then there was a cooling period from the 1940’s to the 1980’s, a cooling period equal to the cooling of the 1910’s, and then from 1980 there has been another warming period up to the present day, which is no warmer than the temperature highpoints in the 1880’s and the 1930’s.
In fact, the United States has been in a temperature downtrend since the 1930’s. Documented. It was warmer in the United States in 1934 than it is today, including any Hunga Tonga influences. The year 1934 is still 0.2C warmer than Hunga Tonga.
Here’s the U.S. chart that shows the temperature trendline (before NASA and NOAA got serious about bastardizing the temperature record).
Hansen 1999:
The warming we have today is no different than the warming we have had in the past. Without a bastardized temperature record, the climate change alarmists would have nothing scary to point to when it comes to the Earth’s climate.
It’s all a BIG LIE.
There’s no evidence CO2 is overheating the Earth’s atmosphere. There is more CO2 in the atmosphere today, but it is no warmer today than in the recent past.
Climate alarmists can only lie about the past becaue the past does not support their climate change scaremongering.
And here’s Tom graph updated to include after 2k.
The world was dumping large amounts of CO2 into the atmosphere long before the significant uptrend began in the 1990’s, much of it due to industrialization and population growth worldwide. Why the sudden surge after 1990?
An unbiased observer would ask why the sudden surge happened. Was it a change in the data collection protocols? Was it a change in the analysis protocols? Was there an adjustment made to the data somewhere? Did the growth in CO2 injection suddenly surge? If there was a surge in CO2 how much was human caused? Did other external factors change significantly?
“The world was dumping large amounts of CO2 into the atmosphere long before the significant uptrend began in the 1990’s, much of it due to industrialization and population growth worldwide. Why the sudden surge after 1990?An unbiased observer would ask why the sudden surge happened. Was it a change in the data collection protocols?”
That is a common “gotcha” question by climate science deniers, but really only illustrates their lack of critical thinking. In my world it is easily answered if you accept that CO2 is not the only driver of climate… which it is not. Upsurges (and downsurges) are to be expected in a complex system. It is the long term trend that matters.
If it’s not the only driver then what caused the surge? You conveniently forgot to answer that!
The period from 1900 through 1970 saw an unparalleled growth in industrialization. This includes the world-wide mobilization associated with WWI and WWII. Rebuilding after WWII saw Europe rebuilding, Japan rebuilding, and the entire world increasing their use of oil to fuel the rebuilding.
And yet, your only answer is that CO2 growth didn’t happen until after 1990.
What a joke!
The UN has enslaved his brain.
Ahh it’s the proud boys pimp. Nice to see you…..
Why do you read WUWT?
I like to see know how people in all walks of life think. And I think it is important to call out misinformation wen I see it. If you are referring to my comment above….. That person has more than once referenced a site that openly supports the racist fascist group the proud boys. Your turn…..Why do you?
LIAR.
Be specific old boy. When did I lie?
But I also like to get a balanced view of things…….No point in only reading one side of an argument.
More lies.
I come here to learn and engage; its fun. I used to be a casual reader and wanted a ‘balanced view.’ But it turns out climate science isn’t so settled; the more I learn, the more I realize that. For starters, it badly lacks knowledge in meteorology. I’ll give you the benefit of the doubt and assume you’re just searching the wrong sources, and that’s why you think this website is spreading ‘misinformation’; don’t get your information from denizens on X.
Maybe start here instead:
https://wattsupwiththat.com/2024/01/03/uah-global-temperature-update-for-december-2023-0-83-deg-c/#comment-3841760
Slimon is a communist from the Peoples’ Republic of New Zealand who thinks the virus lockdowns were a great idea. He’s pushes climate alarmism because its a convenient tool for the revolution. He’s also a legend in his own mind.
He ain’t too bright.
“Slimon is a communist from the Peoples’ Republic of New Zealand who thinks the virus lockdowns were a great idea.”
So I am not a communist. I am very much centrist (slightly left) in my politics.
And… NZ is not communist either. But Karlomonte is right, I absolutely supported the actions the then government took to keep the country safe. They followed the science and well it is difficult to argue they got it wrong when NZ was one of only four countries on that planet that had a higher average age after the pandemic than before it. The US on the otherhand under Trump, was a complete and total disaster. A more inept response could not have been undertaken… and the end result was one of the highest death rates in the western world.
Living in Utah, I can tell you that the disaster hit hardest in metropolitan areas under Democrat rule. New York City took the brunt of it; everywhere else, not so much. The high death rate is blamed on the virus lingering for years and the U.S. grappling with an obesity epidemic, which no administration could miraculously fix. Thanks to our laws favoring limited government, the president can’t just issue sweeping lockdowns or mandates. Despite not aligning with any party, there’s this rumor blaming Donald Trump for the virus havoc – a tough case to swallow. He did what he could, even launching Operation Warp Speed for the fastest vaccine arrival.
Didn’t Jacinda Ardern step down over her pandemic handling?
China is a shining example of why lockdowns were ultimately futile. Three years of hyper-caution, locking down at the hint of any spread, and in Dec 2022, colossal wave hit, and millions died.
“Didn’t Jacinda Ardern step down over her pandemic handling?”
Absolutely not. She did not want to go into a third term, so retired to give time for a new person to step up. Her handling was exceptional and was held up as an example of how to do it the world over. She was calm, decisive and above all else followed the advice her medical/science advisors gave her.
Being a global model is a tall order for a country with a population much smaller than most. Geography adds another layer, considering its an island.
Yes NZ had the added advantage of isolation… which just reinforces that isolating was a good idea during a pandemic.
So are you saying the vaccine was a good thing? I’m just curious. I mean, I give Trump credit for operation WS, but not many do on the right.
I certainly do. The older population and health care professionals were in greater need of protection. I personally knew a doctor who lost her life to the disease. I received two doses myself, and it restored a sense of normalcy to my life. While a substantial part of my high school experience was taken away, the fact that I, along with about 94% of my classmates, got vaccinated meant I could experience a fully normal senior year. To this, I haven’t encountered any adverse effects, and I feel totally healthy. Totally worth it.
Thats awesome. Yep Trump got tat right.
Have you figured out the chemical formula of bleach yet, TDS-boi?
Thx for the reminder…
Still posting hypocrite? You claimed to be working out…
Either way you cut it, what Trump said there was monumentally stupid. Why didn’t he just STFU and let the experts talk? Oh I know, because he is an Olympic level clown who thinks he is clever, but is really only credible to the gullible.
The one monumentally stupid here is you, TDS-boi.
You pals in the fake news accused him of telling people to drink bleach, and you bought into the lie.
That you still buy into the fake news lies points to how stupid you are.
How did that Alfa Bank hoax work out for you, TDS-boi?
I was. 2 hours in the basement. Eati a peanut butter apple while checking this fascinating exchange. Then, to the Y. Now, checking again before my hour on my home recumbent X bike.
Nope, no delusions of grandeur, and if you saw how few push ups get me to “exhaustion” you would see why.. Just a 72 year old man who will be meeting his high school class/swim team mate, retired Lt. General Mark Hertling for beers later this month, for the first time since graduation. Mark, in addition to commanding US forces Europe and armored combat divisions, is a fitness geek with an MS in exercise kinesiology. His last job was responsibility for all army fitness. So, I’d rather not be entirely out of his league..
FYI, you’d be dissing him as a commie.
Ask me if I care, blob.
Apparently you do…
https://wattsupwiththat.com/2024/01/03/uah-global-temperature-update-for-december-2023-0-83-deg-c/#comment-3843874
Go wave your dick somewhere else, not interested.
And I don’t open kook vids as a matter of policy.
“And I don’t open kook vids as a matter of policy.”
But you read the vile spewing, proud boy supporting, extremist Gateway Pundit. Ohhhh the irony…..
I have, but I had to ask Donald coz he had the global supply.
WTF is wrong with you people?
Slimon—the Adam Schiff of WUWT.
Karlomonte the blind eel of WUWT
https://www.stuff.co.nz/dominion-post/editors-picks/5869148/Snot-eel-defence-method-revealed
This slimon clown is so stupid he still believes the Russian collusion lies.
As a matter of interest, what were the other 3?
I think the Balkan Peninsula countries will be disappointed to find they aren’t part of the western world.
One was Sweden, which did not impose any sort of lock-down.
I think the others might have been South Korea and Norway.
Nope it wasn’t. You are making that up.
But what were they?
I noticed he downvoted my comment.
I don’t think I did.
Just checked… nope not me.
Climate science starts off with the median value of a multi-modal distribution while ignoring standard deviation and build on it! At every step the meaning of the median loses another bit of credibility. Never a variance or standard deviation of the data at any level of averaging. NONE.
Garbage in, garbage out. It applies to climate science as it is done today as well as for computer programming!
Exactly, those numbers are completely useless; they offer no physical representation to the world whatsoever. And that goes for other averaging indices right? Like OHC?
One of the biggest problems with OHC is the lack of measuring points, both geographically and by depth. Lots and lots of homogenizing, infilling, and assumptions.
OHC is not an average.
Bdgwx is a monkey.
They all believe that measurement error is random, Gaussian, and cancels. It’s the only way they can justify the SEM as a metric for uncertainty of the average.
They simply don’t live in the real world. They live in statistical world where any assumption, be in implicit or explicit, is perfectly justified.
It’s like they’ve never left their house before to experience weather.
I’ll assure I’m as human as it gets. But even if I wasn’t OHC still isn’t an average. It’s the total amount of energy that got stored in the ocean. The units are joules.
Ok so I didn’t know. Now can you stop trolling?
Thanks for reinforcing my evaluation, Slimon.
Dolt.
Looks different to this from NOAA.
That isn’t from NOAA. It is from some nameless charlatans, with no information about methods.
Here is the corresponding NOAA plot
Oh look a pretty picture from a slef-named charleton. !
Which finger paints did you use, NIck.?
Did your 5-year-old grand-daughter help you ?
It’s NOAA’s data, exactly like yours is. Now why would they be charlatans but not you?
Poor Nick, reduced to making pretty pictures.
So sad.
Nick, we can all see the effect of the current El Nino on the UAH data.
Who are you trying to impress with your pointless graphic, your 5-year-old grand-daughter ?
Thank you for this excellent visualization Nick.
/Jan
Not unexpected this month, but still quote remarkable.
The warmest December, by 0.39C. That means, the last 6 months have all been records – and all by some margin.
The average over the last 6 months has been 0.82C, beating the previous Jul – Dec record, set in 2019, by 0.46C.
The big question is how long will this continue. ENSO conditions are still far below 1998 and 2016 levels, and this current heat is happening much sooner than would be expected in a usual El Nino cycle. So will things get much hotter next year, or does it mean that most of the heat has already been released?
The culprit is water vapor and aerosols ejected into the stratosphere and mesosphere by the undersea HTHH eruption. Those compounds are liable to stay aloft quite a while, but might already be diminishing. They’re largely in the SH, if not entirely by now.
Spencer and Christie have already stated that the HT eruption can’t explain anything other than a fraction of the observed warming.
Please quote what they actually said, then compare and contrast with what atmospheric chemists and physicists have observed since January 2022.
https://www.pnas.org/doi/full/10.1073/pnas.2301994120
https://www.nsstc.uah.edu/climate/2023/august2023/GTR_202308AUG_v1.pdf
The subsequent five months have shown pronounced warming. I wonder if the UAH team still thinks the HTHH influence is minor.
“may be”… “appears”
These are NOT statements of fact.. they are opinions. !
Yeah, it’s early yet, to be making predictions. Observations seem to be contradictory to the initial prediction.
If the sudden temperature increase is not from Hunga Tonga, then where is it from?
El Niño 2023-24 is shaping up as garden variety, possibly weaker than 2020, let alone 1997-98 and 2015-16.
IMO the warmth since July primarily owes to HTHH and cleaner air over oceanic shipping lanes.
With the global jetstream in its current state its little wonder that the atmosphere is suckin up a lot of heat. Just look at the increased amount of windshear it is creating through out the atmosphere across the globe.
Amazing how laser focused everyone else is on only the El Nino Ocean current and nothing else other than the volcano. What about the jet stream and the rest of at least the Pacific Ocean currents? Is something being missed? It’s not the CO2, no one is “claiming” that, but some commenters may be implying it.
Big contrast between the start and end of the year. Here’s the average January – June anomalies.
Sorry – here it is.
And here’s the July to December averages.
As I’ve may have said before, what makes this year remarkable is that the warming has all happened since NH Summer. El Niño warming usually happens at the start of the year.
El Nino warming did start near the start of the year… May
Your point is ??
And you evidence of any human causation??
My point is, if this year’s heat is caused by ENSO, it is behaving differently to the previous two big peaks in 97/98 and 15/16.
The ENSO conditions in 2023 have followed a similar trajectory as 1997 and 2015, though 2023 has been somewhat weaker. But in 1997 and 2015 you were seeing a much gentler rise.
The peaks where in 1998 and 2016. And if you compare 2023 to 1998 and 2016, you can see they had cooled down from April.
So if the 2023 peak is entirely due to the current El Niño, it either accelerated much more quickly and then reached a peak earlier, or it’s going to be getting warmer next year.
My, uneducated guess, is that it will be the former. But we shall see.
Forgot the graph again.
So it happened at a slightly different time of year
SO WHAT !!!!!!
A hockey stick!
El Nino releases create a transient spike.
Don’t tell me you only just noticed !!
A big El Nino, releasing a lot of energy into the atmosphere.
Now.. any evidence of any human causation ???
Still waiting.
I anticipate a decrease in anomaly for the next 3 years, as the effect of the Tonga eruption wanes. 2023 was an anomalous meteorological year, not the result of the trend. If the anomaly was a cold one nobody would be paying any attention to it, showing the prevailing bias.
“I anticipate a decrease in anomaly for the next 3 years”
It would be quite astonishing if that didn’t happen.
“2023 was an anomalous meteorological year, not the result of the trend.”
Which is why I keep saying it’s remarkable. It would be even more remarkable if it wasn’t boosted by a 50 year trend.
“If the anomaly was a cold one nobody would be paying any attention to it, showing the prevailing bias.!”
We will have to see when and if that happens. I suspect a record cold year would receive quite a lot of attention. It was only a few years ago when the claim that warming had stopped in 1998 was gaining quite a lot of undue attention, despite the fact that no year was anywhere near record cold.
“if it wasn’t boosted by a 50 year trend.”
A trend that comes only from previous El Ninos.
Absolutely nothing in the way of warming apart from the effect of those El Ninos.
No evidence of any human causation in 45 years of the atmospheric data… none whatsoever. !
Warming DID stop after the 1998 El Nino, until the 2015 major El Nino.
You must publish this strange theory of yours one day. How warm do you expect it to get over the next century based on just the warming caused by the next ten or so El Niños?
OMG ! another fool that thinks all EL Ninos act the same.
What sort of mindless idiot are you !!
No, I’m telling you it’s behaving differently this time.
Then why the heck do you think anyone can mindlessly extrapolate and comment on the next 100 years or so.\
I’ll leave the mindless extrapolation to AGW cultists, ie cretins like you.
You are as idiotic as those who say we should be “boiling” from El Ninos
It is just a show of dementable ignorance.
So let me get this straight. You are absolutely certain that a few El Niños in the last 45 years caused all the observed warming over that period. But you also think it’s impossible to predict if any more El Niños will cause any more warming, because they all behave differently. Is that the gist of your research?
“It was only a few years ago when the claim that warming had stopped in 1998 was gaining quite a lot of undue attention”
I suppose that depends on your definiton of “warming”. The warming did stop in 1998. It wasn’t until 2016, that it got warmer than 1998, according to UAH. According to the Liars at NASA and NOAA, every year after 1998, was hotter than 1998.
The climate alarmists thought that the warming of 1998 would continue higher because CO2, but when it did not continue higher, the climate alarmists started to panic. James Hansen started backtracking on his claim that 1934 was 0.5C warmer than 1998, eventually saying 1934 was cooler than 1998.
Climate Alarmists can’t acknowledge it was just as warm in the past, because then they can’t lie about the present and claim we are currently experiencing unprecedented warming due to CO2.
We have dishonest people leading us over the cliff when it comes to the dishonest proposition that CO2 is causing the Earth’s climate to change in ways it otherwise wouldn’t do.
There are two factions in climate science that are driving all this. The money grubbers and the true believers. The money grubbers need to see continued warming to keep the dollars flowing so they fudge things and claim to know temperature change to the hundredths digit which is impossible. The true believers are a “confirmation” clique, they will believe its all exceptional, human caused warming even when presented with evidence that it is natural variation and nothing more.
Yep, the amount of energy released by the El Nino was quite large.. and totally natural.
No evidence of any human causation, though.
It is funny that the planet has been more rapidly shedding energy from the system in the last year which will soon stop the warming trend for a time as the outflow will not be sustained.
The warming is mostly fueled by the El-Nino phase.
Isn’t it funny how the warming trend stops “for a time” every now ad then – then carries right on again?
It’s almost like it’s a long-term warming trend.
God you are profoundly stupid, I actually accepted that it has been warming but it occurs when there is a significant El-Nino phase then no warming for years in BETWEEN he phases which makes people wonder where CO2 is lurking when the El-Nino phase dwindles cooling comes in for a time then goes to a mostly FLAT trend until the next El-Nino phase comes along.
El-Nino phases is the Dominant cause of the warming trend.
Wonder no more, Sunset; the warming is ‘hiding’ in the long term trend.
Right in front of your eyes.
Do you get it?
You don’t, do you?
There is no 45 year trend once you remove the influence of the EL Ninos.
There is basically NO TREND between those El Ninos.
here is no evidence of any human-caused warming whatsoever.
Right in front of your eyes… if you actually open them and let some light reach your tiny brain.
Do you get it.. nope you don’t have the mental capacity to do so.
The “long term trend”, say 3000 years, is absolutely NEGATIVE !!
Hiding,, Yet you are so mentally blind, you cannot show us where it is. !!
YEp the trend STOP when there isn’t a big El Nino influence
In fact, the so-called “trend” relies totally on the effect of those El Ninos.
I have mentioned that time and time again
Maybe you are finally waking up to reality..
Nope , not a chance.
And La Nina doesn’t exist?
I mean, this idiotic line is wearing terribly thin.
Even for this site.
Yep, your idiotic line is basically a poof of mindless brain-fart. !
You keep proving you are totally clueless about El Nino and La Nina.
Go and do some basic learning, and stop being a gormless twit.
You really should explain this to bnice. Hew’s the one who thinks that the heat from El Niños stays around indefinitely – and cause al;l the warming seen over the last few decades.
You are the one that uses El Ninos as your prop for warming..
Do you REALLY DENY that every major El Nino has caused a small step up in temperature after the initial spike?
Are you really that blinded to reality and the data in front of you??
Now.. evidence El Ninos are caused by humans.
Still waiting
You seem to want everyone to explain to you how increased CO2 causes warming, but never like it when you are asked to justify your belief that all the warming can somehow be caused by El Niños.
I’ve given you graphs demonstrating the correlation between CO2 and temperature before. You’ll just insist that it isn’t evidence, because you don’t understand what the word means.
Here for example is a simple linear model using just CO2 and ENSO conditions. It’s certainly not perfect, and doesn’t predict the current spike, becasue as I say, it’s not behaving like a normal El Niño spike. But it does demonstrate that it’s possible to explain all of the warming trend just using CO2 modified by ENSO,
You get a better fit if you also factor in the volcanic activity in the 80’s.
Your graph makes no sense. The x-axis is labeled as time. The y-axis is labeled as anomaly. How does CO2 + ENSO + VOLCANO affect anomaly? Do you have some anomaly attribution data you are using to achieve a total anomaly by month or year.
You do realize that by doing this, you are reducing the effects of CO2? What have you reduced ECS to in order to do this?
It is just a fabricated zero-science idiot’s model.
Devoid of any actual science. !
I’m sure I’ve had to explain this to you each time I update this.
I’ve done a linear regression on temperature using CO2, ENSO, and a factor for volcanic atmospheric effects. Time is not a factor. I then display the predictions for each month on a graph with time as the x-axis. This is purely to help visualize the linear regression model. It’s easier than trying to draw a 4-dimensional graph.
“Do you have some anomaly attribution data you are using to achieve a total anomaly by month or year.”
Not sure what you mean by that. The anomaly data is the monthly UAH anomaly data.
“You do realize that by doing this, you are reducing the effects of CO2?”
Actually, no.
Just using CO2 on it’s own the, the estimate is 1.59 ± 0.24°C / log2(CO2).
With ENSO and Volcano the CO” component is 1.64 ± 0.20°C / log2(CO2).
No significant difference.
I should say, this is trained on data up to the start of 2015. The blue region of the graph, is testing these models.
“What have you reduced ECS to in order to do this?”
I wouldn’t make any claims about sensitivity based on this simple model. And certainly not ECS. If you could read anything into it, it would be TCR.
Pointless mindless models
Not based on anything but mindless mantra anti-science. !!
But if you do want the data presented in a non-time series graph – here it is. The x-axis is the predicted value, based on log(CO2) + ENSO + Volcanic.
In this case I am simply using all the data, rather than splitting between test and training data. The R^2 is 0.70.
Let’s look at your “predict” value of “0”. You have values from ~ -0.4 to ~ +0.25. that a range of 0.65. The entire range of the y-axis is 2. The relative range is 0.65 / 2 • 100 = ~ 33%. That’s not a good predictor of what you can expect. It won’t even tell you the correct sign until you get to a “predict'” range of 0.5. A good model should do a much better job calculating expected values.
In essence you have made a graph of guesses. Good job.
It’s always so fascinating seeing how many contortions you have to pull to avoid seeing the point. Of course I cannot predict what any monthly value is exactly. The point is those three independent values can explain a lot of the overall change in temperature. Hence, there is some evidence for CO2 effecting the climate.
“That’s not a good predictor of what you can expect.”
As I said, the r^2 is 0.70. That can roughly be interpreted as the model explaining 70% of the variation in the anomalies.
“A good model should do a much better job calculating expected values.”
Then show us yours.
A simple linear model.. that doesn’t predict anything except warming, due to it being based on the baseless conjecture of CO2 warming.
How moronic and anti-science can you get !!
You don’t really call that “evidence” do you.
… just WOW !!
Please show evidence of human caused warming in the UAH data. !!
DO NOT use the El Nino and their step-change as your prop.
So.. evidently, you know YOU CAN’T !!
I did, just above this comment. You, as expected, refused to accept it.
First…have you backtested this hypothesis over the several thousand years that ENSO has been occurring?
Second…the data does not support that conclusion over the period of record of UAH anyway.
“backtested” — the hockey stickers invent a new term.
No one knows the cause, but it is in unknown ways the combination of at least, the Tonga fallout, El Nino cycle, SC25 sunspot max, and QBO cycle as they influence the Ozone/Brewer-Dobson circulation and its effect on the polar vortex … etc. It could also be affected by the extra heat island effects created from the growing number of large fields of solar-panels.
👍
There is only one of those you listed that has never occured before, and that is HT.
Along with record Anarctic Sea Ice loss and record global temperatures.
Of course it is HT, until someone can point to the record Antarctic Sea Ice loss, that coincides with the event, there is no other explanation. Correlation does not mean correlation, AFTER you have disproved the correlation. Got, theory, got experiment, got data.
Ocean seismic activity has also been quite high over the last couple of years.
(caused by human released CO2 ,of course)
Note that none of the years between 1998 and 2016 are warmer than 1998, according to the UAH satellite record.
NASA and NOAA claimed there were ten years between 1998, and 2016, that were warmer than 1998, making a “hottest year evah!” claim year after year.
So NASA and NOAA are liars when it comes to temperatures. If they were restricted to using UAH records only, they would not have been able to claim even one year between 1998 and 2016, was the “hottest year evah!”.
How does it feel like to be lied to by NASA Climate and NOAA? These two government agencies are corrupt to the core when it comes to promoting CO2-caused Climate Change.
“If they were restricted to using UAH records only, they would not have been able to claim even one year between 1998 and 2016, was the “hottest year evah!”.”
That is a big “if” Tom. The truth is they have other temperature data sets they use to obtain a complete picture. I mean, why should they restrict themselves to one set, when there are others available? That makes no sense.
Comprehension issues again, simpleton ???
Surface temperature give a great picture of urban, airport, bad siting, changes in thermometer type, and manic agenda-driven maladjustments
No way they can give even a remotely realistic view of actual “global” temperatures over time.
The time-of-observation bias is necessary, due to statistical evidence of differing observation schedules.
Statistical evidence shows it make very little difference in trends.
or in actual values.
“I mean, why should they restrict themselves to one set, when there are others available?”
UAH is the only honest representation of the global temperatures.
The reason the Liars at NASA and NOAA don’t use UAH is it doesn’t allow them to lie about the Earth’s climate. To do that, they bastardized the surface temperature records and claim one “hottest year evah!, year after year after 1998. The better to scare you, dear!
NASA and NOAA are lying about the temperature record as a means of promoting the human-caused climate change narrative.
One of these days, it will be a huge scandal. Sooner, rather than later, I hope.
NASA and NOAA aren’t measuring the lower troposphere. They are surface measurements. Two different things.
Mostly the surface temperatures are measuring really badly corrupted urban and airport sites, in-filled and twisted and tortured by agenda-drive mal-manipulation.
Totally meaningless and irrelevant for measuring temperature changes over time.
I’d like to see your evidence.
Oh wouldn’t we all……….
Simon can’t take in more than an ink-spot in as evidence.
Totally incapable of understanding anything, even remotely.
DENIAL of the urban warming effect..
DENIAL of airport warming effects…
… how much more ignorance can he produce. !!
No, simpleton, not a challenge..
I’m certain you have much more ignorance you can produce. !!
There is masses of evidence everywhere about urban warming, bad station siting, airport warming, unjustified maladjustments etc etc
Large numbers of surface site are totally unfit for the purpose of “climate-change-over-time” even by the standards of the NASA, BOM, and the WMO etc.
Look at the surface station project elsewhere on this site for USA sites.
In Australia KensKingdom shows that nearly half of all sites are totally unfit for “climate” use.
Why do you think this forum exists? Have you read ANYTHING about its evolution at all? Go look up Anthony Watts and his study of temperature measuring station problems!
I am going to keep asking just how the CONUS has managed to extricate itself from the worldwide global warming that is happening over the last 20 years? To say nothing about numerous stations on every continent that are not experiencing warming.
Yes, why should the United States and Canada even be thinking about Net Zero, when they have been in a temperature downtrend since the 1930’s. CO2 has had no effect on the North American continent.
And, according to temperature charts from all over the world, the same should apply to the rest of the world, too, since it is no warmer today for the world, than it was in the recent past.
CO2 is a non-issue going by the written, historical temperature records, which show it is no warmer today than in the recent past. More CO2 in the air has had no effect on the Earth’s temperatures. It’s not any warmer with more CO2.
I posted a little excerpt from Spencer and Christy up above a little ways, and it says that UAH measures the temperatures from the surface to the upper atmosphere.
Are they wrong?
They actually are. They recently announced that their newest updates to the STAR satellite system resulted in their measurements are very close to what UAH has. You need to do better research before spouting off.
Mid‐Tropospheric Layer Temperature Record Derived From Satellite Microwave Sounder Observations With Backward Merging Approach – Zou – 2023 – Journal of Geophysical Research: Atmospheres – Wiley Online Library
What in Pete’s name is an “observation-based SEMI-PHYSICAL model”?
“Temperature changes resulting from diurnal sampling drifts were corrected using an observation-based semi-physical model developed in this study.”
General linear regression of existing data using an assumed (i.e. made-up) relationship, much like bgwxyz’s GAT “model”.
Oh, No! It’s so hot, We’re all gonna die! Oh woe is me.
Actually, compared to the last 10,000 or so years, its rather “TEPID”
We had the Holocene Optimum
We had the Minoan Warm Period
We had the Roman Warm Period..
We had the Medieval Warm Period.
We are now in the MTP… the Modern TEPID Period.
How is the vertical contour over the tropics going? Is it doing the right thing yet to indicate CO2 induced warming?
The TLT minus TLS trend in the tropics is +0.33 C/decade. So yes the expected steepening of the lapse rate is occurring if that was what you were asking.
Thanks. Has Christy conceded yet?
Yes. Dr. Spencer and Dr. Christy both accept that human actions are at least partly the cause of both the overall warming and the steepening lapse rate if that is what you are asking.
Got a reference? I was well aware that they accepted that increasing the concentration of greenhouse gasses should cause some warming, but I’ve never seen them say that there is a strong signal in the vertical temperature profile in the tropical troposphere. I’ve only seen them say that the signal is not as strong as it should be. If they are now admitting that this signal IS there, that would be significant to me.
Dr Spencer talks about on his blog. When I get time I’ll see if I can dig up relevant articles.
https://www.drroyspencer.com/2015/06/what-causes-the-greenhouse-effect/
https://www.drroyspencer.com/2013/05/imaging-the-greenhouse-effect-with-a-flir-i7-thermal-imager/
https://www.drroyspencer.com/2013/04/direct-evidence-of-earths-greenhouse-effect/
https://www.drroyspencer.com/2018/05/in-defense-of-the-term-greenouse-effect/
https://www.drroyspencer.com/2016/07/the-warm-earth-greenhouse-effect-or-atmospheric-pressure/
Thanks, but none of those links say that the observed vertical temperature profile in the tropical troposphere is what we would expect for the amount of observed warming.
I don’t think I’ve ever seen an expectation for a specific TLT minus TLS trend value other than it being positive and greater than the TLT trend.
The FLIR i7 has a temperature range of –4 to 482°F
IIRC, the Wien’s temperature of CO2 emissions is around -81C
Great for measuring H2O radiation… not so much for CO2
So=called “greenhouse Effect”… ONLY from H2O.
It is the only substance that alters the lapse rate by anything more than a totally immeasurable amount.
Actually an “Atmospheric Mass” effect.
Pretty sure you are totally incapable of understanding the basic physics behind retention of more energy under increased pressure, and density, though. !
That statement as no meaning. You know it and I know it.
It is impossible to scientifically ”accept” anything. No one knows how sensitive the Earth’ temperature is to co2. There is nothing in the observations that shows it. It could be that it is only half a degree/doubling. That would very easily lost in the noise of natural variability. Even a 1 degree sensitivity would not be able to be detected given the variations of the past. It is almost certain however, that this latest spike has nothing to do with co2 at all. The slight decline from 2016 to now has more noteworthiness than this.
For what it’s worth, my money is still on the sun although I may never see a return.
I’m going to let you pick that fight with Dr. Spencer alone.
At least partly . ie at least 0.0000123%
It is a statement NOT backed by any actual science.
I wonder why we don’t see this coterie on his site. You post there regularly. Oh yeah, no superterranean communication allowed…
I am wrong. Unless I got the names confused, Mr. Hogle exchanged views the bdgwx on Dr. Spencer’s site this month. Sorry for your confusion Mr. Hogle. Did bd’s spoon fed explain help?
Still no standard deviations, distributions, nor any other basic stats reported for all the myriad of averages that generate the UAH.
Have you asked Dr Spencer why he doesn’t report them?
Have you? What did he say?
We don’t need to ask him because we can compute this information on our own via the gridded data he provides.
bdgwx: “We don’t need to ask him because we can compute this information on our own via the gridded data he provides.”
Is there any informational value for the non-technical consumer of UAH reports in having standard deviations, distributions, and other basic stats available online for all the myriad of averages that generate the UAH?
I myself have no opinion on this question one way or the other since I have no reason to believe that Dr. Spencer and Dr. Christie aren’t using a professional approach in pursuing the technology and the science behind UAH data collection, analysis, and presentation.
After all, it’s not like they are using strip bark pine trees in Colorado as thermometers for measuring the earth’s global mean temperature as it was present a thousand years ago to a hundreth of a degree C.
You sound a little stressed, Beta Blocker, which is probably a bad thing for someone with your name.
You seem to be dismissing the UAH data at the same time as supporting its integrity.
Which is it?
There goes fungal’s total lack of basic comprehension.. yet again !!
“aren’t using a professional approach “
Be we have EVERY REASON to know that those in charge of the surface data ARE NOT “using a professional approach”
I don’t know. That may be a little subjective. Some might be interested in those statistics and some might not.
Liar—what you claim is not possible with the published public data on the FTP site.
I’m not the one who keeps whining about the lack of details. I’m happy to accept the UAH data, along with all the others, for what they are.
So am I,
Shows that there is absolutely no human causation in the warming since1979. !
Surface temperature are rampant with human causations.. but CO2 is not one of them.
“Shows that there is absolutely no human causation in the warming since1979. !”
Oh to have the absolute certainty of a climate “skeptic”.
Go on then, explain how you can be certain there is “absolutely” no human causation in the warming over the last 45 years. Extra marks if you can avoid claiming it’s all caused by El Niños.
Again
You have NOTHING!
No evidence of human causation.
Just your childish evidence-free gibberish.
Sorry if you are too incompetent to see the effect of El Ninos in the satellite data…
…and have to fabricate some other fantasy in your empty little mind.
Now evidence of human causation for El Ninos.., which provide the only warming in the satellite data…
…. or just keep yapping like a demented chihuahua.
I take it that you can’t provide proof that there is “absolutely” no human causation.
It is your story.. up to YOU to prove it.
You have just FAILED UTTERLY AND COMPLETELY !!
It is not my story that there is “absolutely” no human causation. That’s what you are claiming.
Taking into account the warming spikes and steps from El Ninos, there is NO WARMING AT ALL in the UAH data. !
You have continued to be totally unable to show any human causation for that total lack of warming.
“Taking into account the warming spikes and steps from El Ninos, there is NO WARMING AT ALL in the UAH data. !“
Wrong graph.
“You haven’t taken into account the warming by El Nino.
You have specifically USED the warming from the El Ninos to create a monkey-with-a-ruler trend.
I’m guessing because you are WELL AWARE that El Nino warming is all you have.
“Wrong graph.”
STILL the wrong graph..
Shows absolutely no evidence of human CO2 warming.
You haven’t take into account the warming by El Nino.
You have specifically USED the warming from the ElNinos.
How did you become so incredibly ignorant ???
“provide proof that there is “absolutely” no human causation”
You keep providing it for me.
Thanks. !
Wow, 4 whining responses to a single graph demonstrating that he’s wrong to claim that if you remove strong El Niños there is no trend. Something tells me bnice is a little rattled. Methinks the troll protests too much.
Here you go. Tell us where the human caused warming is. Maybe it stopped cooling from taking place.
It might help if you actually labelled the graph. What anomalies are you talking about, what’s the yellow line, why are you only showing April?
For what it’s worth, here’s the graph I get for April using RSS data.
EL Ninos are YOU !
They are all you have.
And I’m certain you are well aware of that by now.
Either that or are just incredibly DUMB !
Now, that evidence of human causation
You are batting well in the negatives at this stage.
You are still not saying what the data is. That’s a problem if you want me to explain it.
“I assume you know that “RSS” is Root-Sum-Square combination of variances.”
Well, I assumed you meant the RSS satellite data. I’m not sure what the point is about root-sum-square. Why not just say standard deviation if that’s what you meant? RSS is only standard deviation if you are using errors about a mean.
“Isn’t it amazing that the SD’s are close to what NIST found?”
Why would you think that?
“”””Why not just say standard deviation if that’s what you meant?””””
Because it is not a simple calculation of standard deviation of the consequent anomaly. It is the subtraction of random variables and the variances of each random variables add.
Read this and study some of NIST’s document.
https://www.itl.nist.gov/div898/handbook/mpc/section5/mpc57.htm
“””””Why would you think that?”””””
Because you and other CAGW advocates believe the uncertainties of anomalies are in the one-thousandths of a degree.
Look I’m tired of trying to teach you. In the future post a reference that supports your assertions. Simple cherry picking things won’t pick a response from me as you obviously have not taken advantage of your time to actually learn anything.
“Because it is not a simple calculation of standard deviation of the consequent anomaly. It is the subtraction of random variables and the variances of each random variables add.”
Sorry, but I’ve still no idea what you are trying to do.
I assumed you have 30 days worth of data, and are then taking the standard deviation of the data. But that would be RMS, not RSS. If you are just adding the squares of the errors you are getting the uncertainty of the sum of all your daily values, which is a meaningless value.
“Read this and study some of NIST’s document.”
What’s that got to do with RSS? Not for the first time you seem reluctant to just explain what you are trying to do, and instead keep speaking in patronizing riddles.
“Because you and other CAGW advocates believe the uncertainties of anomalies are in the one-thousandths of a degree.”
I most certainly do not think that. I doubt anyone does.
“Look I’m tired of trying to teach you.”
Then stop it. I don;t want you to teach me anything. I think you are wrong about most of the things you claim. Try explaining what you want to do, and why you think it’s correct, and we might be able to understand each other better.
“In the future post a reference that supports your assertions.”
What assertions? All I’ve done is try to get you to explain what your graph is of – the graph you asked me about.
RSS
σ(X – Y) = √(σ²monthly + σ²baseline)
You could have said that in the first place. So just the claimed uncertainty of your anomalies. Now if we could only figure out what data you are using we might be able to get somewhere.
Any help identifying the data source? Don’t let Mr 2000 have the last word.
Do a Google dude! Why don’t you show a reference refuting it?
So rather than tell me what your data is, you expect me to find it on Google?
Sounds like you’re embarrassed to tell us what it is.
Nitpick Nick is another hockey stick alarmist who can read minds.
Not embarrassed at all. The data is from Topeka Forbes. A rural station since the airbase closed.
Maybe you should spend some time examining various stations around the globe to see how many have no warming.
I would be interested in why you have not verified your “global average anomaly” against random stations around the globe. Tell us where anyone has done this using actual station data that is unadjusted.
I am also interested in why you do not perform standard statistical operations on variance when calculating the subtraction of monthly and baseline random variable means.
You might also explain where the uncertainty that NOAA lists in their documents for ASOS and CRN disappears to. LIG’s should have at least what ASOS is expected to have.
Surely you won’t be embarrassed to show your calculations for finding monthly average uncertainty using NOAA’s figures for uncertainty. As a common base, use NIST TN 1900, Example 2 temperature data extracted from a NIST controlled weather station.
He won’t answer is my psychic prediction.
I think I’ve got it now. Note there is a big gap in the x-axis where it jumps from 1970 to the mid 90s, but isn’t actually shown in the graph. That reminded me of the last time we were going through this nonsense, when Tim Gorman was insisting that changing between Celsius and Fahrenheit could turn a positive trend negative, and was refusing to accept there was an obvious problem with his data. Anyway, that was all based on Topeka. So I’ve downloaded the daily GHCN data for USW00013920, and that seems to be the same.
Here’s the TMAX for April
Warming rate is 0.25°C / decade. This is from 1953, so about 7 decades.
In contrast Night time temperatures have decreased slightly.
Trend -0.05°C / decade.
Which means that average April temperatures have been rising at 0.10°C / decade.
Whether this means much given the 20 year gap is another question.
Interpolating a gap in data is generally not a problem. The only issue would be if measurements in the gap had unusual values. Having experienced the temperatures in Topeka since 1970, I can assure you there was neither unusual warming or cooling.
That’s great. Why do you think my charts don’t show the same thing?
The point is that I was showing the uncertainty interval and you just totally IGNORED that the uncertainty in measurements does exist!
Your commenting shows just how little you know and appreciate when making measurements and displaying their results.
If your trend line is entirely within the uncertainty interval, just what do you think that means?
Does the trend have any significance if it is within the uncertainty of the measurement?
I bolded these questions because it is the most important part of this whole discussion. You obviously don’t consider uncertainty when touting your trends. That is not scientific. That is simply assuming that every value you use has no uncertainty associated with it. That is what statisticians learn, all values are 100% accurate. That IS NOT what scientists and engineers learn.
Go back and use the TN 1900 procedure to calculate an uncertainty interval for each month you have displayed. Plot that interval for each month and let’s see what you arrive at!
You have read the GUM and cherry-picked pieces of what is explained but you continue to display a lack of understanding in what measurements of physical quantities requires.
From the GUM:
See that phrase “it is obligatory that some quantitative indication of the quality of the result be given”. Why is that not a part of what you consider EVERY time you deal with temperature measurements?
The point is not how accurately you can calculate a mean. The point is providing an accurate depiction of the dispersion of measurements that can be attributed to the measurand.
“That’s great. Why do you think my charts don’t show the same thing?”
Probably becasue you insist on ignoring the gaps in the records.
“The point is that I was showing the uncertainty interval and you just totally IGNORED that the uncertainty in measurements does exist!”
Your jagged lines are not uncertainty intervals. It you prefer here’s the same adding the uncertainty intervals based on the standard error of the daily values. (Whether that makes sense is another argument.) The lines are 2 sigma values.
(BTW, I think I missed of 2023 from the last graph. The trend for Max is now 0.26 ± 0.21°C / decade)
BTW again, different months show quite different rates of warming. For TMAX all are positive apart from October. March is the most significant, with a warming rate of 0.67 ± 0.34°C / decade. That’s almost 5°C of warming since 1950.
Minimum temperatures on the other hand show much flatter conditions with quite few showing cooling. March is the exception showing 0.34 ± 0.28°C / decade warming, whereas October shows a significant negative trend -0.27 ± 0.20°C / decade.
“I bolded these questions because it is the most important part of this whole discussion.”
You needn’t have bothered. We’ve been over this again and a gain, and you always refuse to accept my answers.
I’ve shown the uncertainty of the trend line on the graphs, the grey area. This is based on the standard equations for the uncertainty of a linear regression. Most of the trends are not significant, that’s what happens when you have a single station with highly variable temperatures, and only look at a single month.
You should know by now that you do not directly use the uncertainties of the individual monthly values, but if they all have high levels of uncertainty that is reflected in the variance of the individual values.
What you do not do, which you always claim, is say that if the trend is within the measurement uncertainties, there is no significance to the trend. As always your approach ignores all randomness in the uncertainties, and it also ignores the actual monthly variation. The trend line can never be entirely within all the uncertainty intervals, as you should be able to see from my graphs.
“You obviously don’t consider uncertainty when touting your trends. That is not scientific.!”
[cough]Monckton[/cough]
“That is what statisticians learn, all values are 100% accurate.”
That might be what you learnt. It certainly isn’t something I would expect any half competent statistician to believe. Statistics is all about uncertainty, that’s the whole point of hypothesis testing etc. It’s just as I keep telling you, the measurement are generally not as important as all the other sources of uncertainty.
“0.1 When reporting the result of a measurement of a physical quantity, it is obligatory that some quantitative indication of the quality of the result be given so that those who use it can assess its reliability.”
Mea culpa. But I’m not writing scientific reports, or any thing I expect to be published. I’m just answering questions on a hostile blog. And as always you never complain of all the times data is presented with zero uncertainty if you agree with it.
“Why is that not a part of what you consider EVERY time you deal with temperature measurements?”
Says someone who spent a day refusing to say what the data in his graph actually was. Made no mention of uncertainty except some cryptic mention of RSS, and seems to think all the uncertainty is around an arbitrary point, rather than the actual measurements.
Annual average for Topeka are similar to the April values.
TMax:
+0.26 ± 0.14°C / decade.
p-value is 0.0004 – statistically significant.
TMin:
-0.02 ± 0.10°C / decade
p-value 0.73 – not significant.
Here’s the graph for maximums
And for minimums
A few caveats:
The uncertainties are too large. I simply used the standard deviation of daily values divided by √N. But ignores the seasonal cycle, which will be the main contributor to the variation in the data.
I’ve made no adjustment for auto correlation. That might make the confidence interval too small.
Quite a few years have missing days. This shouldn’t be a problem with monthly data, but could be for annual. For these graphs I’ve counted all years with more than 360 days of data.
As I’ve said before, the main issue I have is with the missing years decades. This might suggest the pre 1970 and post 1995 data are from different stations, environments or instruments.
If you only look at the data after the hiatus, starting 1998, the rate of warming increases for both max and min, but neither are significant because of the small amount of data.
max:
+0.53 ± 0.60°C / decade
min
+0.29 ± 0.45°C / decade
So you used the SEM! LOL! You must think that NIST is stupid for using an expanded standard uncertainty of the mean to describe the dispersion of data that can be attributed to the measurand.
I’m sorry but using actual numbers only explodes the assumption that you know what you are doing. What do you reckon NIST would do? Maybe multiply 0.60 by 2.08 which gives ±1.25?
Why do you think using the same month throughout the baseline somehow contains a seasonal signal? You still have no clue.
Auto correlation only occurs in time. Time is not a factor here. Autocorrelation occurs in time intervals and results in nonrandom sequences of measurements. That would mean all the GUM and other standards since multiple measurements of the same thing would obviously be highly autocorrelated. Measurements of the same measurand are not be assumed to be autocorrelated. They are entirely independent measurements. Correlated measurements occur when one measurement has a direct effect on another measure.
Your concerns primarily deal with trends. I am concerned with measurements which you are uneducated about. It is funny how you are ok with homogenization and adjusting data in order to create a long record because sequences don’t match up yet the data here requires no adjustments at all but you expect something has occurred!
Quit trying to stick something to the wall.
“So you used the SEM! LOL! You must think that NIST is stupid for using an expanded standard uncertainty of the mean to describe the dispersion of data that can be attributed to the measurand.”
I used a k = 2 factor for thew expansion. Using the student distribution would have used k = 1.97.
“What do you reckon NIST would do? Maybe multiply 0.60 by 2.08 which gives ±1.25?”
How many times, the “measurement” uncertainty of the monthly values has nothing to do with the uncertainty of the trends. And all my trend uncertainties are 2σ.
“Why do you think using the same month throughout the baseline somehow contains a seasonal signal? You still have no clue.”
Indeed I haven’t got a clue what you are on about. I’m talking here about annual averages. Hence there is a strong seasonal cycle.
“Auto correlation only occurs in time.”
As do years.
“Time is not a factor here.”
Time is not a factor in a rate of change?
“Autocorrelation occurs in time intervals and results in nonrandom sequences of measurements.”
Which is what the graph suggests.
“That would mean all the GUM and other standards since multiple measurements of the same thing would obviously be highly autocorrelated.”
Gibberish.
“Measurements of the same measurand are not be assumed to be autocorrelated.”
Nothing to so with what I was talking about – the effect of autocorrelation on the uncertainty of the trends, but, yes, that’s an assumption that TN1900 makes, and not one I feel is justified.
“Correlated measurements occur when one measurement has a direct effect on another measure.”
No. There is no need for a direct effect.
“Your concerns primarily deal with trends. I am concerned with measurements which you are uneducated about.”
You asked me to say if there was a sign of warming. That’s about trends not uncertainty of individual months. And you are into your usual contradictions – saying that you can’t see warming, claiming that that means there is no warming, and then pointing out that the data you used is too uncertain to see warming.
“Time is not a factor in a rate of change?”
The temperature data has no time associated with it. Arrange it by increasing value. Arrange it by decreasing value. Shuffle it randomly.
YOU STILL GET THE SAME AVERAGE AND THE SAME STANDARD DEVIATION!
Not only is your reading comprehension sadly lacking so are your critical thinking skills!
If you *ACTUALLY* read TN1900 for understanding instead of cherry picking you would understand why Possolo picked the temperature measurement protocol he did. It’s written right there in the measurand defintition!
More arguments from what Tim fondly believes is the real one.
“The temperature data has no time associated with it”
Try looking at the GHCN daily data. Every entry has a date associated with it.
“YOU STILL GET THE SAME AVERAGE AND THE SAME STANDARD DEVIATION!”
Shouting in all caps – tick.
You get the same average, you don’t get the same rate of change. And even with the average, ignoring auto-correlation will give you the wrong uncertainty.
“Not only is your reading comprehension sadly lacking so are your critical thinking skills!”
Personal insult that adds nothing to the discussion – tick.
“If you *ACTUALLY* read TN1900 for understanding instead of cherry picking you would understand why Possolo picked the temperature measurement protocol he did. It’s written right there in the measurand defintition!”
Random stock comment that has nothing to do with the discussion – tick.
“You get the same average, you don’t get the same rate of change. And even with the average, ignoring auto-correlation will give you the wrong uncertainty.”
The rate of change is meaningless if you don’t know its accuracy. It is the standard deviation of the stated values or the propagated uncertainties from the data elements that determines the measurement accuracy of the means.
Jim tried to explain auto correlation to you. As usual, it just went right over your head! Possolo explained it in TN1900 and, again, it just went right over your head!
“The rate of change is meaningless if you don’t know its accuracy.”
Gorman logic in a nutshell.
“Jim tried to explain auto correlation to you.”
Jim and Tim both assert there can be no auto correlation in the data becasue there is no time in a time-series. (Somehow I don’t understand what auto correlation does to the uncertainty.)
“Possolo explained it in TN1900 and, again, it just went right over your head!”
The example say they assume the data is independent, even though that probably isn’t true because there isn’t enough evidence to show it isn’t.
I think that’s a simplistic assumption, but it’s irrelevant to my point. I am not talking about the auto-correlation in the daily data. I’m talking about the correlation of the annual values – and what effect that would have on the uncertainty of the trend.
“Mea culpa. But I’m not writing scientific reports, or any thing I expect to be published. I’m just answering questions on a hostile blog. And as always you never complain of all the times data is presented with zero uncertainty if you agree with it.”
What malarky! You keep trying to push the inanity that the sampling error is a measure of the accuracy of a mean. It isn’t. The accuracy of the mean is the propagated error of the components or the standard deviation of the measurements.
ACCURACY IS OF REAL WORLD CONCERN. HOW MANY DIGITS YOU CAN CALCULATE THE MEAN OUT TO IS *NOT*!
Probably? Is that all you can come up with? You need to show some references in order to make this assertion about gaps causing a problem. The upshot is that you are criticizing the joining of anomalies from ice cores or any other proxy. Good luck with that.
That’s quite an assertion! Nice try but you fail. Didn’t you read the statement that I used the methods for calculating measurement uncertainty as shown in NIST TN 1900?
If you don’t understand what TN 1900 does, I’ll repeat.
MONTHLY AVERAGE
BASELINE AVERAGE
Then standard statistical practice for combining random variables.
ANOMALY PARAMETERS
RINSE and REPEAT
That is your prerogative. Did you remember to expand them using a T factor. However, I have NIST as my backup for the proper measurement uncertainty. You have nothing for a reference.
“Probably? Is that all you can come up with?”
i was trying to be polite.
“You need to show some references in order to make this assertion about gaps causing a problem.”
Always with the references. Try to think for yourself sometime.
My point here was just that your graph is different from mine because you omit the 20+ years where there is no data. This gives a misleading impression that you have a continuous set of data, and that the temperatures in the 1960s just merged into the temperatures in the 1990s. Whether that causes a problem is not the issue, it’s just misleading. It would be a problem if you just based your trend on the data points rather than the dates – it will make the slope steeper.
“That’s quite an assertion!”
And one that’s justified.
“idn’t you read the statement that I used the methods for calculating measurement uncertainty as shown in NIST TN 1900?”
How you calculated the uncertainty intervals is not the issue. It’s the fact you drew them around a single line on the y-axis. Uncertainties are associated with the measurement.
“If you don’t understand what TN 1900 does, I’ll repeat.
MONTHLY AVERAGE
”
You really need to read the things you pontificate on. Nowhere in Ex2 do they convert to Kelvin. It would be pointless as they are only looking at the standard deviation. That will be the same using °C or K.
“BASELINE AVERAGE”
Which is another thing. I don’t know why you are using anomalies when looking at a single location for a single month, but in any event the uncertainty of the base line is irrelevant to any question of trend – it’s a constant factor for each month.
“Subtract the baseline mean from the monthly mean to obtain the anomaly. NOTE: This IS NOT AN AVERAGE.”
What do you mean by it’s not an average? It’s just the average of daily anomalies.
“Calculate the combined standard deviation by using RSS –> σ_anomaly = √(σ²_month + σ²_baseline)”
Do you now accept that this works regardless of whether the distributions are normal or not?
“Did you remember to expand them using a T factor.”
No. I used a standard k=2 coverage factor. Using a student distribution would only add an extra 2% to the size of the interval, and given the number of issues with this interpretation of uncertainty hardly seems worth the effort. Plus you’d then be yelling at me for assuming all uncertainties are Gaussian.
“However, I have NIST as my backup for the proper measurement uncertainty. You have nothing for a reference.”
I’ve literally done everything by the simplistic NIST example, except I multiplied by 2 rather than 2.04.
“ It you prefer here’s the same adding the uncertainty intervals based on the standard error of the daily values.”
The standard error you are showing is *NOT* the uncertainty of the data points!
“ It you prefer here’s the same adding the uncertainty intervals based on the standard error of the daily values.”
sigma / root(N) is their god.
And he still can’t grasp that error is not uncertainty.
“sigma / root(N) is their god”
Jim insists I have to follow the NIST TN1900 procedure. Now I’m attacked for following that procedure. The standard uncertainty of a mean is given by sigma / root(N). Every text book will tell you that, including the simple NIST simple guide. Sure there are lots of caveats about the the data needing to be IID, or sampling errors, or the all sorts of other uncertainties. But if you won’t accept this fundamental point you need to explain to NIST why they are wrong, as Jim keeps saying.
You are attacked for ignoring the assumptions made in TN1900 and assuming that it’s procedure is valid for ALL situations!
Once again, in TN1900
“The standard uncertainty of a mean is given by sigma / root(N).”
The standard uncertainty of a mean, as defined in statistics textbooks, is a measure of sampling error. IT IS NOT A MEASURE OF THE ACCURACY OF THE MEAN.
The SEM *should* be given as SEM +/- uncertainty because *each* component in the sample has uncertainty. Once again we find that old assumption of “all measurement error is random, Gaussian, and cancels”. So the SEM is 100% accurate!
You can’t even get *this* one correct!
You need to have this conversation with Jim. He’s the one insisting that the NIST procedure has to be used for the Topeka data. I assume he’s accepting all those assumption.
As I say, if you disagree feel free to post your own graph with your own uncertainty estimates.
Ha, ha ha.
I am quoting NIST TN 1900, because it is an example from a respected national agency. It shows how to calculate a possible value for one component of a combined uncertainty.
The example’s assumptions preclude other components that may not be negligible, like resolution, and systematic..
Do I agree with TN 1900? Not totally. But, it shows the uncertainty in the monthly average measurand far exceeds what Climate Science advocates. It does show a possible dispersion of values attributable to the measurand. Notice I did not say attributed to the mean.
The value of the mean is only a convenient way to show a symmetric interval. The mean DOES NOT define the best value of a measurand. That is unknowable. You need to make peace with that.
Search the GUM for the word “dispersion”. I think you’ll find that is mentioned only in relation to s(q_k), i.e., the standard deviation for a series of n measurements of the same measurand.
You want to make an impression. Define when the experimental standard uncertainty is used versus the expanded standard uncertainty of the mean. The GUM discusses both, but only one is defined as the dispersion of values attributable to the MEASURAND.
SEM *is* a measure of sampling ERROR. It is *NOT* a measure of the accuracy of the mean.
I agree to an extent, but you will have to take that up with Jim as he insists on following the NIST example.
In the mean time, rather than keep saying what the uncertainty isn’t maybe you could draw your own graphs with your own estimates for uncertainty.
I *GAVE* you that graph twice!
And you said you couldn’t understand it.
Here is another sketch. The SEM can be very narrow around the average while the SD can be very wide, implying a low accuracy of the mean. The wider the variance the less accurate the mean becomes. It is the area attributable to the measurand that is of primary importance and the SEM simply doesn’t give you any measure of this.
The *ONLY* time the SEM can truly be used is when you have multiple measurements of the same thing multiple times using the same device under the same environmental conditions. THE VERY ASSUMPTIONS POSSOLO MADE CLEAR IN TN1900 THAT HE WAS APPLYING!
The SD is SEM * sqrt(N). The larger you make N the wider the SD becomes! The less accurate the mean is for that distribution! Do you understand that simple fact? In order to calculate the SEM you have two possibilities.”
1. You know the SD and know the size of your sample, which is the size of the population since you also know the population mean..
2. You take multiple samples and find the standard deviation of the sample means.
If you know the SD then you also know the population mean! The SD is calculated using the population mean! If you know the population mean and the population SD then WHY DO YOU WORRY ABOUT THE SEM? If the sample size is the population then the SEM SHOULD BE ZERO!
If you take multiple samples then the SD is SEM * sqrt(N).
Jim follows the NIST BY USING THE NIST ASSUMPTIONS! Assumptions which you adamantly refuse to repeat.
“I *GAVE* you that graph twice!”
That is not a graph Topeka temperatures with the monthly uncertainties. Stop evading.
If you really want to use the standard deviation rather than the NIST values, here’s what it looks like. Now you just need to explain to Jim why his uncertainties are so small.
But really, all you are showing is the dispersion of daily values during each month. Nothing to do with the uncertainty of the mean.
Nor is there anything to do with systematic errors, or any measurement uncertainty.
“The SD is SEM * sqrt(N). The larger you make N the wider the SD becomes!”
If anyone ever thought Tim understood what he was talking about, this statement should be put in front of them at every opportunity.
And it’s the second time he’s said it and he still completely ignores the explanation why it is patently untrue.
It’s the equation you continue to use! Now who is trying to disclaim something he previously claimed to beleive?
It is the SD of the population that determines the distpersion of values attributable to the measureand. If you aren’t using the population SD to calculate the SEM then what you are finding is the dispersion of sample means around the population means.
go here: https://statisticsbyjim.com/hypothesis-testing/standard-error-mean/
It’s a very basic tutorial on the sem. “Again, smaller standard errors signify more precise estimates of a population parameter.” (bolding mine, tpg).
That population parameter is the population mean. But it simply does not tell you the accuracy of that mean. Carefully read that statement again. This time for reading comprehension which you usually fail at. It doesn’t say “more accurate”, it says more “precise”.
The very first experiments to measure the speed of light took lots of measurements and they very carefully and precisely calculated the mean value of that data – AND IT WAS WRONG! They didn’t understand how to properly evaluate the uncertainty of their data. Had they understood that they might have come up with an uncertainty interval that included the true value of the speed of light – a measurement that could have been replicated. All the while trying to reduce the uncertainty with better and better instrumentation and measurement protocols.
You continue to try and convince everyone that the SEM is proper measure of accuracy of a measurand. That simply couldn’t be further from the truth. You cling like a drowning man to a piece of driftwood to view that the SEM is the MOST IMPORTANT piece of information concerning the mean value. It isn’t. Reconcile yourself to that simple fact.
Stop dodging the subject. You claim that increasing sample size increases the population standard deviation. None of your patronizing drivel and insults in anyway addresses that issue.
You keep hand waving the idea of inaccuracy bit you never explain how using the SD rather than the SEM avoids inaccuracy. I keep saying that estimating a SEM does not mean you are accurate. There are lots of ways your SEM calculation may be inaccurate, but that goes just as well for your SD calculation. All your measurements might be identical and the SD is zero, but if you’ve added 1 meter to your tape measure your mean will still be wrong.
“Stop dodging the subject. You claim that increasing sample size increases the population standard deviation. None of your patronizing drivel and insults in anyway addresses that issue.”
It does in the real world where you are combining measurements of different things!
Each measurand represents a different random variable. When you combine random variables their variances ADD! Variance is a measure of uncertainty. The wider the range of values then the wider the variance and thus the peak at the average gets squished down representing an increased uncertainty of the average.
You simply refuse to address measurement in the real world. All you know and all you want to know is that all measurements are 100% accurate and result in a “true value” as indicated by a decreasing SEM.
“You keep hand waving the idea of inaccuracy bit you never explain how using the SD rather than the SEM avoids inaccuracy. I keep saying that estimating a SEM does not mean you are accurate.”
See what we are trying to tell you? You simply don’t care about the accuracy of the mean, only how precisely you have calculated it.
“There are lots of ways your SEM calculation may be inaccurate, but that goes just as well for your SD calculation.”
THAT’S WHAT THE UNCERTAINTY INTERVAL DETERMINED FROM PROPAGATED INDIVIDUAL UNCERTAINTIES IS FOR!!!!!
You should use whichever is larger, the SD or the propagated uncertainty interval.
The SD of the stated values is appropriate if your measurements are more accurate than the variation in the data. Use the propagated uncertainty if the measurements are less accurate than the SD of the stated values.
You don’t even get the fact that the SD itself has uncertainty. When you draw a graph of measurements you use a fine point pencil. It should be drawn with a 1/2″ wide sharpie. See the attached graph. The average is drawn with a 1/8″ wide sharpie representing the standard deviation of the sample means. But the SD represents the ENTIRE population and because of the uncertainty of the individual elements it can only truly be represented using a wide point pencil.
It simply can’t penetrate your religious dogma that the standard deviation of the sample means is a STATISTICAL DESCRIPTOR only. It’s only use is in determining how precisely you have calculated the average. It’s a measure of sampling error, it is *NOT* a metric of the accuracy of anything.
“It does in the real world where you are combining measurements of different things!”
Then prove it. I’ll wait.
But really if you can’t understand why the standard deviation of a population does not depend on the sample size, I could only assume you don’t understand what any of these words mean. Do you think the population has some quantum effect where the act of observation changes it’s distribution?
If you still don;t get it consider your two equations.
SEM = SD / √N
SD = SEM * √N
You are implying that SEM is a constant and so changing N will change SD. Now consider the possibility that SD is the constant, and it’s SEM that changes as N changes. Which do you think is most likely?
You’ve got me intrigued now. The population variance is sum (x_i – x_bar)^2 / N, so it does depend on the size of the population. Samples don’t apply to the population.
The variance of any sample drawn from that population is an estimator of the population variance, and does depend on the sample size.
“The population variance is sum (x_i – x_bar)^2 / N, so it does depend on the size of the population.”
That’s population size, not sample size. And even then in general the size of the population shouldn’t affect the standard deviation. It’s an likely to be an innate property of the population.
“The variance of any sample drawn from that population is an estimator of the population variance, and does depend on the sample size.”
Not really, as the sample size increases the sample standard deviation should tend towards the population standard deviation. Of course, with small samples the randomness of the sample means the sample SD will fluctuate, but it might get bigger or smaller.
However, none of this is to do with what Tim is saying, which is that the population standard deviation increases with sample size. The population SD is fixed, as long as the population doesn’t change. Taking a sample of any size from the population cannot change the distribution of the population.
As I said, “sample” isn’t applicable to “population”. Samples can only provide estimators for the population statistics.
D’oh! Yes, you’re correct in general. There are certain cases where for a given relationship the variance may increase or decrease for a larger population.
That’s why sample size matters.
Mais, oui. That’s pretty much by definition.
Then you have a different population. “Population” seems to be another of those overloaded terms which give rise to ambiguity.
“D’oh! Yes, you’re correct in general. There are certain cases where for a given relationship the variance may increase or decrease for a larger population.”
The size of the population *does* affect the variance when the data is random and independent such as when combining temperatures from different locations and different measuring devices.
The more elements you add to the data set the greater the possible range of values in the data set, i..e the range. The larger the range the higher the variance will be.
Even when measuring the same thing multiple times the larger the variance can become. Bevington covers this in his book on why you can never get the SEM to zero. Random fluctuations will create outliers that cause the variance to go up. As the variance goes up so does uncertainty of the average.
“Then you have a different population”
Yep. That seems to be something that most people don’t understand. Every time you add a data element into the data set the population changes. If the range of the data elements in the new population goes up then so does the variance as well as the uncertainty.
It’s why if you have Tmax with u_max and Tmin with u_min and you combine them into a median, you have a new population. u_max and u_min is no longer the proper evaluation of the uncertainty. It becomes u_max + u_min, the uncertainty of the new data set.
When you divide u_max + u_min by 2 to get an average you are finding the average uncertainty, not the uncertainty of the average. That seem to escape the understanding of the GAT supporters.
That seems more like a sample than a population, and it includes measurement uncertainties.
What is your definition of the “population” here, for various population sizes?
I was thinking more of a functional relationship such as y = 2 * (x % 2), where the value of y alternates between 0 and 2. For any even sized population, the variance is 1.
Strictly, the population doesn’t change, you have a different population. The original population still exists. That’s why step 0 is to define your terms 🙂
The catch-22 here is that it doesn’t really matter if the temperature data base is a sample or a population.
If the data is a population then adding elements will increase the variance. If the data is a sample the it will increase the variance of the sample. If the variance of the population increases the average is less certain. If the variance of the sample increases then its mean is less certain.
But for some reason everyone want to tread the sample means as 100% accurate and never actually consider that each sample has its own uncertainty inherited from the individual elements making up the sample, sometimes sized based on the SD of the distribution (in this case the sample).
It’s just all part and parcel of climate science that knows only one mantra, all measurement uncertainty is random, Gaussian, and cancels.
Therefore every stated value becomes 100% accurate and the only uncertainty is the sampling error as measured by the SEM.
“I was thinking more of a functional relationship such as y = 2 * (x % 2)”
You’ve made the range of values, which determines the variance, a fixed interval, i.e. you’ve set boundaries.
With temperature there are no such boundaries (maybe for the ocean?)
If you add a temperature from McCook to the data set, an independent random variable, you increase the variance of the data set.
It’s why uncertainty adds. Insert more elements with uncertainty and the uncertainty of the data set goes up.
“Strictly, the population doesn’t change, you have a different population. The original population still exists. That’s why step 0 is to define your terms”
I am addressing the temperature data here. If you add a station or remove a station then yes, you have a new population with a new SD and a new uncertainty estimate. But the old population isn’t used going forward, it becomes part of the new population.
bellman likes to keep pushing things into a hypothetical statistics world so he can deflect from the issue being discussed here on WUWT. WUWT isn’t a statistics forum with academics debating using assumed perfect data with no uncertainty. In statistics world you can assume all uncertainty is random, Gaussian, and cancels. In statistics world you can assume *everything* is Gaussian and not skewed so that the average is always a meaningful statistical descriptor. Kurtosis and skewness don’t exist in statistical world.
But we live in the real world of measurements and measurement uncertainty.
For all practical purposes, it makes no difference in their treatment.
If the intent is to calculate “global surface temperature”, the population is the temperature at each point on the globe, approximated to some arbitrary area, and the weather stations comprise a sample of convenience.
Adding elements creates a new population, if the population is defined as “all the weather stations”.
Not necessarily. Adding stations in a milder location such as wet tropics may actually decrease the variance.
Yep, to illustrate the point. There are other equations which will increase the variance with larger populations, and some which have no variance.
Well, there is a lower bound, but it’s not practical. A slightly less impractical lower bound is that of the moon.
There is also the statistical uncertainty. If they’re within an order of magnitude of each other, both need to be considered. So does the uncertainty introduced by the rather idiosyncratic ASOS approach.
What statistical uncertainty?
The standard deviation of the sample means, or
the dispersion of the possible values that could be attributed to the measurand?
They are metrics for different things.
If the standard deviation of the sample means is within an order of magnitude as the possible values that could be attributed to the measurand then you need to consider 1. the validity of your measurements, or 2. the validity of your sampling procedure.
That is a very good question.
Lenssen et al (2019)
https://agupubs.onlinelibrary.wiley.com/doi/10.1029/2018JD029522 uses quite a lot of space to say how good it is, and how land and sea uncertainties are combined, but not how they are calculated.
They appear to use the approach from Menne et al (2018). https://journals.ametsoc.org/view/journals/clim/31/24/jcli-d-18-0094.1.xml#s7
This spends a lot of time on homogenisation, but boils down to SEM
It gets better – check out the measurement error section in Brohan et al (2006) https://agupubs.onlinelibrary.wiley.com/doi/10.1029/2005JD006548
Anyway, the general approach appears to be to use the SEM of the anomalies.
Further to this, what is the theoretical basis for using the SEM instead of the combined uncertainty from the individual weather stations?
Not a surprise, they confuse uncertainty with error, and there is no propagation of uncertainties from intermediate results.
“Then prove it. I’ll wait.”
Eq 10 from JCGM 100:2008
u_c(y)^2 = Σ (∂f/∂x_i)^2 u(x_i)^2 from 1 to N
As N increases the number of uncertainties in the sum grows. As the sum grows so does the uncertainty.
Q.E.D.
THE AVERAGE UNCERTAINTY IS 8NOT THE UNCERTAINTY OF THE AVERAGE!
You have several ingrained assumptions that you can’t seem to shake.
Until you can eliminate these from your mindset you’ll never understand measurement uncertainty.
You keep saying you don’t believe any of this but it just comes through in every assertion you make. You simply can’t get away from them. And you won’t get away from them until you admit to yourself that they part of your mindset and need to be abandoned.
“But really if you can’t understand why the standard deviation of a population does not depend on the sample size,”
SD = SEM * sqrt(N)
You can’t get away from that simple algebraic relationship.
“You are implying that SEM is a constant and so changing N will change SD.”
Think about what you just said. It also applies in the other direction!
You are implying that if N changes the SD won’t change, that the SD is a constant. You have no justification for assuming that.
“You are implying that if N changes the SD won’t change, that the SD is a constant. ”
I’m not just implying it, I’m explicitly stating it.
The standard deviation of a population cannot change unless the population changes. Taking a sample does not change the population.
The fact that you cannot understand this, should say everything about your claims to expertise in this. You just don’t seem to understand it care what these terms mean.
Isn’t N the population? What am I missing?
I realize that SD might even increase if the population adds have different distributions than those of the old population. But the sqrt(N) contribution will nevertheless continue to reduce the SEM.
Again, Bellman, what am I missing? Am I misunderstanding the definitions?
It also increases the standard deviation – the possible values that can be reasonably attributed to the measurand.
Not necessarily. If the contributors to the population have identical distributions, then random samplings of it approach the SD as the population increases, If the contributors to the population have differing distributions, then random samplings of it will go up and down, until you have enough samples to have repetitions of those changed distributions to establish a stable SD. Either way, sqrt(N) tends to predominate SEM evaluations.
Is this where you vapor lock?
“ then random samplings of it will go up and down, until you have enough samples to have repetitions of those changed distributions”
How do you get that when combining distributions from the NH and the SH? The distributions will never (at least very seldom) overlap. Or how will distributions from the daytime sinusoid overlap with the distributions from the exponential decay of the nighttime? How do you get that from coastal distributions combined with inland distributions? How do you get that from distributions on the east side of a mountain vs the west side of a mountain?
It’s not just the shape of the distribution but its absolute range and variance that must also be considered.
What you are describing is sampling of a population – where the sample means tend to a normal distribution. But the distribution of the sample means have nothing to do with the possible values reasonably attributable to the measurand. It only describes your sampling error.
He won’t answer, or hand-wave about systematic magically becoming random.
“Isn’t N the population? What am I missing?”
I’m assuming N is the sample size. It’s difficult to be sure as Tim keeps changing his definition to suit his purpose, but this starts from saying that as
SEM = SD / √N then
SD = SEM * √N
and so, he claims the SD of the population increases as the sample size increases.
“I realize that SD might even increase if the population adds have different distributions than those of the old population.”
Which is why I say the SD of the population does not change as long as the population does not change. The purpose of taking a sample is to estimate the details of the population, not to change the population.
“But the sqrt(N) contribution will nevertheless continue to reduce the SEM.”
Which is the point Tim keeps missing.
Thanks Bellman. My question takes nothing away from the validity and relevance of your facts.
Like my carburetive reference “vapor lock”? It ages me, but I think I’ll use it again, where applicable…
Of course it does. The calculation is correct.
If you cannot measure the entire population, you take samples. From the samples you can, via the CLT obtain a sample means distribution that provides an estimated mean and an estimated standard deviation of the mean.
The population standard deviation can then be calculated by using the formula:
SD = SEM * √N
The theory is that with the correct sample size AND multiple samples will reduce sampling error and provide a smaller and smaller SEM.
Therein lies the problem with your previously stated assumption that you have one large sample consisting of all the stations. Doing this prevents one from creating a sample means distribution consisting of the individual mean of each sample.
The standard deviation of individual samples in no way is a good estimate of a sample means distribution standard deviation. A single mean of one sample is not a good estimation of the sample means distribution mean. Therefore, it is not a good estimation of the population mean either.
There is only one situation that allows you to make an assumption that the mean and SD of one sample are good estimates and that is when your “sample” is the population also. In which case why bother doing sampling calculations.
Where did you learn statistics?
“If you cannot measure the entire population, you take samples”
Again, it doesn’t make sense to do that, but you could.
“The population standard deviation can then be calculated by using the formula:”
I’m not disagreeing with any of that. But your problem is that does not mean the SD will increase with sample size. What should happen is that as you increase sample size the SEM will get smaller, which will cancel out the multiplication by √N. Take lots of samples all of size 25, and you might find the standard deviation of all your sample means is 4, so you estimate the population standard deviation is 5 * 4 = 20. Now take samples of size 100, and you find the standard deviation of your sample means is 2. Multiply that by √100, and you get 2 * 10 = 20.
“Doing this prevents one from creating a sample means distribution consisting of the individual mean of each sample.”
And you still don’t get that, a) that’s not how you do sampling. and b) the temperature record of all stations is not a random sample. You cannot just take the average of all the stations and assume it’s close to the actual global average. There’s much more work involved.
If you do want multiple samples from the stations, you can simulate it, that’s what bootstrapping is. Just take random samples of all the station data, a large number of times, and look at the standard deviation of that. Better yet, you can use the distribution of those means to get a possibly better estimate of any given confidence interval. But that still ignores the fact that the station data is not random in the first place.
“The standard deviation of individual samples in no way is a good estimate of a sample means distribution standard deviation.”
Statistics would tell you differently. People didn’t just make up the formula for the SEM. The issue you might be referring to is the estimate of the SD from the sample, and that can introduce uncertainty with small sample sizes. But that’s another reason why you want a large sample size.
“There is only one situation that allows you to make an assumption that the mean and SD of one sample are good estimates and that is when your “sample” is the population also.”
It’s so hypocritical that you will keep saying I’m not allowed to point out the flaws in your understanding of measurement uncertainty as I have “no real world” experience of measuring things in a laboratory – yet you are quite capable of telling every statistician and mathematician over the last 200 years that they don’t know what they are talking about.
“Where did you learn statistics?”
A,ll over the place for the last 50 years or so. I’ve learnt much of it by having to explain to you why you are wrong.
Let’s get back to uncertainty.
You don’t realize it but you just outlined the reason that the SEM is not a good description of the dispersion of values attributable to the measurand, i.e., the standard deviation.
The dispersed values as defined by the interval of the standard deviation DO NOT change and certainly DO NOT decrease through sampling. However the SEM interval DOES decrease in value based upon sampling, i.e., it no longer describes the dispersion of values attributable to the measurand.
This NIH document says it succently.
https://www.ncbi.nlm.nih.gov/pmc/articles/PMC2959222/#
This what you are arguing for this explains why you are wrong.
You have yet to do as I asked and respond with an answer. Why?
I also told bdgwx to do this also and he has never responded either.
That should give you an idea about giving up dividing by √n.
Can it be made any clearer than what the NIH has written?
I think not.
Looks pretty darn clear to me.
But then, bellman has a problem with reading comprehension. So there’s no telling!
The letter is very clear. It’s saying some papers are using the SEM and implying it’s the standard deviation. If that’s true then they are wrong. That does not mean the SD should be used in place if the SEM, as you seem to want. That would be just as wrong.
No one is wanting to substitute the SD for the SEM. You, however, want to substitute the SEM for the SD.
The SD describes the dispersion of values around the mean that can be reasonably attributed to the measurand.
The SEM describes the dispersion of values around the mean that can reasonably attributed to the mean.
The SEM tells you about how precisely you have calculated the mean.
The SD tells you about the uncertainty of the measurement of the measurand.
If you try to substitute the SEM for the SD because it is a smaller value and makes your analysis “look better”, you are lying to whoever looks at your analysis. That’s what the NIH is pushing today because medicine has been caught too often lying about the efficacy of their product by using the SEM instead of the SD – and it affects HUMAN LIVES.
“You don’t realize it but you just outlined the reason that the SEM is not a good description of the dispersion of values attributable to the measurand, i.e., the standard deviation.”
The SEM is not the standard deviation if that’s what you mean. It the standard deviation of the sampling distribution of means. All this is doing is going round in the predictable circles. I’m saying if you want to know the uncertainty of the mean, then the SEM / SDOM or whatever you want to call it is the place to start. Because it describes the range of values the mean is likely to have.
You think the standard deviation of the population is the true uncertainty of the mean. This is to me playing with words. You can think of the standard deviation as an uncertainty that is associated with the mean, in as far as the mean is usually the central point of the dispersion of values you get that where used to make up the mean. It tells you the uncertainty as to what the next value you pick will be. And that’s often a very useful thing to know.
But it is not the uncertainty of the mean. It does not tell you how certain you are that your estimate of the mean is close to the actual mean. And if you are actually interested in how good your mean is, that’s the value you need.In particular, that’s the type of uncertainty you need to do hypothesis testing. You want to know if two populations are different.
Take this with global temperatures. The standard deviation will tell you the dispersion of all temperatures around the globe. But the uncertainty of the mean (however calculated) is the value you need if you want to see if this years temperature is warmer than last years.
“The dispersed values as defined by the interval of the standard deviation DO NOT change and certainly DO NOT decrease through sampling.”
Which is what I’ve been telling you. Now you agree, but do Tim and carlo, or are we going to have keep going through this merry dance for all eternity?
“However the SEM interval DOES decrease in value based upon sampling, i.e., it no longer describes the dispersion of values attributable to the measurand.”
Again, I think you are confusing what ” the values that could reasonably be attributed to the measurand” means.
“This NIH document says it succently.”
And again, how many times have we been through this one document?
If people are suggesting or thinking the SEM is a description of the dispersion of the data, that that is very wrong, and dangerous. It does not mean the dispersion of the data is the uncertainty of the mean.
If you are giving a drug to a [patient, you need to know the range of safe doses, that is not the uncertainty of the mean. If you are conducting a controlled experiment to see if a drug is more effective than a placebo, you need to know the uncertainty of the mean, not the dispersion of all results. (which is not to say knowing the range of results isn’t useful information, but it won;t let you conclude the treatment is effective.)
“You have yet to do as I asked and respond with an answer. Why?”
How much time I waste trying to explain basic maths to you, yet every time I miss just one of your infinitude of questions you’ll claim it’s because I refuse to answer. But in this case I think I did answer it – here
https://wattsupwiththat.com/2024/01/03/uah-global-temperature-update-for-december-2023-0-83-deg-c/#comment-3843883
You probably didn’t agree with the answer, but don’t claim I ignored it.
I’m going to ask you the same question I asked Bill Johnson.
You are the chief engineer in charge of the o-ring that failed in the Space Shuttle Challenger disaster.
The investigating committee comes to you and asks you how you evaluated the operational characteristics for that o-ring.
Are you going to answer:
Your answer will determine the track of the rest of your life.
“I calculated the mean of 1000 observations out to the 1×10^-6 digit with an uncertainty of 1x 10^-7”
Why in earth would I do that? The issue is nothing to do with the average size of the ring, it’s to do with tolerance.
And how and why would you calculate anything to a million decimal places. I get the feeling you never understand how quickly these numbers become meaningless. You would only need a few digits to know the size to the nearest atom.
“I calculated the dispersion of values that could be reasonably assigned to the o-ring based on 1000 observations.”
Doubt that’s much use either. What you need to know is what the maximum possible deviation is, to whatever the agreed tolerance is.
But if I recall correctly none of this was what caused the disaster. The problem was the specifications were too tolerant. The rings were within tolerance levels, but that didn’t take into account the pressures and temperatures they were subjected to. Ultimately it was more todi with finance though. People had raised the issues but management decided it wasn’t a problem compared with the cost of fixing the problem.
Do you have any more sick accusations you want to level at me? Am I going to be responsible for the Titanic, or the R101?
“Why in earth would I do that? The issue is nothing to do with the average size of the ring, it’s to do with tolerance.”
It’s what you are suggesting is the accuracy of the mean!
“Why in earth would I do that? The issue is nothing to do with the average size of the ring, it’s to do with tolerance.”
Then why are you so adamant about the SEM being a measure of the uncertainty of the measuand?
“And how and why would you calculate anything to a million decimal places.”
Your lack of training in ANY aspect of physical science is showing again. 10^-7 is *NOT* a million decimal places! Go look up scientific notation.
“Doubt that’s much use either. What you need to know is what the maximum possible deviation is, to whatever the agreed tolerance is.”
Why do you think that in things that affect human lives 2*SD or even 3*SD is used to describe the measurement uncertainty of the measurand. NOT THE SEM?
“The rings were within tolerance levels, but that didn’t take into account the pressures and temperatures they were subjected to.”
There were actually two failures, the joint the o-ring sealed flexed too far and the o-ring didn’t have enough malleability to seal the flex.
But this is just a distraction. The *real* issue is that you wouldn’t use the SEM to specify what characteristics of the meaurrand but, rather, the dispersion of the values that could reasonably be assigned to the measurand.
Why would you say different for the GAT? That the SEM is the proper metric for the uncertainty instead of the dispersion of values possible for the measurand?
“It’s what you are suggesting is the accuracy of the mean!”
Please stop lying about me. If you don’t understand the distinction between wanting to know the uncertainty of a mean, and wanting to know the tolerance interval, I would suggest you are not the expert you claim to be.
If all o-rings need to be within a certain size range you need to know the deviation of all rings, not the average.
“Then why are you so adamant about the SEM being a measure of the uncertainty of the measuand?”
It’s a measure of the uncertainty of the mean. If you want to call it a measurand that’s up to you.
“Your lack of training in ANY aspect of physical science is showing again. 10^-7 is *NOT* a million decimal places! Go look up scientific notation.”
Sorry, I missed the minus sign. You keep talking elsewhere about the average going out to the millionth digit. Regardless, giving these are rubber rings, I doubt you would want to know the size to that level of precision. Assuming you are measuring in meters, 10^-7 is 0.1 μm. That’s about a tenth the size of a bacterium.
“Why do you think that in things that affect human lives 2*SD or even 3*SD is used to describe the measurement uncertainty of the measurand.”
What measurand? Again, nobody cares about the average value of something when building rockets, or anything else. You are yup to you usual strawman tactics. You need to know the uncertainty of any measurement you make. The measurand is the individual component.
“But this is just a distraction.”
Your the one who keeps raising these distractions. If you want to talk about the uncertainty of the mean, use examples where the uncertainty of the mean matters.
“The *real* issue is that you wouldn’t use the SEM to specify what characteristics of the meaurrand“
Writing this in bold does not make it any more true.
You should use the SEM when the mean is the measurand you want to characterize. If you don;t like calling it a measuarnd then don;t, but you still want to know how certain you are of the mean’s precision and accuracy.
“ rather, the dispersion of the values that could reasonably be assigned to the measurand.“
One day yopu’ll actually use the GUM definition by accident. You do not “assign” things to the measurand. The wording is ” the dispersion of the values that could reasonably be attributed to the measurand”.
You have some convoluted interpretation of that – but to me the obvious meaning is the range of values that it would be reasonable to belief the measurand could have. Not the range of values that went inot determining the measurand.
Jim: ““If you cannot measure the entire population, you take samples””
bellman: “Again, it doesn’t make sense to do that, but you could.”
ROFL!! So every unit off of a production line should be measured for quality? Where did you get your quality engineer training?
“But your problem is that does not mean the SD will increase with sample size.”
The population SD increases every single time you add an element. So does the sample SD. If you are adding/removing stations from the population (i.e. the temperature data base) then you should also be redoing your sampling, but I’m not sure what samples you are speaking of in that case.
If the temperature data base is a sample and you add/remove elements to it then its SD *will* change since the variance will change. And if its SD changes the that in an indication that the population SD changed as well or the sample SD wouldn’t have changed.
You’ve put yourself in a Catch-22 situation. You are damned if you do and damned if you don’t.
“I’m not just implying it, I’m explicitly stating it.”
So as you add independent, random variables to the data set the range will never change?
ROFL!!!
“The standard deviation of a population cannot change unless the population changes. Taking a sample does not change the population.”
What in Pete’s name do you think “N changes” MEANS?
The more stations you add to the data set the more N changes! That’s the same thing as making your sample larger! If you want to make the SEM smaller then you have to use LARGER samples, meaning N changes! And that means the SD will change!
“The fact that you cannot understand this, should say everything about your claims to expertise in this. You just don’t seem to understand it care what these terms mean.”
You’ve started on the bottle early today apparently. You can’t even be consistent about N growing being the same thing as adding independent, random variables into a data set. According to you the range of values in the data set will never change when you do that and that N will stay the same!
Unfreakingbelievable!
“So as you add independent, random variables to the data set the range will never change?”
What range? You were talking about SD being the population standard deviation. That does not change by taking a sample.
If you now want it to be the sample standard deviation, then it will change as you change sample size, it might get bigger or it might get smaller, it’s random. What it should do as N increases is converge to the population SD.
“What in Pete’s name do you think “N changes” MEANS?”
Ok. You need to explain exactly what you think N is, becasue I’m assuming you mean sample size, as in SEM = SD / √N, but now you seem to think it’s about the population size.
“The more stations you add to the data set the more N changes!”
But if you are talking about a global temperature average, the stations are not the population, they are a sample of the population. The population is the entire surface of the globe.
“If you want to make the SEM smaller then you have to use LARGER samples, meaning N changes!”
Which is what I’ve been trying to tell you. The SEM gets smaller, the population SD does not get bigger.
“You can’t even be consistent about N growing being the same thing as adding independent, random variables into a data set.”
They are added to the sample, not the population.
“According to you the range of values in the data set will never change when you do that and that N will stay the same!”
Which data set? If you mean the sample of all stations, than adding more may well change the sample SD, but that is not changing the global temperature distribution. And it is just as likely that it will decrease the sample SD, not increase it. And you are now confusing range with standard deviation.
“What range? You were talking about SD being the population standard deviation. That does not change by taking a sample.”
So the temperature data bases are a population and not a sample? When you add or subtract stations from the population what happens to the population SD?
“Ok. You need to explain exactly what you think N is, becasue I’m assuming you mean sample size, as in SEM = SD / √N, but now you seem to think it’s about the population size.”
You have no idea what *anyone* is talking about. So why should I be surprised that you don’t know what I am talking about.
Should the sample SD represent the population SD?
“But if you are talking about a global temperature average, the stations are not the population, they are a sample of the population. The population is the entire surface of the globe.”
So now the temperature data bases are a sample. So are you talking about taking samples from a sample? If the temperature data bases are a sample then what happens to N when you add or remove stations from the sample?
“Which is what I’ve been trying to tell you. The SEM gets smaller, the population SD does not get bigger.”
You are so lost in the weeds you can’t keep things straight!
How does the SEM get smaller of the temperature data base THAT IS A SAMPLE? From adding more values into the sample? What happens when you add more values into the sample? Does the sample SD stay the same or does it change because N changed?
It would appear that you want the temperature data bases to be both a sample *AND* a population. You want your cake and to eat it too!
Pick one and stay with it. Are the temperature data bases samples or a population. What happens to a population SD when you add random variables into the data base? What happens to the sample SD when you add elements into the sample?
“They are added to the sample, not the population.”
But you just said the temperature data bases are a sample! What happens to the population SD when you add elements? What happens to the sample SD when you add elements into the sample? Isn’t the sample SD supposed to mimic the population SD? If it doesn’t then how good is the sample?
You are chasing your tail trying to rationalize what you’ve said.
“If you mean the sample of all stations”
What sample of all stations? Are there smaller temperature data bases out there that are samples of the larger data bases? What are they?
“that is not changing the global temperature distribution”
What global temperature distributions? You mean like Berkeley Earth? UAH? GISTemp?
Or are these samples of the global temperature? If they are samples of the global temperature then what happens to them when you add /remove stations? Does their SD change? Does the SEM change? Does everything just remain the same regardless of N?
“So the temperature data bases are a population and not a sample?”
Of course not. Why would you think that.
I mean you could use them as a population, but then it wouldn’t mean much, and there would be little uncertainty.
“When you add or subtract stations from the population what happens to the population SD?”
OK, for the sake of argument lets say we want to use the set of all available stations as a population. adding or removing additional stations should have next to no effect on the SD – providing all are random. I.e. each station is a value taken from a completely random part of the globe. Of course, adding or taking away stations changes the population, so there isn’t much point doing it.
“You have no idea what *anyone* is talking about. So why should I be surprised that you don’t know what I am talking about.”
And there’s that familiar tactic of throwing out an insult to avoid answering the question.
What do you mean by N in the equation SD = SEM * √N? Is it the sample size, or is it the number of values in the population? If it’s the later what happens when the population size is infinite?
“Should the sample SD represent the population SD?”
It should. How well it does that it is going to depend on sample size.
“So now the temperature data bases are a sample.”
Of course. I really don;t know why you would think differently – except as you keep demonstrating you have very weird ideas about statistics.
“So are you talking about taking samples from a sample?”
Why should you – you’ve got the one sample. That’s what you need.
(Should say that often uncertainty analysis can be based on re-sampling, but I doubt that’s what Tim means).
“If the temperature data bases are a sample then what happens to N when you add or remove stations from the sample?”
It goes up or down.
“How does the SEM get smaller of the temperature data base THAT IS A SAMPLE?”
If N increases the SEM goes down. This really shouldn’t be a difficult concept.
SEM = SD / √N.
Increasing the size of you sample, means that SD / √N is a smaller number. The only way that won’t happen is if by some chance your sample SD estimate increased, but that’s not generally going to happen becasue the sample SD is tending to the population SD as N increases, and the population SD is by definition fixed.
“Does the sample SD stay the same or does it change because N changed?”
Let me test this for you. Here I’ve generated a list of 1000 random numbers all from the same normal distribution, with an SD of 1. I’ll add each number to the sample one by one and take the new sample SD.
Here’s the graph showing the changing SD with each added value. It starts of quite erratic, but converges to the SD of 1.
Where did you learn sampling theory. A single sample does not represent the population SD except under one condition, a normal population and a normal sample with the same μ and SD as the population. Otherwise, you need multiple samples to develop a sample means distribution. The SD of the sample means distribution is the SEM and the equation that relates the SEM to the population SD is:
SD = SEM * √n
As to one large sample of all the stations, you need to show that the distribution in the sample is normal at the very least. If it is not, then you cannot assume that the population is also normal. In other words, there is sampling error.
The other insane assumption is that the SEM is the SD of a sample divided by the √n. The SEM is the population SD divided by the √n, and not the sample SD divided by √n.
If you call all the stations you have, one single sample, you just screwed yourself out of dividing by √n.
You really don’t understand why NIST TN 1900 called the daily Tmax, separate measurements of the same measurand do you?
“Where did you learn sampling theory.”
Why do you keep trying to bring this down to an ad hom argument. It doesn’t matter where I learnt stuff – but I keep telling you it’s from all overt he place – a life long interest in the subject, and much learnt just trying to figure out why you are so wrong.
I won’t ask where you learned any of your knowledge becasue they might sue for defamation.
“A single sample does not represent the population SD except under one condition, a normal population and a normal sample with the same μ and SD as the population.”
Unsupported assumptions and gibberish. A sample will tend to have the same distribution of the population from which it was taken. The larger the sample the closer it should be. The SD of the sample should tend towards the SD of the population, as will the mean, the skewness and any other descriptive statistic. In no way does that depend on the distribution of the population being normal.
And, as I keep saying, you don’t have to take my word for it. It’s easy to demonstrate just by generating random numbers.
“As to one large sample of all the stations, you need to show that the distribution in the sample is normal at the very least.”
Completely wrong.
“If it is not, then you cannot assume that the population is also normal.”
I’m not assuming the population is normal. In fact, if you are taking about global temperatures, I’m pretty sure it isn’t normal.
“The other insane assumption is that the SEM is the SD of a sample divided by the √n.”
What you call insanity is something that has been described and used for well over 100 years. By all means show us why everyone who has used it, proven it, and explained why it must be so is wrong. But the onus is very much on you to prove it. Hand waving about normal distributions, and some weird believe that you can increase the Sd of the population by increasing sample size, just doesn’t cut it.
“The SEM is the population SD divided by the √n, and not the sample SD divided by √n.”
And if you don’t know the population SD, you have to use the sample SD as the best estimate. How good that is will depend on sample size.
You do realize that this “insanity” is exactly what the GUM is doing when it bases the “experimental standard deviation of the mean” on the “experimental standard deviation” of a number of measurements? And it’s the same as the NIST TN1900 example, based on the standard deviation of just 22 daily values?
“If you call all the stations you have, one single sample, you just screwed yourself out of dividing by √n.”
As I keep saying I doubt any actual uncertainty analysis does that. The stations are not a random sample. But in principle that’s exactly what you can do if you have a random selection of stations across the globe. The SD of the sample of 10000 or so stations is not likely to be very much different tot he population SD.
“You really don’t understand why NIST TN 1900 called the daily Tmax, separate measurements of the same measurand do you?”
Go on then. You enlighten me – if it’s insane to use the sample SD as an estimate of the population SD, why is it OK if you first describe the sample as a sample of measurements of the same measurand, rather than a random sample for a population? Please, no hand-waving, I want to see your actual mathematical proof.
“u_c(y)^2 = Σ (∂f/∂x_i)^2 u(x_i)^2 from 1 to N”
Here we go again. What is ∂f/∂x_i when f is (x_1 + x_2 + … + x_n) / n?
I don’t expect a correct answer.
The average of a data set is *NOT* a measurand no matter how much you wish it were. It is a statistical descriptor. You calculate the SEM, another statistical descriptor, to find how precisely you have calculated the average.
A measureand is a PHYSICAL quantity according the GUM.
The average inherits the uncertainty of the data set.
These clowns are magicians playing Three-Card Monte.
“The average of a data set is *NOT* a measurand no matter how much you wish it were.”
Then why keep going on about equation 10? If it’s not a measurand, what is your justification for continuously quoting the GUM uncertainty definition? Just how do you propose you calculate the measurement uncertainty of something you claim cannot be measured?
“When you combine random variables their variances ADD!”
I keep pointing this out, but you are equivocating on the word “combine”. How are you combining these variables? What type of combining allows you to add variances?
Spoiler:
The only type of combination that adds variances, is adding the variables. Mixing variables, multiplying variables, and scaling variables all have different results.
In particular if you scale a variable by a constant C, the variance has to be multiplied by C^2. Of course, this means if you add any number of variables and then divide by N, the result will be the some of the variances divided by N^2. Guess what that means when you take an average of IID random variables.
“All you know and all you want to know is that all measurements are 100% accurate and result in a “true value” as indicated by a decreasing SEM.”
How can you get so many lies into a single sentence?
“You simply don’t care about the accuracy of the mean, only how precisely you have calculated it. ”
A lie immediately followed by you quoting me saying there are lots of ways the mean may be inaccurate regardless of the SEM.
“THAT’S WHAT THE UNCERTAINTY INTERVAL DETERMINED FROM PROPAGATED INDIVIDUAL UNCERTAINTIES IS FOR!!!!!”
All caps and 5 explanation points. But I still can’t here you becasue you forgot to set it to bold.
Still no idea why you think incorrectly propagating uncertainty will make up for the inaccuracies in your measurements.
“When you draw a graph of measurements you use a fine point pencil. It should be drawn with a 1/2″ wide sharpie.”
How old where you when the teacher told you this?
“I keep pointing this out, but you are equivocating on the word “combine”. How are you combining these variables? What type of combining allows you to add variances?”
This has been given to you many, many times and yet you can’t seem to get it into your memory.
Temperature’s are random variables and are independent. Thus they follow the general rule that Var(X,Y) = Var(X) + Var(Y). How many textbooks need to be quoted to you before you believe it?
As you combine independent random variables the range of values in the data set will grow. As the range grows the variance grows. This is the very definition of what happens as you stick more and more temperatures taken from different measurands by different measuring devices.
“The only type of combination that adds variances, is adding the variables. Mixing variables, multiplying variables, and scaling variables all have different results.”
“In particular if you scale a variable by a constant C,”
Why are you scaling anything? Shifting distributions on the x-axis by adding/subtracting C doesn’t change the distribution. Shifting distributions on the y-axis by adding/subtracting C doesn’t change the distribution.
Why would you multiply by C? Why would you scale anything to do with tempeatures?
Scaling is *NOT* the same thing as adding independent random variables. As usual you are trying to distract into a side issue in order to avoid addressing the actual issue.
“How can you get so many lies into a single sentence?”
It comes through in every thing you say. You even ask me who told me to use a broad line to represent uncertainty in a distribution – meaning you *do* believe that there is no uncertainty associated with the elements of a distribution – they are 100% accurate. You simply can’t get away from that ingrained assumption.
“Still no idea why you think incorrectly propagating uncertainty will make up for the inaccuracies in your measurements.”
Equation 10 of the GUM applies. It is a sum of uncertainties in a data set. You will never believe that but it is the truth. It *IS* the correct way to propagate uncertainty. The more uncertain terms you add to the sum the larger the uncertainty grows. It couldn’t be more simple. Even a six year old understands that when you add a block to the pile that the number of blocks grow – but apparently you don’t understand it.
Talking to a brick wall latest
Me: “I keep pointing this out, but you are equivocating on the word “combine”. How are you combining these variables? What type of combining allows you to add variances?”
Followed by endless diatribe that when you combine variances you always add the variance.
I’ll answer the question for you. When you add random variables you add their variances. That does not mean you simply add the variance when you are doing other sorts of combining.
What happens when you scale a random variable – e.g divide it by a constant? I don’t expect an answer so I’ll give to you. Whenever you scale a random variable the multiply the variance by the square of the scaling factor.
What does this mean if you combine N random variables by averaging them? You can just add the variances to get the sum, and then divide that sum by N^2.
“Why are you scaling anything?”
Pay attention. Because we are taking an average.
“Shifting distributions on the x-axis by adding/subtracting C doesn’t change the distribution.”
Scaling is not shifting on the x-axis. That would be adding a constant. When you scale a variable the entire distribution is stretched or shrunk along the x-axis.
“Shifting distributions on the y-axis by adding/subtracting C doesn’t change the distribution.”
My your particularity dense today. The y-axis doesn’t change, just the distribution along the x-axis.
“Why would you multiply by C? Why would you scale anything to do with tempeatures?”
Because you are taking an average.
Why do you want to just add temperatures. Don’t you realize they are an intensive property?
“As usual you are trying to distract into a side issue in order to avoid addressing the actual issue.”
The “side” issue being the difference between summing and averaging.
“meaning you *do* believe that there is no uncertainty associated with the elements of a distribution”
Meaning I think it’s silly to represent uncertainty by using a thicker pen.
“they are 100% accurate”
Why would you think that? No measurement is going to be 100% accurate.
“Equation 10 of the GUM applies.”
I’m glad you agree. Now if only you could figure out how to do a partial differentiation, you would see it give the same result as averaging random variables.
“It couldn’t be more simple. Even a six year old understands that when you add a block to the pile that the number of blocks grow – but apparently you don’t understand it. ”
If only you could have explained all this to everyone who’s worked out how to calculate the SEM correctly. I’m sure they will be very impressed by how much better you understand how to combine random variables than they did. Or maybe you should just consider that quote you like to throw out – “…you are the easiest person to fool.”
“I’ll answer the question for you. When you add random variables you add their variances. That does not mean you simply add the variance when you are doing other sorts of combining.”
What are you doing every time you add a temperature measurement into the temperature database BUT ADDING RANDOM VARIABLES?
Why are you SCALING anything to do with temperature?
All you are doing is trying to deflect the issue at hand onto something totally unrelated. That makes the rest of your rant meaningless!
“Pay attention. Because we are taking an average.”
Averages don’t scale anything! The average is a statistical descriptor of a data set. Calculating an average changes nothing in the data set!
“Why do you want to just add temperatures. Don’t you realize they are an intensive property?”
Because that’s what they do to get the GAT! Trying to add intensive properties is just one more reason the GAT is garbage. You are the one trying to support the GAT as being a usable metric, not me!
“Why would you think that? No measurement is going to be 100% accurate.”
Then why not represent that inaccuracy as a wide line? Because it is inconvenient for you?
” Now if only you could figure out how to do a partial differentiation, you would see it give the same result as averaging random variables.”
This from the guy that didn’t understand the partial differentiation is a weighting factor? And you didn’t even understand that Possolo was using relative uncertainty because the functional equation involved division?
*I* am the one that had to show you how this works. And then you accused me of not knowing what I was talking about – even when I laid the algebra out specifically for you!
If *you* had understood partial differentiation and how to do uncertainty you would have understood why R^2 becomes a weighting factor. But you simply couldn’t believe that till you had your nose rubbed in it!
“If only you could have explained all this to everyone who’s worked out how to calculate the SEM correctly.”
You are like an intractable puppy who can’t learn from having his nose rubbed in it. The SEM does *NOT* tell you anything about the possible values that can be reasonably attributed to the measurand.
How many times do you need your nose rubbed in this before you accept it?
“*I* am the one that had to show you how this works.”
You really have no idea of what you don’t know.
You told me the differentiation of x/n is 1. You told me the differentiation of x^2 is 2.
You keep demonstrating to anyone with the slightest clue about calculus that you just don;t understand it – but your that won’t stop you patronizing anyone who tries to correct you.
“But you simply couldn’t believe that till you had your nose rubbed in it!”
See. Your ego won’t allow you consider that your keep misunderstanding this, and the fact you don’t understand this means you can’t see why you were wrong.
So before you keep claiming victory from a position of ignorance – just answer my question.
If y = (x1 + x2) / 2, what is ∂f/∂x1 and ∂f/∂x2?
If you think I am wrong, show your workings, put your analysis to the test, rather than just bring in different equations like the volume of a water tank.
“The y-axis doesn’t change, just the distribution along the x-axis.”
If it helps, he’s a graph illustration a normal distribution, along with a doubling and halving of x.
Look at the attached image from the GUM.
Look at the top left diagram closely. See the text that says:
It does not mention the standard uncertainty of the mean does it?
Did you actually expect an answer?
“It does not mention the standard uncertainty of the mean does it?”
“In order to calculate the SEM you have two possibilities.
1. You know the SD and know the size of your sample, which is the size of the population since you also know the population mean..
2. You take multiple samples and find the standard deviation of the sample means.”
Or maybe option 3, the one every source on the subject will describe. You take a single sample, use the sample standard deviation as an estimate of the population standard deviation and divide by the square root of the sample size.
“Jim follows the NIST BY USING THE NIST ASSUMPTIONS! Assumptions which you adamantly refuse to repeat.”
Tim is really the sort of man who assumes that if people don’t agree with him it must be because he’s not shouting loudly enough.
I use the NIST example because it results in an uncertainty that is both large and so far, unassailable as a reasonable value far above what you and climate science claim.
All you need to do is refute NIST’s method and show yours is better.
Don’t need to, the GUM has a good diagram. Look at the image and say which has a better dipiction of the dispersion of measured values attributable to the measurand.
“I use the NIST example because it results in an uncertainty that is both large...”
You just said the quite bit out loud.
“unassailable as a reasonable value far above what you and climate science claim.”
You see a ±2°C uncertainty and your eyes light up and think you can use that to bash the usefulness all data sets. You just don’t realize that there’s a world of difference between the uncertainty of one month at one station, with incomplete data, and a global anomaly estimate.
“All you need to do is refute NIST’s method and show yours is better.”
You keep saying that no matter how many times I use the “NIST method”, whilst Tim keeps saying I shouldn’t be using it.
“Don’t need to, the GUM has a good diagram.”
Again, how is that showing the uncertainty of monthly or annual temperature measurements at Topeka. All you are doing is showing a graph illustrating that the uncertainty of the mean is smaller than the standard deviation of the measurements.
“Look at the image and say which has a better dipiction of the dispersion of measured values attributable to the measurand.”
This is just equivocation. The uncertainty of the mean is not “the dispersion of measured values attributable to the measurand.”, it’s “the dispersion of the values that could reasonably be attributed to the measurand“.
That’s why when they calculate the uncertainty of the mean it’s the standard deviation of the measurements divided by the root of the number of measurements. Depicted in the graph as the dark strip in the middle. The one defined by t ± s(mean t).
I agree it’s a clumsy wording, and allows you to equivocate on the meaning of “be attributed to”. You are trying to use it in the sense of “a value is caused by the mean”, rather than “a value is characteristic of the mean”. But your interpretation makes no sense in the context of uncertainty, and is directly refuted by the example you use. They specifically say the uncertainty of the mean is the standard deviation of the sample divided by √20. They do not say that the standard deviation better represents the true uncertainty of the mean.
“This is just equivocation. The uncertainty of the mean is not “the dispersion of measured values attributable to the measurand.”, it’s “the dispersion of the values that could reasonably be attributed to the measurand“.”
This says it all.
You *still* haven’t internalized the fact that the average is *NOT* the true value. The GUM states explicitly that they have abandoned the concept of “true value +/- uncertainty”. BUT YOU HAVEN’T.
“ But your interpretation makes no sense in the context of uncertainty, and is directly refuted by the example you use. They specifically say the uncertainty of the mean is the standard deviation of the sample divided by √20. They do not say that the standard deviation better represents the true uncertainty of the mean.”
I ask you again. LIST OUT ALL THE ASSUMPTIONS MADE IN TN1900 EXAMPLE 2.
List out every single one.
My guess is that you ether can’t or won’t. You are a champion cherry-picker with absolutely no understanding of context. Having to list out out all the assumptions made by Possolo would require you to admit that what he did was a teaching example and is *NOT* applicable in the real world.
Where did I use the term true value? I said the average is the measurand. By definition that is a true value as the GUM states.
As always you are just trying to dodge the point. The question is what you think “could be attributed to” means.
The average IS NOT A MEASURAND. It is a statistical descriptor for a distribution of data.
The GUM states that it is moving away from the concept of true value and error because the true value can never be known.
JCGM 100;2008 “Although these two traditional concepts are valid as ideals, they focus on unknowable quantities: the “error” of the result of a measurement and the “true value” of the measurand (in contrast to its estimated value), respectively.” (bolding mine, tpg)
As usual, you only cherry pick from things with no actual understanding of the context.
As KM keeps telling you: UNCERTAINTY IS NOT ERROR.
You’ve been asked to write that down 1000 times on paper or a blackboard. Have you ever actually done that?
Until you and bob get that simple concept into your heads you are NEVER going to understand metrology as it is practiced today.
“The average IS NOT A MEASURAND. It is a statistical descriptor for a distribution of data.”
And the wheel turns full circle again. If the average is not a measurand, stop going on about the measurement uncertainty. If it’s not a measurand the GUM has nothing to say about it.
A measurand implies something physical that can be measured. The speed of light, the weight of a proton, the length of a board, the acceleration of gravity, the wavelength of a radio signal, ………
You can’t measure an average. You can only calculate it as a statistical descriptor.
Uncertainty *can* be measured. What do you think calibration labs do?
Jim has asked you several times. You’ve never answered. Where does division by N or sqrt(N) appear in the GUM when calculating uncertainty.
u_c(y)^2 = SUM (∂f/∂x_i)^2 u(x_i)^2
Where does division by N or sqrt(N) appear in this equation?
What is “y” in this equation?
Look closely at what you just said. One month at one station can have a large uncertainty but the GAT somehow reduces that value by a factor of 100 to 1000 when averaging with other stations.
That is his opinion and not much different from mine. Keep in mind that NIST used several assumptions in order to dwell on the main issue of monthly average temperature uncertainty. For some reason you never quote that fact.
Basically you are deflecting from having to say that NIST is incorrect in their procedure of calculating uncertainty.
Answer this, IS NIST CORRECT IN THEIR PROCEDURE IN TN 1900? If yes, say why. If no, say why.
No sh** Sherlock! So which one does the GUM say to use?
Why have you given no answer to this request that I asked you to do?
Did you find any mention of the dispersion of values that can be attributed to the measurand that show using the standard uncertainty of the mean?
You have not once shown how uncertainties are reduced by combining random variables!
Uncertainties are different from the means of a distribution. Uncertainties add, always. Show one equation in the GUM where uncertainties are ever subtracted or divided by the quantity of uncertainties when combining them.
Your assertions have no references or examples.
Why don’t you show how individual anomaly uncertainties are calculated AND how the uncertainties are calculated when they are averaged with other anomalies?
You obviously have the data from the Topeka station. Use it, or the data from TN 1900 to show how YOU WOULD CALCULATE THE MONTHLY UNCERTAINTY. Put your money where your mouth is.
So far all you have done is elucidate your beliefs with no references or actual math.
My guess is that he doesn’t even have a clue as to what the measurement uncertainty of the individual Topeka temp data points *is*.
Without that how can he conclude anything about the accuracy of the data or its average.
All he can do is show how precisely he can calculate the average of supposedly 100% accurate stated values!
At this point it is safe to conclude that he doesn’t care what the real accuracy of air temperature data is.
So tell me how Jim got his uncertainties? How did he include the unknown measurement uncertainties?
Then explain why he is so confident that there can be no systematic error in two sets of data separated by 25+ years of missing data?
“Without that how can he conclude anything about the accuracy of the data or its average.”
Hilarious. Tim has completely forgotten that a year ago he was using exactly the same data, with zero thought to uncertainty, to prove that there had been no warming since the 1950s.
“All he can do is show how precisely he can calculate the average of supposedly 100% accurate stated values!”
Still waiting for you to provide your graph with the uncertainty intervals you think are correct.
“One month at one station can have a large uncertainty but the GAT somehow reduces that value by a factor of 100 to 1000 when averaging with other stations.”
Stop putting words into my mouth. I said nothing about how much the uncertainty reduces. As I keep trying to tell you the uncertainty calculations for real world anomaly averages are much more complicated than just working out the SEM.
But yes, you would expect the uncertainty of the average of many measurements to be less than that for one station. That’s why the uncertainty for 22 days is less than the uncertainty of 1 day.
Note in this case the model being used is that each day’s temperature is a random value around a monthly mean. The uncertainty comes entirely from the assumption you could have had a different set of random temperatures. If you accept this definition of measurement uncertainty, then each station could have a different set of random daily temperatures, and being random they will tend to cancel out. It’s possible that that one station was 2°C too warm because there were a number of randomly warm days. It’s almost impossible that 100s of different stations will all have the same discrepancy.
“That is his opinion and not much different from mine. Keep in mind that NIST used several assumptions in order to dwell on the main issue of monthly average temperature uncertainty. ”
So know you are backtracking on the NIST example. How many time have you attacked me for not using exactly their method and told me I was being arrogant for “disagreeing” with them?
Of course there are assumptions in the example. I’ve told you several times I don’t even agree with all their assumptions. But as always you think assumptions just mean you can ignore the result if you don’t like it.
The assumptions used are mostly the same as with any SEM calculation. That the sample is a random IID selection. I think independence and identical distribution is questionable and almost certainly wrong. But I mentioned auto correlation, i.e. values are not independent, and you insisted there could be no auto correlation because there is no time involved in daily values, or some nonsense like that.
Identical distribution assumes that the mean temperature does not change throught the month, which is absurd.
They assume the temperatures are normally distributed, which is unlikely. This would have an effect on their coverage factor.
They ignore resolution and other measurement uncertainties. That’s reasonable given the range of values. As I say, when the SD of the values is larger than the resolution, the resolution becomes irrelevant.
They assume there is no significant calibration error, which is probably reasonable, but raises more questions about what exactly you are measuring. Is it the temperature at that one specific station, or is it meant to be representative of the whole area. That’s a difficult question as every location will have it’s own micro climate. This is why it’s better to average a range of stations, and preferably using anomalies rather than absolute temperature.
And this before the big assumption, about the model. That is that the uncertainty of the monthly average depends on the assumption that the daily values are random fluctuations about a mean. As I’ve suggested before, I think that assumption is going to depend on exactly what you are trying to do. As I think the TN says, what uncertainty you want depends on what questions you are asking.
“No sh** Sherlock! So which one does the GUM say to use?”
So why claim it was your uncertainty for the Topeka data? That’s what I asked you for. As I’ve alread told you the GUM is saying to use the smaller, interval for the uncertainty of the average. The one labeled with s(mean of t).
“Search the GUM for the word “dispersion”. I think you’ll find that is mentioned only in relation to s(q_k), i.e., the standard deviation for a series of n measurements of the same measurand.”
They state that the uncertainty of the mean is given by the Experimental Standard Deviation of the Mean (4.2.3). That’s the SD of all the measurements divided by root N. Buy their definition of uncertainty that’s describing a dispersion of values that can be attributed to the measurand, which in this case is the mean.
Now you are going to whine about how that’s measuring the same thing, and imply that somehow this means the rules are completely different when measuring different things.
I said years ago – fine. You can either say that the average of different things is not a measurand, and therefore ignore the GUM as that only deals with the uncertainty of measurements. Or you can say that the mean is a measurand, and treat each different value as a measurement with uncertainty of that mean. (This of course is that TN1900 does).
Either way, you will still get the same answer. Subject to all the usual assumptions, the uncertainty of the mean decreases with sample size.
“You have not once shown how uncertainties are reduced by combining random variables!”
You are either lying or suffering from severe memory loss.
I’ve explained using the rules for combining random variables, I’ve explained using the rules for propagating uncertainties (e.g. the ones in Taylor), I’ve explained using the general rule for propagating
errorsuncertainties, e.g. Eq 10 in the GUM, I’ve demonstrated using simulations and I’ve appealed to common sense. Oh and I keep pointing you to all the references and examples in your own sources where uncertainties of means are taken.You meanwhile have yet to give me a concrete explanation of how taking an average of a large sample of different things could possibly result in an uncertainty that is massively large than any individual uncertainty.
You are cherry picking again without understanding the context.
4.2.2 The individual observations qk differ in value because of random variations in the influence quantities, or random effects (see 3.2.2). The experimental variance of the observations, which estimates the variance σ^2 of the probability distribution of q, is given by
4.2.3 is how you figure out the SEM. Once again you are trying to substitute the SEM for the measurement uncertainty of the observations. It isn’t. It’s how precisely you have calculated the mean!
STOP CHERRY PICKING. You just dig yourself into a hole every time you do.
“That’s the SD of all the measurements divided by root N. Buy their definition of uncertainty that’s describing a dispersion of values that can be attributed to the measurand, which in this case is the mean.”
Nope! Read 4.2.2 again. 4.2.3 is the dispersion of values that can be attributed to the mean, not the measurand! You are back to assuming that the mean is a true value of a measurand. IT ISN’T! You claim you don’t do this but you still do it EVERY SINGLE TIME!
“Now you are going to whine about how that’s measuring the same thing”
You’ve just been through a discussion where the experts tell you that the mean isn’t a true value even if you are measuring the same thing! One (bevington) because of outlieers and the other because of resolution uncertainty. You can’t even retain that for more than 24 hours!
“You can either say that the average of different things is not a measurand”
“Or you can say that the mean is a measurand, and treat each different value as a measurement with uncertainty of that mean. (This of course is that TN1900 does).”
You’ve been asked several times to list out the assumptions given by Possolo in TN1900. Yet you continue to refuse to do so. Until you can do that nothing you claim about TN1900 has any significance at all.
“I’ve explained using the rules for combining random variables”
No, you haven’t. All you’ve done is deflected into “scaling” of random variables.
“I’ve explained using the rules for propagating uncertainties (e.g. the ones in Taylor),”
No, you haven’t. You keep deflecting to saying the SEM is the measurement uncertainty of a set of observations. It isn’t.
“I’ve explained using the general rule for propagating
errorsuncertainties, e.g. Eq 10 in the GUM”Except you’ve never shown where the right side of Eq 10 is divided by N or sqrt(N) or anything.
” Oh and I keep pointing you to all the references and examples in your own sources where uncertainties of means are taken.”
All you’ve ever done is cherry picked things that you don’t understand. Like quoting 4.2.3 while totally ignoring what 4.2.2 says.
from 4.2.2. “This estimate of variance and its positive square root s(qk), termed the experimental standard deviation (B.2.17), characterize the variability of the observed values qk , or more specifically, their dispersion about their mean q.”
It is the dispersion of the observed values that is the uncertainty, not the SEM covered in 4.2.3.
“4.2.3 is how you figure out the SEM.”
I think you mean “the experimental standard deviation of the mean”
“Once again you are trying to substitute the SEM for the measurement uncertainty of the observations.”
For the uncertainty of the mean, not the observations. 4.2.3 says it explicitly. Either the variance of the mean or the experimental standard deviation of the mean may be used to quantify the uncertainty of q-bar.
“4.2.3 is the dispersion of values that can be attributed to the mean, not the measurand!”
The mean is the measurand. If you think it’s not, what exactly are you trying to find the uncertainty of?
……………………………………
“4.2.3 is how you figure out the SEM.”
I think you mean “the experimental standard deviation of the mean”
……………………………………
They are the same thing. The standard deviation of the mean is *NOT* the standard deviation of the observations of the measurand. It is how precisely you have calculated the mean – exactly what the SEM is.
Get it straight. The true value is unknowable. How many times does the GUM need to be quoted to you on this?
It’s been pointed out to you that some organizations have even stopped stating an estimated mean and just quote an interval for the possible values of the measurand.
If you do that then who cares how precisely you have calculated the mean?
Two points the Block Heads have never acknowledged nor even tried to refute:
1—Forming an average cannot and does not cancel systematic uncertainty.
2—Subtracting a baseline for an anomaly increases uncertainty.
Stop these lies and ad hominems.
I’ve repeatedly said that an average will not reduce systematic errors, that’s the definition of systematic.
Then why do yo think they cancel out when calculating the mean?
How do you add a factor into the SEM to represent a systematic uncertainty when the SEM is based only on stated values and not on the uncertainty of the elements?
You’ve dug yourself a big hole. And you just keep digging.
Absolutely true, and notice that Last Word Bellman danced away from Point #2.
“2—Subtracting a baseline for an anomaly increases uncertainty.”
And, I’ve repeatedly agreed that an anomaly will have to some extent a bigger uncertainty. Why would you think otherwise? There’s uncertainty in your current monthly uncertainty and uncertainty in what the temperature was during the base period.
But, well quite a few buts.
“The difference in uncertainty will not be great.”
The uncertainty adds. The uncertainty of the anomaly will be greater than that of the components used to calculate it.
In reality what you are saying is that the measurement uncertainty of the components used to calculate the anomaly is random, Gaussian, and cancels. So they can be considered as 100% accurate.
Just like climate science does.
”
ROFL!!! The uncertainty of the baseline is *NOT* 1 if all of the components, e.g. the current temp has an uncertainty of 1.
20C is off by one, it’s really 19. 21C is off by one. It’s really 22C.
21-20 = 1
22-19 = 3
The systematic uncertainty will result n a possible offset of 2!
Once again, you are falling back on the assumption that all systematic uncertainty is random, Gaussian, and cancels.
Can you justify that assumption?
As usual, everything he writes is hand-waving, wishful thinking that ignores the gorilla.
“20C is off by one, it’s really 19. 21C is off by one. It’s really 22C.”
Then it wouldn’t be a systematic error would it?
“…all systematic uncertainty is random, ”
!?
I’m now being accused of assuming that all systematic uncertainty is random, by someone insisting that a systematic error can sometimes be +1 and sometimes -1.
Stop! All this talking about uncertainty and you make a statement like this! Unbelievable.
Subtracting the means of random variables CANCELS NOTHING regarding uncertainty. If all readings are off by a constant at a station for 30 years, any and all calculations will carry that systematic uncertainty.
Your assertions going forward have absolutely no value because you obviously have no appreciation for measurements and no an inkling of what uncertainty truly is.
“Subtracting the means of random variables CANCELS NOTHING regarding uncertainty.”
Which is why I said it was a systematic error.
This isn’t just about instrument error. Just the fact that some stations are naturally in warmer or cooler location.
Not if you treat the offset as a constant, which is required for reversibility.
The anomaly retains its own uncertainty. This applies to the baseline period as well as any other period of interest.
The baseline is not a constant with no uncertainty. The baseline is X degC +/- u(x).
It doesn’t matter how you scale it, you also have to take the uncertainty with it.
So you get (X +/- u(x)) – (Y +/- u(y))
If u(x) and u(y) are given in Fahrenheit then you have to convert them to Celsius right along with X and Y.
We’ve bee down this road already. Shifting a distribution along an axis doesn’t change the distribution. All an offset does is shift a distribution along an axis, for either the x or y axis.
This is why relative uncertainty is such a useful concept. It is a percentage (i.e. unit-less) and can be applied to anything.
u(x)/X = u(y)/y
Even if x is degF and y is degC
If you’ve changed the relative relationship then you’ve done something wrong. You’ve changed the distribution somehow.
Absolutely (sic). But for reversibility, the offset must be treated as a constant.
Consider a hypothetical site with a baseline average of 293.15K +/- 1.3K (it’s very arid).
The offset is arbitrarily defined as the constant 293.15K.
Now, calculate the anomaly for the baseline period. It’s either
1) 0anomaly +/- 1.3K (constant offset), or
2) 0anomaly +/- (1.3 + 1.3)K (subtracting the baseline, add uncertainties) or
3) 0anomaly +/- sqrt ( 1.3^2 + 1.3^2)K (subtract the baseline, add the uncertainties in quadrature).
Convert it back to Kelvin.
1) 293.15K +/- 1.3K
2) 293.15K +/- (1.3 +1.3 + 1.3)K
3) 293.15K +/- sqrt(sqrt(1.3^2 +1.3^2) + 1.3^2)
Considering the way ASOS temperature conversions are handled, it probably isn’t handled this way for this reason, but it is correct.
Yes, that’s the point. Shifting a distribution along an axis shouldn’t change it.
u(x)/X = u(y)/y
Shouldn’t that be Rankine and Kelvin?
yes!
But the temperature baseline is not a constant, it is constructed from measured values. The UAH baseline changes every month, even though the start and end dates don’t change,
So yes, subtracting a baseline increases the uncertainty. Yet climate science assumes that it somehow cancels errors.
As I said earlier, I’m not touching UAH with a barge pole.
Yes, it does. That’s why the offset needs to be treated as a constant.
There seem to be some odd ideas kicking about. The Gavin Schmidt RealClimate post that Kip linked to in the Rising Maximum Temperatures thread is a good example.
Yes, it does. That’s why the offset needs to be treated as a constant.”
Further to this, subtracting the baseline from the period of interest (e.g. to see if temperatures are different) most certainly does require addition of the uncertainties.
Merely shifting the zero point can’t.
It is just an example—all the numbers inside come from satellite microwave measurements.
And different people have different ideas about what the correct period should be used to represent “climate”.
That certainly muddies the waters 🙁
So does different groups using different samples of convenience.
So does trying to determine a “baseline” and hence offset for a station which doesn’t have an almost complete set of readings for the entire baseline period.
“They are the same thing.”
Oh the irony.
“It is how precisely you have calculated the mean – exactly what the SEM is.”
And exactly what you need as a starting point for estimating the uncertainty of the mean.
“The true value is unknowable.”
How many times are you going to parrot this, before it dawns on you that that is the point? That’s why we talk about the uncertainty of the mean.
“It’s been pointed out to you that some organizations have even stopped stating an estimated mean and just quote an interval for the possible values of the measurand.”
You keep claiming it – have you ever provided a reference?
“If you do that then who cares how precisely you have calculated the mean?”
You obviously do – given you’ve been going on about it for the two years.
“Uncertainties are different from the means of a distribution.”
Of course they are. The mean of a distribution is it’s mean, the standard deviation is the standard uncertainty.
“Uncertainties add, always.”
Which I suspect is your problem. You learnt this at an early age, it seems to make sense, and then you assume it must be a universal rule and cannot think of any circumstance where it might be wrong. As I’ve suggested before, you seem to only understand maths through phrases and mantras, not from actually understanding the equations. And this leads to blind spots where even when your own sources are showing you situations in which uncertainties get smaller, you simply cannot see it.
“Show one equation in the GUM where uncertainties are ever subtracted or divided by the quantity of uncertainties when combining them.”
4.2.3.
“You obviously have the data from the Topeka station. Use it, or the data from TN 1900 to show how YOU WOULD CALCULATE THE MONTHLY UNCERTAINTY.”
I’ve told you what I did. I’ve shown the uncertainties on the graph, there is very little difference to the size of the monthly uncertainties. All I did was take the SD of the daily values divide by root N, and multiply by 2 to get the k = 2, expanded uncertainty. The only difference between that and TN1900 was I didn’t use the student-t distribution to estimate a 95% confidence interval. If I had it would have added about 2.5% to the range.
“Which I suspect is your problem. You learnt this at an early age, it seems to make sense, and then you assume it must be a universal rule and cannot think of any circumstance where it might be wrong. “
It *is* a universal rule. Eq 10 says so!
“As I’ve suggested before, you seem to only understand maths through phrases and mantras, not from actually understanding the equations.”
So says the guy that didn’t understand that the partial derivative in Eq 10 is a weighting factor!
“showing you situations in which uncertainties get smaller,”
Calculating the mean more precisely is *NOT* decreasing the possible values that can reasonably be attributed to the measurand — UNLESS YOU THINK THE MEAN IS A TRUE VALUE.
From the GUM:
“Further, in many industrial and commercial applications, as well as in the areas of health and safety, it is often necessary to provide an interval about the measurement result that may be expected to encompass a large fraction of the distribution of values that could reasonably be attributed to the quantity subject to measurement.”
It does *NOT* say the mean of mean is the distribution of values that could reasonably be attributed to the quantity subject to measurement.
From the GUM:
“1.2 This Guide is primarily concerned with the expression of uncertainty in the measurement of a well-defined physical quantity — the measurand — that can be characterized by an essentially unique value.” (bolding mine, tpg)
It specifically does not mention statistical descriptors as being a measurand. It only mentions PHYSICAL quantities. A statistical descriptor is not a physical quantity.
from the GUM:
“uncertainty (of measurement)
parameter, associated with the result of a measurement, that characterizes the dispersion of the values that could reasonably be attributed to the measurand”
It does *NOT* say the dispersion of values that can be attributed to the mean.
from the GUM:
“Although these two traditional concepts are valid as ideals, they focus on unknowable quantities: the “error” of the result of a measurement and the “true value” of the measurand (in contrast to its estimated value),
respectively”
You consider the mean to be a true value. Yet the GUM says the true value is an UNKNOWABLE QUANTITY.
STOP CHERRY PICKING. LIST OUT THE ASSUMPTIONS IN TN1900!
Until you abandon the idea that the mean is a true value, until you abandon the idea that all measurement uncertainty is random Gaussian, and cancels, and abandon the idea that an average is a physical, measurable quantity you’ll never understand uncertainty in measurement.
How true. What is bizarre to me is that he has deluded himself into thinking he is an expert on measurement uncertainty and therefore qualified to lecture about it.
“It *is* a universal rule. Eq 10 says so!”
Again, yes, but only if you actually know what the partial derivative of x/n is.
“It does *NOT* say the mean of mean is the distribution of values that could reasonably be attributed to the quantity subject to measurement.”
You just keep making terms up. What do you mean by the mean of mean?
“It does *NOT* say the dispersion of values that can be attributed to the mean.”
If the mean is defined as the measurand then that’s exactly what it’s saying. If you insist it isn’t the measurand, then you have to say what is, and how you are calculating its uncertainty.
“It specifically does not mention statistical descriptors as being a measurand.”
How do you specifically not say something? Again, if you don’t think the global average is a physical quantity, then how can you talk about it’s measurement uncertainty. You say you agree with equation 10, as a way of justifying the uncertainty of the mean, but that requires the function produces a measurand Y.
And of course the NIST document you insist is the correct method describes the average monthly temperature at a station as the measurand.
“You consider the mean to be a true value. Yet the GUM says the true value is an UNKNOWABLE QUANTITY.”
Of course it’s unknowable – that’s why there is uncertainty. If we knew the “actual” mean exactly, there would be no uncertainty about what it is.
And of course, there is no one true value. It depends on how you are defining it.
Quit cherry picking things you know nothing about. Eq. 10 is the propagation of uncertainty when various measurements are combined and the uncertainties of each have different sensitivities in the functional relationship that defines a measurement.
Let’s look at Eq. 10
u𝒸²(y) = Σ (∂f/∂xᵢ)² u(xᵢ)²
Where do you see the term (x / n)?
You are confusing input and output quantities. Your personal definition is
y =X̅ᵢ = (x₁ + … + xₙ) / n
You have already used your data to arrive at one instance of a measurement value, i.e., X̅₁, that is all you have. You have no way to obtain more X̅ᵢ values.
That makes Eq. 10:
u𝒸²(y) = Σ (∂f/∂x₁)² u(x₁)²
Tell us what the partial differential of a single measured value actually is. Better yet, tell us what the uncertainty of the single measurement is. Maybe that from TN 1900?
“Quit cherry picking things you know nothing about.”
Your definition of “cherry picking” gets weirder by the day.
“Let’s look at Eq. 10
u𝒸²(y) = Σ (∂f/∂xᵢ)² u(xᵢ)²
Where do you see the term (x / n)?”
Why do you expect my answer to be any different to all the previous times you’ve asked?
The function is y = x1/n + x2/n + … + xn / n
The partial derivative for term is 1/n
Hence
u𝒸²(y) = Σ (∂f/∂xᵢ)² u(xᵢ)²
= Σ (1/n)² u(xᵢ)²
= (1/n)² Σ u(xᵢ)²
“You are confusing input and output quantities.”
No more than the last hundred times you’ve misunderstood this.
“You have already used your data to arrive at one instance of a measurement value, i.e., X̅₁, that is all you have.”
As I told you the last time you said this, I am not saying anything about the source of the various xᵢ’s. Usually they will only be single measurements with an assumed uncertainty, as in single temperature measurements. You want thew each to be the average of multiple measurements of each thing. But the result Y is the average of all the xᵢ’s, not the mean of any one of them.
“That makes Eq. 10:
u𝒸²(y) = Σ (∂f/∂x₁)² u(x₁)²”
All you are doing here is skipping equation ten and just using 4.2.3. Either is fine. That’s what TN1900 does. It treats all the daily values as individual measurements of a single measurand – the monthly average. It uses 4.2.3 to get the
SEMExperimental Standard Deviation of the Mean. When you do that there is no need to use Equation 10, as there is no combination going on.This is what happens usually as you are using the deviation of all the values to calculate the uncertainty of the mean, i.e. the SEM.
Equation 10 is only propagating the measurement uncertainties. That is using the average function as the functional relationship, it is assuming you want an exact average, not a sample.
“Tell us what the partial differential of a single measured value actually is.”
1.
You function is just Y = X.
“Better yet, tell us what the uncertainty of the single measurement is.”
The Experimental Standard Deviation of the Mean.
“Maybe that from TN 1900?”
Yes – exactly what they tell you.
So again, you agree the expanded standard uncertainty of the mean is an appropriate value for a monthly average!
Now let’s discuss the calculation of a baseline that has 30 values, just like a monthly average,
Do you agree the same method is appropriate?
You keep going on about expanded uncertainty as if it was something different to standard uncertainty, rather than being another way of describing the same thing.
My understanding of the GUM (feel free to correct me if you disagree), is that the preferred way of describing uncertainty is by the standard uncertainty. This is just a single value and not an interval and does not depend on the distribution.
Expanded uncertainties are there for people who prefer the old style of writing an interval ± of the best estimate. It’s just taking the standard uncertainty and multiplying it by a preferred coverage factor.
Which you prefer is more about preference. It does not mean that one is correct and the other is wrong, as they are both describing the same uncertainty in different ways.
“Now let’s discuss the calculation of a baseline that has 30 values, just like a monthly average,”
Well you have multiple choices here. You could look at the standard deviation of the monthly values and divide by root 30. You could look at all the daily values and divide by root number of days. You could simply work out the anomalies and treat them as the measurements around a new anomaly which is the mean, though that makes more sense if you are taking annual uncertainties or using a daily base line.
In theory, I think they should all give you the same result, but probably won’t because of a lack of independence.
NIST prefers the use of intervals. That is why they used that in TN 1900. It also allows asymmetric intervals to be specified in the same way.
However if the GUM is followed, the measurement
distribution should be stated along with any k factor. If the assumed distribution is Gaussian, the a symmetric interval can be specified using a ±number.
You are starting to nitpick along with stating what you envision for uncertainty ranges for monthly averages.
State whether you believe monthly averages are closer to 1.5° – 3.0°C. or are closer to 0.005 – 0.01°C
Great. Do the math and tell what uncertainty you obtain for each.
You will get values in the 0.8 – 2.5 range depending on the location and month.
NO! Anomalies are not a measured temperature. They do not have their own inherent uncertainty. Anomalies inherit the uncertainties of the random variables being combined by subtraction to obtain a rate of change, i.e., ΔT.
This is normal statistical treatment of random variables being added or subtraction.
Trying to find the variance of a scaled value (anomaly) that is sometimes 100 times smaller, is just throwing away the uncertainty of the numbers used to calculate it. That is not scientific.
“If the mean is defined as the measurand”
GUM: “0.1 When reporting the result of a measurement of a physical quantity,” (bolding mine, tpg)
GUM: “1.2 This Guide is primarily concerned with the expression of uncertainty in the measurement of a well-defined physical quantity” (bolding mine, tpg)
You keep wanting to treat a statistical descriptor as a physical quantity. It isn’t. Never has been, never will be.
Give it up!
The two phases of an argument with the Gormans.
1. Equation 10 of the Gum proves the uncertainty of an average temperature is the standard deviation.
2. You can’t use equation 10 of the GUM because average temperature is not a physical quantity.
So says a non-scientist that doesn’t even understand the different between an intensive property and an extensive property!
What do you think the articles by Kip Hansen on temperature and intensive properties showed?
Cognitive dissonance is just one more of your negative attributes, along with absolutely no reading comprehension skills at all!
If I give you two rocks, one at 10C and one at 20C can you put them on a thermometer sensor and get 30C? If not then how can you average their temperatures?
I can take two rocks, one with a mass of 2kg and one of 4kg, put them on a scale and get 4kg. *THAT* you can average.
So you agree that the method in TN 1900 is appropriate under the specified assumptions?
Now how would you address the uncertainty of each measurement?
See GUM, F.1.1.2
He won’t even list out the specified assumptions. It would blow his entire argument out of the water!
I’ve listed out the assumption many times. Why don’t you explain how you would do it differently if the assumptions were different. Why don’t you list out all the assumptions you make whenever you claim the uncertainty grows with sample size?
Admitting that you can’t show any human causation.
As good as admitting there is no human causation
Thanks for finally waking up to reality.
Schizophrenic climatosis
“”2023, the hottest year in recorded history””
https://www.theguardian.com/us-news/2024/jan/03/2023-hottest-year-on-record-fossil-fuel-climate-crisis
“”2023 was UK’s second-hottest year on record””
https://www.theguardian.com/environment/2024/jan/02/climate-crisis-2023-was-uks-second-hottest-on-record
Shurely shome mishtake…
One refers to global temperatures and the other refers to UK only. It is possible for 2 things to be true at the same time.
The recent big temperature spike is nearly identical to the 1998 super El Niño but a bit smaller.
See https://wattsupwiththat.com/uah-version-6/
All of the warming since UAH records began in 1978 has been in steps up due to super El Niños.
See https://www.cfact.org/2021/01/15/the-new-pause/
This jump is therefore likely to lead to even more warming but CO2 has nothing to do with it. It is El Niño residual energy all the way down. For the record I first pointed out this pattern six years ago.
See my http://www.cfact.org/2018/01/02/no-co2-warming-for-the-last-40-years/
Do the La Ninas not have an effect?
Whay should they?? They are not a sudden release of energy.
Yes, La Niñas cause the downward pointing spikes because they are an upwelling of cold water which draws energy out of the atmosphere. But there is no reason a La Niña should draw off all of the energy created by the previous El Niño.
Can you refer me to a credible source? Not one from an intellectually bankrupt climate denier chamber you seem to inhibit. Don’t hold your breath, though – it might require a mental leap you’re unprepared for.
Ah another dunce Troll who doesn’t know elementary information about ENSO.
Perhaps you can cite me a paper? I’d love to read it.
Perhaps you can cite a paper that scientifically proves warming by human released CO2.
But before that , at least try to find out something about how El Ninos etc works.
Don’t choose to be as ignorant as some of these other AGW clowns.
That would require you to understand basic science and logic.
So even if posted, you wouldn’t have a chance of comprehending tit.
Please stop displaying your abject ignorance.
You have already shown you know nothing about surface stations and their many problems.
Don’t compound that with ignorance of everything else. !
How does your hypothesis play out when back tested over the thousands of years that ENSO has been occurring?
ROFLMAO.. Are you saying there was human warming back 1000 years ago
You are getting more and more stupid with every comment !!
“ It is El Niño residual energy all the way down”
What is that? ENSO is a cycle caused by heat moving around. It is not a source of heat. Where could it come from?
We have had El Nino’s for millennia. So why haven’t the seas boiled?
OMG.. Nick doesn’t understand El Ninos, either. !!
This is hilarious.
Seems he doesn’t even know where the heat source is..
Does he live in a padded underground basement, one wonders !!
Very funny indeed.
By a 100% coincidence the step-up warming happens when there is an El-Nino outflow ongoing from a high mass ocean to a low mass atmosphere which is why temperature goes up rapidly then declines when El-Nino phase drops way down.
No one here is saying El-Nino is a source of energy thus you mislead with a false narrative.
The Sun is the dominant source of energy being deposited into the ocean waters 24/7 heck it is the Sun/Ocean/planet rotation dynamo that dominates the weather processes 24/7.
Gosh was a stupid statement you made since anyone with temperature above absolute zero knows the RELEASED energy from the ocean is continuous with periodic accelerated outflow and distributed outward and upward over time that eventually gets removed from the air.
Did you really get a PHD in this life or in your fantasy past life?
“No one here is saying El-Nino is a source of energy”
It’s right in front of you. I quoted David W saying
“ It is El Niño residual energy all the way down”
But6 you said it yourself, just now
“anyone with temperature above absolute zero knows the RELEASED energy from the ocean is continuous”
Poor Nick…
You are talking gibberish and showing remarkable ignorance… as usual !!
Thinking continuous means “constant”
Even for you.. that is DUMB !!
El Niño is a lack of cold upwelling so the ocean surface layer gets warmer than it would if the cold upwelling were there. The energy comes directly from the sun, warming the ocean. Very simple.
So if El Niño is responsible for the current 2°C/century warming, and has been going on for millennia (20°C/millennium), why have the temperatures been so stable till now?
OMG.. you are THICK!!
Temperatures HAVE NOT been so stable.
Are you still stuck in your basement, totally unaware of where energy for the Planet mostly comes from ??
You are either being a troll or are an ignoramus. Why don’t you tell us why the earth didn’t burn up during the millenia where CO2 was as high or higher than it is now?
Another “nitpick”. I.e., a question that, when properly run to ground, effectively rebuts their half thought thru narrative. Better to deflect, even though JG’s particular deflection, below, is easily countered.
A mercifully short blob word salad.
Why don’t you rebut it then?
Because it is a silly deflection, posted to avoid you 2 having to discuss the inconvenient to you question posed by Nick.
I see you doing this elsewhere as well.
https://wattsupwiththat.com/2024/01/03/uah-global-temperature-update-for-december-2023-0-83-deg-c/#comment-3842228
Sorry dudes. This comment section has not been kind to you and your cohorts….
So sayeth the GAT hockey stick alarmist clown…
This really hurt.
Not a hom. I provided 2 examples of you worming out of normal discourse. 3 now…
All I saw was bigoilyblob picking his nose.
Thanks David, for confirming everything I have been saying.
There is zero evidence of any human caused warming in the satellite temperature record.
All of the mini AGW trollettes have confirmed that statement by their total inability to post any.
The December anomaly map indicates Canada and Siberia are the big warmers. I wonder if the local residents are concerned that December 2023 was four to five degrees warmer than 1990.
Australia is unchanged from 1990 temperature. For a few years now, I have been pointing out that the CO2 botherers at the BoM will have ever increasing difficulty homogenising past temperatures to keep their warming trend alive as the peak solar intensity shifts northward.
The South Pole had the most sunlight in December 2023 of anywhere on Earth. It did not get above 0C because it is a big block of ice. The North Pole will pip the SP for the highest monthly sunlight in June 2,500 years from now. June sunlight at the NP has been increasing for 1200 years already.
December sunlight over the South Pole is already down 17W/m^2 from its peak 4,600 years ago when sea level peaked during the current interglacial.
If you take the time to understand the orbital precession you will have a firm handle on climate trends. Northern Hemisphere oceans will get a lot warmer in September before the land ice starts accumulating again.
RickWill, suppose we were to adopt solar geo-engineering as our preferred solution to the alleged dangers of climate change and then began injecting seriously large quantities of SO2 and some types of solar reflective particles directly into the stratosphere.
Suppose we do this indefinitely into the future with the result that the earth’s global mean temperature is always being maintained at a level 2C below what it might otherwise be in the absence of continuous solar geo-engineering.
Based on your opinions concerning how ice ages evolve through time, what would you predict might be the long-term effects of continuous solar geo-engineering on the future evolution of ice ages?
There are a couple of places in Australia that have pumped vast amounts of SO2 into the atmosphere over decades; namely Port Pirie and Mount Isa. All that has done is cause desertification of the down wind land. Whether much made it into the stratosphere is questionable but it is more a herbicide than a solar reflector when released a couple of hundred metres above ground level. It would be a mind boggling expensive exercise to get it into the stratosphere.
The atmospheric process that limits ocean temperature to 30C is very powerful. Convective potential is equivalent to 57W/m^2 over tropical warm pools and these get up to about half of the tropical ocean area. Their September extent is increasing at 2.5% of NH ocean surface each decade. This year, the ocean off Japan hit the 30C limit at 37N. We could well see regions as far north as 50N reaching 30C.
History informs us that snowfall will eventually overtake snow melt. At present. melt is still outstripping snowfall everywhere in the NH except Greenland. So think how much snowfall there will be before it overtakes snowmelt as the oceans continue to warm.
Queenstown in Tassie as well !
Yes – and probably the most famous for the lunar landscape that they now cherish.
 ?s=2048×2048&w=gi&k=20&c=_ea9z2GIW0snWGeGiJN3MnxUTM8vkp7ibyJ9UHGj_kY=
RickWill, solar geo-engineering using solar radiance modification (SRM) to inject some combination of SO2 and reflective particles directly into the stratosphere is relatively easy and inexpensive to accomplish compared to the enormous costs of worldwide Net Zero.
For a cost of a hundred billion USD a year — some estimates put the costs considerably lower — geo engineers can quickly reduce the earth’s global mean temperature by 2C and then keep it there indefinitely through yearly injections of SO2 and reflective particles directly into the stratosphere.
The Chinese are reportedly considering doing solar geo-engineering/SRM unilaterally from their own territory on their own initiative with full knowledge that the injected SO2 and the reflective particles will eventually be distributed worldwide throughout the stratosphere thus causing a worldwide reduction in GMT.
And so once again I ask this question: Based on your opinions concerning how ice ages evolve through time, what would you predict might be the long-term effects of continuous solar geo-engineering on the future evolution of ice ages?
Would solar geo-engineering using SRM accelerate the onset of another ice age, slow the onset of another ice age, or basically have no effect on the evolution of ice ages through time?
Negligible impact. The climate action is in the troposphere and the dominant process for energy balance and heat distribution is convective instability.
Glaciation is the result of more northern ocean surface reaching the 30C limit, set by cyclic convective instability, in September resulting in more atmospheric moisture that ends up over land when the land temperature falls below zero.
There is no delicate radiation balance. Convective storms are the result of convective instability and they regularly rip 3 to 4C off the ocean surface temperature over hundreds of thousands of square kilometres. Then dump vast amounts of water onto land. Winter convective storms over high latitudes and high ground dump their precipitation as snow.
Once ocean surface reaches 26C, the solar shutters start going up. That occurs when top of atmosphere solar reaches 420W/m^2. or above for a month. Increasing proportion of the solar input is rejected such that the surface temperature stabilises at 30C. For example, 15S goes above 420w/m^2 in October through to March inclusive – 432, 460, 474, 467, 425W/m^2. So for all those months, any solar EMR above the 300W/m^2 thermalised to sustain 30C is already rejected. So 175W/m^2 will not be thermalised at 15S during January. In the present era, there is always some ocean surface reaching the 30C limit.
Any of the pinkish shaded ocean in the attached is rejecting solar EMR. It has already reached the temperature limit of 30C. April is still the month with most surface at 30C but it will eventually shift to September as the solar intensity progresses north. Clouds over tropical warm pools can reject more than 50% of the solar EMR and only 10% might actually get to the surface on any particular day. So the precess is truly powerful. Fiddling with EMR in fractions of a W/m^2 in the stratosphere is not going to impact on this immensely powerful process.
Climate models start with the assumption that 30% of the solar EMR is rejected and essentially fixed at that level. There is no connection between surface temperature and cloud formation so they bear no relationship to how energy is actually regulated. They are built on the notion that there is a delicate radiation balance based on the imbecilic theory of a “greenhouse effect”, which is just bunkum. The same notion sits behind atmospheric geo-engineering.
My forecast is that the oceans will be falling within the next 1,000 years. They will drop up to 2mm/year once they start falling. Over time, existing port infrastructure will need to be rebuilt.
My prediction that new snowfall records will be a feature of weather reporting for the next 9,000 years is standing the test of time – unlike climate models that were predicting the snowfall was a thing of the past.
According to this latest UAH update, Australia has warmed at a rate of +0.17C per decade since 1990 and this year just past, 2023, was the 3rd warmest on record in Oz.
So what are you talking about?
Again, based on a short warming spike from the El Nino… during winter
And what a glorious winter it was ! 🙂
Actually, there is a strong COOLING trend since 2016, even with this El Nino.
So.. Human causation for the El Nino. ?????
…. or are you admitting it is TOTALLY NATURAL !
Oh and LESS warming effect from this El Nino than the 1998 and 2016 El Ninos.
You are EMPTY of anything to push whatever your mindless agenda is.
Read what I wrote and look at the chart attached here. 2023 is the same as 1990 and 1980. You can get trends any way you want from this data by starting and stopping at certain dates. But Australia was the same in 2023 as it was way back in 1980. As the chart shows, there has been rapid cooling since 2016 that takes Australia back to 1980 level.
Say what? The UAH annual average temperature anomaly for Australia in 2023 was +0.48C; in 1980 it was +0.05C in 1990 it was -0.14C!
Right, so use the whole data set. The UAH trend for Australia from Dec 1979 to Dec 2023 is +0.18C per decade warming. That’s faster than the global rate.
Wait, aren’t you the same person who in this very same post just stated that “you can get trends any way you want from this data by starting and stopping at certain dates“?
The annual average Australian temperature anomaly in 2023 (+0.48C) was much higher than any annual average temperature anomaly in the 1980s, only 2 of which are even in positive figures.
For comparison, here are the annual mean temperature anomalies for Australia as published by UAH.
I will amend my statement to 2022 was cooler than 1980. So after 42 years of warming Australia is back to where it was in 1980.
Even the outlier in 2023 was cooler than the outlier of 1998.
Why not pick 1992 and 2023 for comparison?
It looks like the anomalies have peaked and are on the way down, as I had speculated recently.
Yes it is a sharp El Niño peak similar to the 1998 El Niño sharp peak but not quite as tall. The tip is warmer than 98 but this new one starts from a warmer base so it is actually shorter.
It will be interesting to see if we now get a long pause that is a little warmer than the previous pause between big El Niños. Since this has been the pattern since 78 it is at least likely.
When the AMO starts its long decline downward warming trend will stop and polar ice begins to rebuild.
When do you expect this to happen?
The warming trend in the Northern Hemisphere has only just started. There may be ups and downs but oceans will continue to warm for the next 9,000 years and land will continue to warm until the ice starts coming south and down from the mountain tops.
Humans are witnessing their first recorded interglacial termination. The climate modellers are only now realising that warmer oceans mean more snowfall. Humans are yet to experience heavy snowfall.
The snowfall records for this boreal winter are almost past but every boreal winter will set new snowfall records for millennia to come. So far Anchorage, Seoul and Moscow are a few of the notable locations that have set new snowfall records this northern winter. There may be more yet to come. Alaska is in for another dose with a 950hPa low approaching.UK is already in a 980hPa low that is bringing snow.
See my further comments concerning the possible effects of solar geo-engineering on the progression of ice ages here where I repeat my earlier question. Would solar geo-engineering using SRM accelerate the onset of another ice age, slow the onset of another ice age, or basically have no effect on the evolution of ice ages through time?
As an aside, back in the 1960’s, Russian scientists launched a trial balloon suggestion that a roughly 100-mile wide dam be constructed across the shallow waters of the Bering Strait with the objective of diverting the warmer waters of the north Pacific into the Arctic Ocean thus causing it to stay open all year round.
As the thinking went, warmer waters in the Arctic Ocean would cause more rain and snow to fall in Siberia, in Canada, and in the northern United States thus producing an increased potential for constructing more hydropower dams in the three participating nations.
The Americans and the Canadians dismissed the whole suggestion as being nuts. Not because it wouldn’t produce the desired effects, but because it was too costly and potentially too dangerous.
On the other hand, solar geo-engineering use SRM is both technically feasible and also financially feasible.
The two primary issues now preventing its adoption are (1) the real potential for unintended collateral damage; and (2) a quick end to the climate change gravy train if global mean temperature is quickly and permanently reduced by 2C in the space of a decade or less.
El Niño’s changing patterns: Human influence on natural variability
Solar Forcing of ENSO on Century Timescales
The second study:
A Walker switch mechanism driving millennial-scale climate variability
AAAAAAA ha ha ha. It was just a matter of time……… Oh God, I fear for the future if this crap continues.
Did you see all the “surmises”, “suggests” and other weasel-words in that load of junk-science.
Hilarious.!
Oh dearie me.. someone down-thumbs for saying that “surmise” and “suggests”, are not really science.
Must be a scientific simpleton. !!
Someone down voted me for correcting a typo the other day
Its all they have.
Australia, meanwhile, appears to have missed the message about extreme warming. How? Geoff S
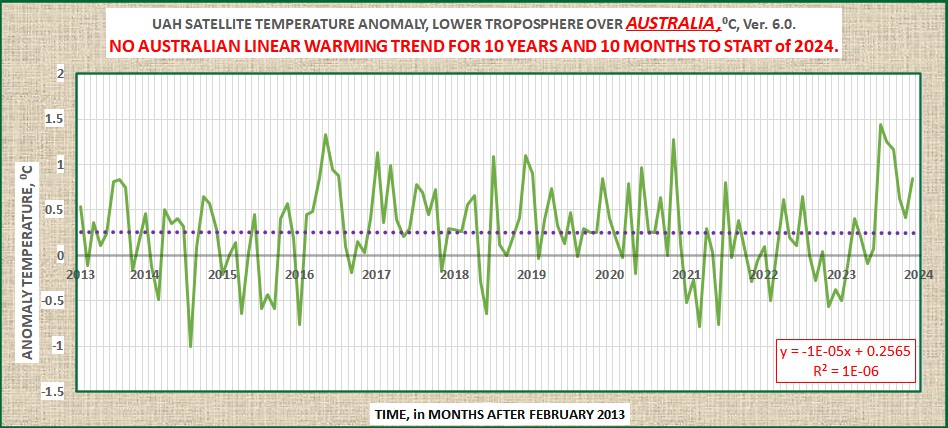
The alarmist warnings about the atmosphere over the Northern Hemisphere need an extra new factor to be measured.
The amount of human-made airborne Fentanyl is affecting minds, particularly of so-called news reporters. Not so much of it has reached Australia yet.
Geoff S
We can clearly see the indisputable influence of humans after August 2023 and possibly even July.
Mike,
Agreed, but ho-hum so far.
Compare with the bump at 2016-7, also a nothing burger.
Melbourne, my town, has been much cooler than usual for the past year.
That CO2 bogey man is selective, eh?
GeoffvS
Still a bit of a minor effect from the 2023 El Nino, though.
Without that El Nino, the zero trend would be much longer.
bnice2000,
Some lags in timing need explaining.
Geoff S
I delved into the weather data at the closest weather station near where I live. The monthly average for December for its entire recording period (1974-2023) is 30.5°F. I browsed through each month and collected each day with an assigned average of 30.5°F starting from 2023 and going back to 1998 in a Google Doc (link provided below for anyone to access). Each daily average has the date of the assigned average, the registered highs and lows, snow cover, and new snow fallen on that day. These can be called ‘slots.’
As I fully expected, the average can be calculated using very different temperature profiles, and there are a lot of different contexts these days. Was the day in the low 40s and high 10s? Was it a day in the high 30s and mid-20s? Was it snowing so that the temperature stayed near 0.0°C throughout the day? Was this average assigned due to an extreme cold front in mid-autumn or in the early to mid-spring? Was there snow falling this day or at the time of the recorded values? What about snow cover and therefore albedo? That would surely have an effect on the measurements. How would snow cover and sunlight together affect these recordings at their time? One day has almost 2 ft of recorded snow cover, while other days had none. What if the snow was melting throughout the day and was still melting at the time of these measurements? What if there were low-level clouds? What if it was very windy at the time of these recordings? What if there was a really bad inversion, which plagues the Salt Lake Valley and sometimes the upper benches every winter, and this trapped cold air at the time? Did you know that these are whole numbers that are rounded up if the decimal point is above 0.5 and down if below? Did you know that this weather station is situated on a sidewalk (I have visited this station before), which will produce corrupted temperatures all throughout the day and especially at night? Did you know this weather station isn’t situated on flat ground and instead is situated on sloped land? What about humidity?
In short, there is a lot of non-random UNCERTAINTY associated with this average. It could be any one of these ‘slots’; as such uncertainty only accumulates with each average.
https://docs.google.com/document/d/1KqU1XmDeeV6yZWUWjCrpCh-lsK5LhZAUVCI07bOOZwE/edit
What isn’t generally recognized is that the NOAA polar-orbit satellite coverage across the entire globe is highly non-uniform. In high-latitude regions (70-85 degrees) they sample grid points multiple times per day, but by 30 degrees latitude there can be as many as three days between samplings. It is even worse at the equator. Above 85 degrees the spots overlap so the spatial resolution breaks down.
What you are pointing out is that each station has it’s own microclimate and that it is doubtful that any two stations experience the same microclimate at the same time. The uncertainties that you mention for each thing add, hopefully in quadrature, but that is also an uncertainty.
NIST in TN 1900 explains that an observation equation is the correct model. This incorporates data variance as part of the uncertainty. they assumed that individual measurement uncertainty was negligible but it isn’t in the real world.
Read the GUM F.1.1.2 carefully. I’ve had to read it a number of times and cogitate on what it is trying to say. Although wordy, it fundamentally describes using both the data variance and the measurement uncertainty to calculate the total uncertainty of a property of a measurand. Exactly what NIST did even with assuming the measurement uncertainty is negligible.
Why isn’t every year the warmest year ever? Could it be that the steady rise in CO2 does not correlate? Oh dear. I note the collapse of this ‘powerful’ El Niño with fifty percent neutral or La Niña by July, no El Niño. Then another 30 months of La Niña and alarmist pseudo explanation?
The correlation looks pretty good to me.
An exercise in general linear regression…does not prove any sort of correlation.
To a statistician the term “correlation” means something. To the real world it’s pretty much meaningless unless there is a physical relationship involved.
To a statistician the divorce rate in Maine and the per-capita consumption of butter are “correlated” and is, therefore, an important relationship.
To a statistician the number of deaths from falling out of a fishing boat and the marriage rate in Kentucky are correlated and is, therefore, an important relationship.
To most of us in the real world, however, these are what are known as “spurious correlations”.
When considering the correlation between a temperature data set and A MODEL, the correlation is driven by data matching accuracy, not by a physical relationship.
The same thing applies to the correlation between CO2 and temperature, there’s no way to determine if it is a spurious correlation or is an actual physical relationship. All the “pauses” during CO2 growth legislates against it being a physical, at least a dominating physical, relationship. If it isn’t a dominating physical relationship then what is the dominating physical relationship? It should be the dominating physical relationship that should garner the most attention, not a minor one.
“To a statistician the term “correlation” means something. To the real world it’s pretty much meaningless unless there is a physical relationship involved.”
Almost as if correlation does not imply causation. I wonder why nobody has mentioned that before.
“To a statistician the divorce rate in Maine and the per-capita consumption of butter are “correlated” and is, therefore, an important relationship.”
How many real statisticians would claim that is an “important” relationship?
“When considering the correlation between a temperature data set and A MODEL, the correlation is driven by data matching accuracy, not by a physical relationship.”
Which is why it’s useful that all the independent variables in these models do have a plausible physical relationship with temperature.
“The same thing applies to the correlation between CO2 and temperature, there’s no way to determine if it is a spurious correlation or is an actual physical relationship.”
Apart from understanding the greenhouse gas theory, having decades of research into how CO2 can affect temperature, and making predictions that rising CO2 will cause a rise in temperature.
He has no idea what those weighting coefficients in his regression result mean…
Look carefully at your axes. The x-axis is time. The y-axis is “anomaly”. This is basically a time series and not a correlation of cause and effect.
“Anomalies” are NOT temperature. A cause will have an effect of absolute temperature, and not anomaly.
If you want to prove any correlation then use your “model” or “model – CO2” as an independent variable on the x-axis. Otherwise, you have just plotted gibberish. Learn some science!
Do enlighten me on how you believe a mere 2 ppm increase in CO2 this year played a significant role in suppressing the massive 2016 El Niño spike. The spike happened in one year – which is weather, not climate. I find it ironic that climate alarmists dismiss so-called short trends like 18-year pauses as irrelevant, preaching about the long term trend. Yet, here you are, hypocritically asserting that this sudden, natural event is proof of Co2’s scary influence on the climate. That sounds like propaganda to me.
Do you honestly believe you possess some mythical insight into the climate, as if you can accurately predict its behavior without considering CO2? The arrogance in thinking that the minuscule influence of CO2 (at a whopping 0.04% of the atmosphere) can override natural forces is downright absurd. Your naivety is truly remarkable, and it’s no surprise people around here enjoying making fun of your misguided understanding.
I never said it did. And I certainly don’t believe it either.
I think you have me confused with someone else. I don’t think the recent spike is caused by CO2. The model I present above should have made that clear. Regardless I don’t think CO2 is scary.
No. I don’t believe it is possible to predict the climate without considering CO2.
The irony is that the position being advocated for here is that the release of 150 MtH2O from Hunga Tonga is the cause of the recent warming spike. 150 MtH2O is a mere 0.000003% of the atmosphere.
Anyway, the 100 MtSO2 from Mount Tambora which caused the year without a summer is only 0.000002% of the atmosphere.
By request and in the spirit of what Bellman did I present the same data with the prediction on the x-axis.
I’ll tell you the same thing I told Bellman. You have no appreciation for measurements. Look at the values your model gives at 0.00. There is a 0.65 range in measurement which is about 33% of the total range on the graph. You can even get know the sign with this range.
If my barometer read 30.00 a ±15% range means the actual value could range from 25.50 to 34.50. An electrician tracing faults could have readings from a 120V wall socket of 102V to 138V.
How about blood alcohol level at or above 0.8 where 0.9 would be a DWI level? That range would give 0.77 (not inebriated) to 1.04 (inebriated). Would a judge find a person inebriated beyond a reasonable doubt?
Your model sucks in showing a correlation let alone a cause and effect. What kind of grade would you receive in lab where making correct measurements is paramount?
Him calling this a “model” is more than a stretch, those constants in him equation are what the general linear regression routine he used spit out. They are essentially dimensionless.
As a card-carrying member of the “First, plot the ‘raw’ data and just look at it …” school I updated the graph attached below.
I’m clearly missing an “important” contributory factor here, as for the first time UAH appears to be “rolling over” before ENSO does …
I’m out of ideas. Any suggestions ?
Yeah…2 consecutive drops has been enough in the past to confirm a rollover (unless I missed something).
It’s possible this time is different and that the atmosphere peak will occur prior to the ENSO peak. I guess we’ll just have to wait and see.
Nice! Wonder what the climate science explanation is? Time travellers messing with the data?
FWIW, I predicted this temperature peak back in 2012, based on observed periodicity.
« For 2023, I forecast a new super El Nino, in amplitude comparable with the 1998 and 1973 events and with a maximum value of 0.66 degrees. After 2023 the temperature will remain on a new plateau for another 25 years, which will be 0.163 degrees higher than the current plateau. »
https://klimaathype.wordpress.com/2012/05/07/the-carbon-dioxide-thermometer-revisited/
2013 was neutral.
In 2012 UAH was using the 1981-2010 baseline. The maximum value on that baseline for 2023 was 1.09 C in October.
As mentioned, FWIW, but there is a peak repeat time of 25 years
If the repeat time is 25 years than shouldn’t we have expected the next super El Nino to occur around 2040/1 and not 2023/4?
In the forecast graph green and red are the forecast after 2012, blue is observed up to 2012,
there was a spike in in 1973 and 1998.
1998-1973=25
1998+25=2023
2023+25=2048
There was also a spike in 2016.
2016-1998 = 18
2016+25 = 2041
Sure but that will be a lesser spike.
I think you’re missing the point. The point is that the cycle isn’t 25 years because the last 3 spikes have spacing of 18 and 8 years between them.
No YOU are missing the point because you did not read, super El Niños are spaced 25 years, 1973, 1998, 2023, of course there are other El Niños.
Geez. It’s boiling hot here in January in Canada. I remember the good old days of 1998 when temperatures were 15 hundredths of a degree cooler. Back before we pumped all that dreaded CO2 into the atmosphere. What have we done?
it will be interesting to study the 2023 CERES data to see where the radiative balance changed from 2022
guessing it was SW cloud cover changes similar to 2000-2020 but we’ll see
Enontekiö airport recorded -42.4°C at 6.21 UTC, the coldest January temperature in Finland since 2006. Some other reports from Lapland region:

-43.2°C Kvikkjokk-Årrenjarka, Sweden
-42.9°C Karesuando, Sweden
-42.7°C Jäckvik & Naimakka, Sweden
-42.5°C Nikkaluokta, Sweden
-41.8°C Kautokeino, Norway
Source: SHMI, Ogimet, FNMI
Without debating practical vs statistical significance of such findings and all yhings related to measurement accuracy, there is a simple question I’m yet to see answered.
While it certainly makes neater – and more inflammatory – news headlines to refer to global average temps, what work had been done to assess temperature variance and or trends on a more nuanced basis related to the underlying local climatic zone rather than assuming a homogeneous global average?
See for example,
https://www.britannica.com/science/Koppen-climate-classification#/media/1/322068/206711
A 0.5 degree change does not have the same implications for all parts of the planet!
Don’t hold your breath waiting for an answer.
Many of us have investigated temperature trends around the globe. There are many areas that show no warming over decades. The USCRN network has shown no warming for ~18 years. No hockey stick at all!
All the CAGW adherents here refuse, along with climate scientists, to explain or even recognize that this exists. I have seen nothing in scientific papers that explain how the U.S. has managed to escape GLOBAL WARMING. Nor have explanations of how many locations around the globe survive with no warming!
“The USCRN network has shown no warming for ~18 years.”
How many more times are you going top repeat this lie?
USCRN warming rate since 2005 is 0.31°C / decade.
That compares with the UAH global warming rate of 0.24°C / decade, or their USA48 are trend of 0.27°C / decade.
“I have seen nothing in scientific papers that explain how the U.S. has managed to escape GLOBAL WARMING.”
It hasn’t. According to UAH it’s been warming at a rate of 0.18°C / decade since 1979. Pretty much the same as the global land rate.
What do the satellites show?
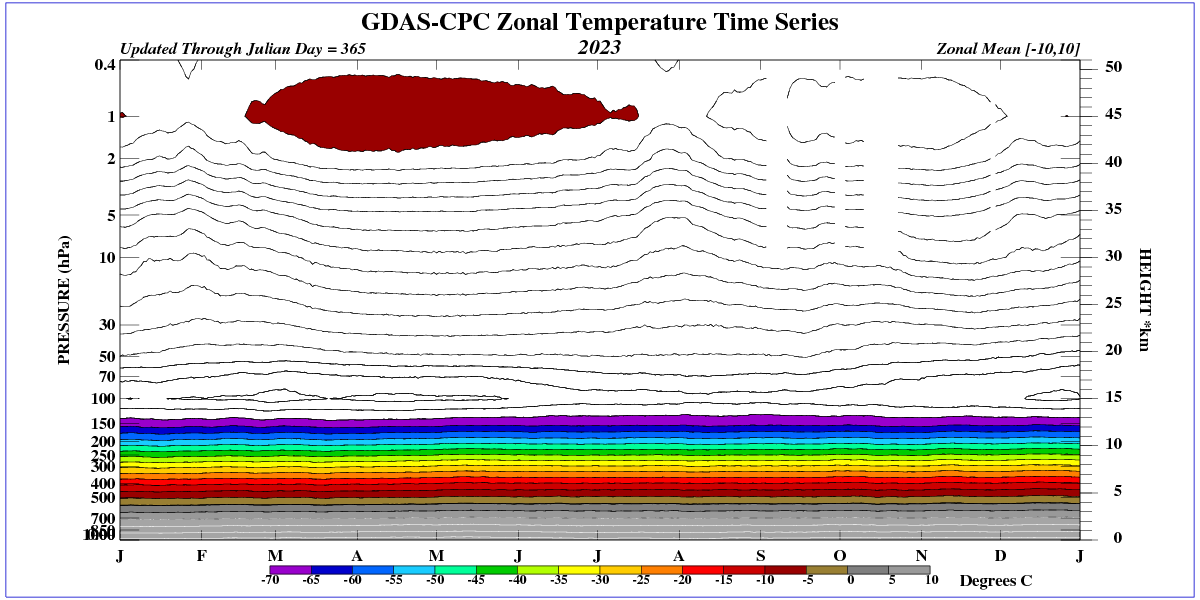
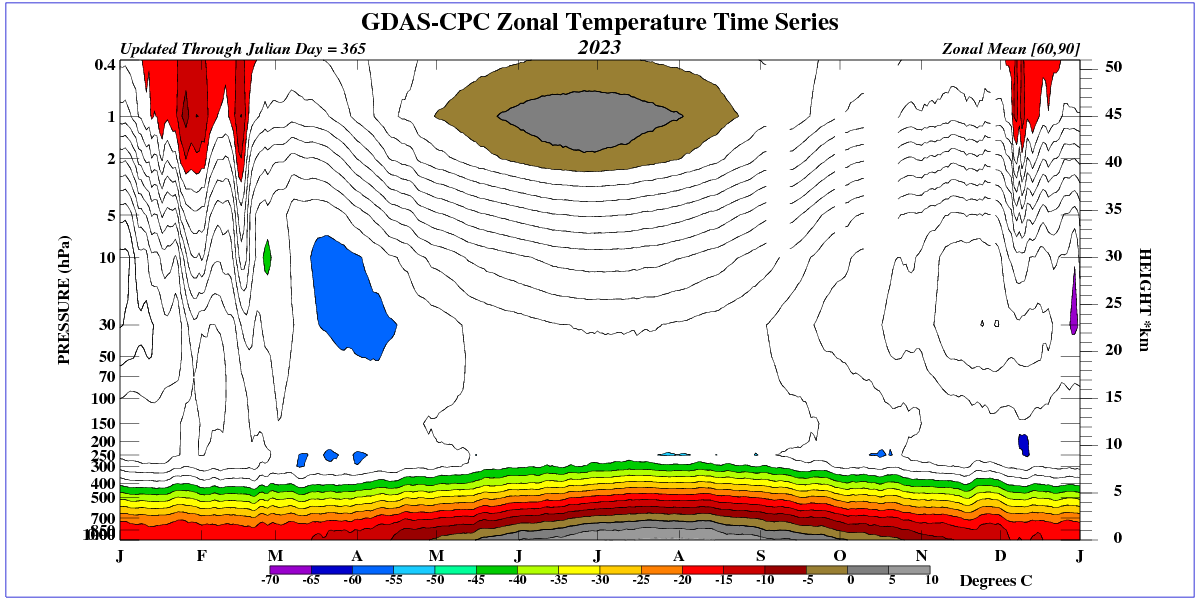
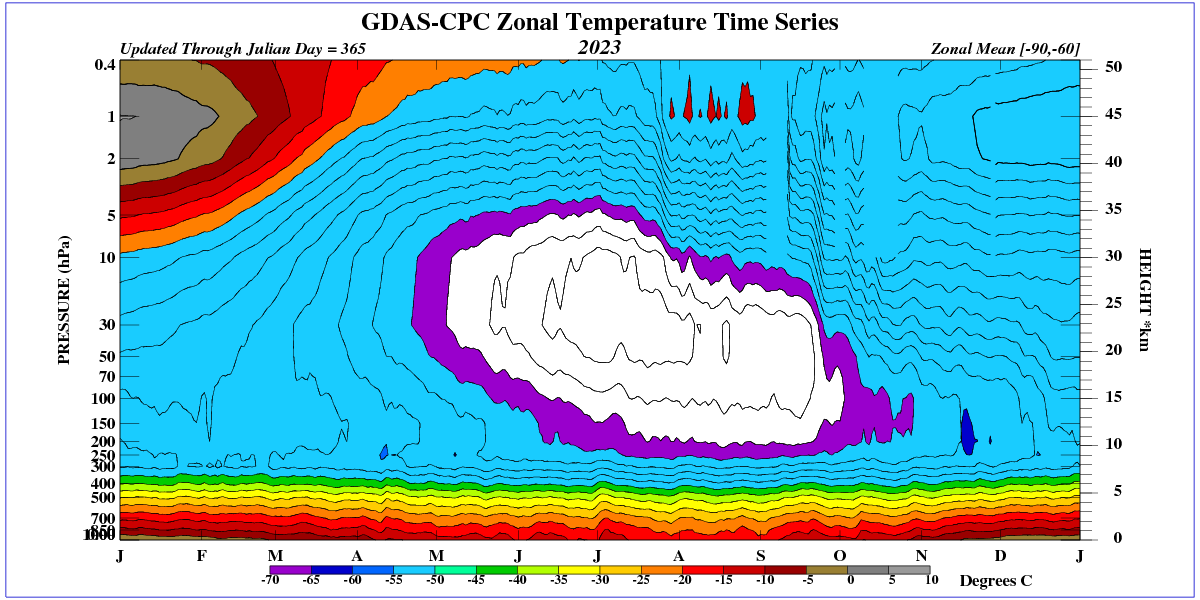
Invariably the lowest temperature at 100 hPa.
Global temperature can only rise with a marked increase in the density of the troposphere.
The troposphere contains 75 percent of atmospheres mass- on an average day the weight of the molecules in the air is14.7 lb..(sq. in.)- and most of the atmospheres water vapor. Water vapor concentration varies from trace amounts in Polar Regions to nearly 4 percent in the tropics. Most prevalent gases are nitrogen (78 percent) and oxygen (21 percent), with the remaining 1- percent consisting of argon, (.9 percent) and traces of hydrogen ozone ( a form of oxygen), and other constituents. Temperature and water vapor content in the troposphere decrease rapidly with altitude. Water vapor plays a major role in regulating air temperature because it absorbs solar energy and thermal radiation from the planets surface.
The troposphere contains 99% of the water vapor in the atmosphere. Water vapor concentrations vary with latitudinal position(north to south). They are greatest above the tropics, where they might be as high as 3% and decrease toward the polar regions.
In winter, the height of the tropopause decreases and above 60 degrees latitude is an average of only 6 km.