(In sailors’ parlance, an “old salt” is some fool like myself who has spent a good chunk of their life at sea …)
It seems that climate alarmists have a new focus—oceanic salinity. From the Florida Times-Union I find:
Researchers, including in Jacksonville, warn of perilous salinity changes in warming oceans
Matt Soergel, Florida Times-Union
Fri, July 28, 2023 at 12:32 PM PDT
Cliff Ross, University of North Florida marine biologist and chairman of the Biology Department, explores the Dry Tortugas west of Key West. He is part of an international team of researchers who just released a paper on changing salinity levels in the ocean as an effect of rapid climate change.
Cliff Ross notes that in stories and studies on human-caused climate change, most of the emphasis is on a rapidly warming world that is expected to only get hotter and hotter.
That’s fair enough, he says — and that’s taken on increased urgency as intense heat waves hammer various parts of the globe this summer, a phenomenon scientists are linking to climate change.
But Ross, a marine biologist who’s head of the Biology Department at the University of North Florida and part of an international research team, wants to bring attention to another effect of a hotter Earth — changing salinity levels in the world’s oceans, which could themselves bring about big changes across the planet.
It’s a complex issue, but those changing salinity levels could have major impacts on the world’s economy, on creatures that live in the ocean and on the residents of coastal areas — Florida certainly included.
So in theory, changing salinity levels “could” bring about big changes, and it “could” have major impacts?
Unimpressed by the could-ness, I went to see the underlying study in Global Change Biology
It turns out that the study contains enough “weasel words” to equip an entire species of Mustelidae. (“Weasel words” are words like “could”, “may”, or “might” that you can use so that your scientific claims can never be falsified.) Here are some examples from the study.
Salinity changes may impact diversity, ecosystem and habitat structure loss, and community shifts including trophic cascades
Changes to [salinity] may strongly contribute to ocean stratification
Reduction in [mangrove] growth … due to elevated salinity … may be exacerbated by other stressors
[Salinity] tolerant and euryhaline harmful algae blooms may be favored and impact ecosystem structure and function.
Such species could be affected by the projected end of the century salinity changes
Shifts in phytoplankton communities may trigger trophic cascades
Negative effects [of salinity] on sexual reproduction (e.g., lowered gamete viability, fertilization, and polyspermy) and altered disease susceptibility can lead to decreased genetic diversity that may change ecosystem structure and function
Indirect effects [on seagrass] by modifying the rate of top-down interactions with grazers and metabolic disadvantages may alter ecosystem structure and function.
Disruption of cellular processes and metabolic rates (e.g., caused by enhanced energetic requirements for osmo-adjustments) are common in marine fish and invertebrates and may disturb fertilization, development, and sensory perception
Certain taxa, particularly those adapted to high marsh conditions, could migrate to fresher ecotones
Although many cosmopolitan microbial taxa will persist throughout regional salinity changes, their function may change
Sea level rise connected with salinization as well as ecotone shifts and trophic cascades may contribute to substantially altered ecosystem structure and functionality.
It is further predicted that seawater intrusion and regional salinity increase will cause a shift from methanogenesis-dominated to sulfate reduction-dominated metabolism, which will likely lower CH4 production in the short term.
Future projections from the phase 6 of the Coupled Model Intercomparison Project (CMIP6) multi-model mean … show strong salinity changes that resemble the pattern of observed changes will continue
Mesopelagic fish larvae are usually distributed in high salinity waters, and even subtle drops in salinity (~1 psu) may impact egg and larval survival
Salinity-enhanced stratification may at least regionally suppress plankton biomass and productivity
For an organism, relocation or adjustment to osmotic and ionic stress may be energetically costly
Such species could be affected by the projected end of the century salinity changes (~0.5–1.0 psu)
It is of particular interest to understand which species are predicted to be the salinity change ‘losers’, as these may lead to altered or, in the most extreme case, loss of entire ecosystem functions.
While quantitative data are lacking, such short-term salinity variations may well pose a larger pressure on coral than the more consistent, long-term ocean scale salinity changes
Future shifts in salinity due to ice cap melting, precipitation variability, and SLR has the potential to alter global biogeochemical cycling, the effects of which are likely compounded by further climate change
For the nitrogen cycle, projected increases in nitrogen mineralization and reduced coupled nitrification–denitrification could result in increased NH4+ export from groundwater systems
Along the estuarine continuum, freshwater tidal and upland ecosystems may be the biggest ‘losers’ connected to changes in salinity.
Projected salinity changes on the order of ~0.5 to 1.0 psu until the end of the century in conjunction with increased short-term variations due to precipitation and runoff pattern changes are anticipated to lead to ecotone (i.e., transition areas between communities) or ecosystem shifts
Encroachment of halophyte species into fresher areas as saltwater reaches upstream may initially cause diversification of species at the ecotone and be an advantage to brackish taxa.
These regions are likely to undergo the most dramatic changes in salinity reduction and enhanced stratification
Salinity and inundation stress may also create a positive feedback loop for tidal wetlands at large, whereby stress and low reproduction leads to increased plant death and decay and decreased net carbon inputs, which then cause soil compaction and subsidence.
These responses may be influenced by any combination of physiological osmoacclimation and phenotypic plasticity (i.e., variation within strains), genetic variation among strains, and evolutionary osmoadaptation
We therefore applied distribution modeling to explore the effects of open ocean near-surface salinity changes on coral habitat suitability. Our models indicate pronounced responses to projected salinity changes.
In certain cases, [harmful algae blooms] may be induced by salinity changes
The ensuing shift to asexual reproduction promotes lower genetic diversity and may consequently impair the potential for adaptation to new selective marine regimes
Increasingly hyposaline conditions of the Baltic Sea may also cause a shift toward the prevalence of green algae
Climate model future projections (of end of the century salinity changes) indicate magnitudes that lead to modification of open ocean plankton community structure and habitat suitability of coral reef communities.
As wetland hydrology and seasonal rainfall patterns continue to change, die-offs in these areas may very well increase in frequency and coverage
By the end of the century, near-surface changes are projected to increase markedly, by an order of ~0.5 to 1.0 psu, and in the deep by about 0.05 psu.
Aquaculture may further be directly impacted
Salinity-triggered changes to global ocean currents (including the THC) and enhanced stratification may provide direct feedback on the rate of climate change, but the direct and indirect consequences on human socioeconomics remain difficult to quantify.
Accordingly, biodiversity shifts are projected as a result of salinity changes due to diversification within new niches
Existing research typically does not address spatial, diel, monthly, and seasonal variability of salinity. Enhanced short-term variability through extreme events (e.g., droughts, floodings) may well impose a stronger selective pressure on ecosystems than long-term changes
Future projections using the previous CMIP5 model suite are indicating these currently observed changes are likely to intensify
This review highlights that detailed data on the effects of salinity changes on the vast majority of ecologically and economically important ecosystems are lacking, which makes the projection of consequences highly inaccurate
Aaargh! Enough with the projections of potential and may and might and could! Not one of them is falsifiable, they all might happen … and?
Yes, projectionscould indicate the potential that it may be possible that I might win the lottery … but I’m not planning on using my potential lottery winnings for my retirement based on weasel words.
So, I decided to see what I could learn about salinity. Despite a life spent near, on, or in the ocean, despite spending years commercial fishing and ocean sailing and surfing and diving, my knowledge of the vagaries of ocean salinity at the start of this inquiry was … well, let me call it unimpressive and leave it at that.
In fact, most of what I knew of ocean salinity came from Izak Dinesen, who said:
The cure for anything is salt water—sweat, tears, or the sea.
That’s worked for me for my whole life, but I didn’t know, for example, whether the Atlantic is saltier than the Pacific (turns out it is). So I went about doing what I love to do … my homework on a subject where I know very little. Science for me is about the joy of learning.
It turns out that you can measure the salinity of the ocean from satellites. Who knew? Certainly not me. However, as is far too often true, they don’t make getting the data easy. In this case, I merely had to download 138 separate monthly NetCDF files, open each NetCDF file, extract the data for each month, resample that data to 180° latitude by 360° longitude, and create a 180 latitude x 360 longitude x 138 month array of the results where each layer in the array is a monthly global map of the salinity.
Easy money, right?
And at the end of that small matter of programming, here’s the average satellite-measured salinity over the recent period. Salinity is measured in “practical salinity units”, or “psu”.
Figure 1. Average sea surface salinity.
The global average is 34.6 psu, but there is some variation. Most of the globe is between ~ 32 and ~36 psu. The lowest surface salinity is in the Arctic, highest is in the Mediterranean. You can see the effect of the rainfall lowering the salinity in the Inter-Tropical Convergence Zone (ITCZ) in the Pacific above the Equator.
Next, I looked at how much the salinity in each gridcell changes over the course of the year.
Figure 2. Average annual range sea surface salinity.
In Figure 2, we can see that the average annual swing from highest to lowest salinity is about 1 psu. In general, swings are higher in the tropics and on the eastern temperate coasts of the continents.
How about the trends in salinity? Here, we need to be cautious because we only have a bit more than a decade of data. I’ll return to that issue in a bit. For now, here are the decadal trends in salinity.
Figure 3. Decadal trends in sea surface salinity.
Note that the trends are very tiny. In addition, there’s a curiosity about them. They are far from being normally distributed. They most closely follow what’s called a “Cauchy” distribution. Here’s the distribution of the gridcell-by-gridcell salinity trends shown in Figure 3.
Figure 4. Histogram showing the distribution of the sea surface salinity decadal trends in black. Best-fit Cauchy and Normal distributions are also shown.
Although the range of the average swings in annual sea surface salinity for the ocean is 1 psu, we’re supposed to get all excited about a possible change of a tenth of a psu or less …
Here are those salinity datasets, which cover from 1900 to 2019 on a monthly basis.
Figure 5. Long-term changes in surface and deeper salinity.
Now I’m sure folks will scream that I’m minimizing the trends by using a zero-based graph … but look at the trends. The surface trend is the largest, and it’s only 0.013 psu per century. Not per decade. Per century, during a century of general warming.
However, for those who want it, here’s a close-up of the surface salinity. To avoid misrepresenting the situation, however, I’ve expressed the changes as deviations from the mean value of the total dataset.
Figure 6. Long-term changes in surface salinity, closeup view.
Note that even including the seasonal variations, the global average sea surface salinity has only varied about ± 0.2% over the entire period, and in 2019 we were back right about where we started.
Finally, how do the long-term and short-term datasets compare? Unfortunately, there’s not a lot of overlap, but given that it’s the world of climate datasets, the agreement is not bad. It does show us why the long-term trend from the EN4 dataset is slightly positive, while the short-term trend from the OISST dataset is negative.
Figure 7. Overlap period, short- and long-term sea surface salinity datasets. Changes are shown as percentage variations from the mean.
So … that’s what I learned today about salinity.
TL;DR version?
While changing salinity may make some difference somewhere, there’s no “salinity crisis”. Nor is there any significant overall trend in the salinity despite a century of warming. The guy in the first picture just wants to get more funding to support his ocean addiction. And I can hardly blame him, it’s why I took up commercial fishing …
My very best to everyone,
w.
My Request: Quote the exact words you’re discussing. Misunderstandings are the bane of the Intarwebs.
Nice paper. Not too many if, ands, or buts from you!
Douglas
August 1, 2023 5:29 pm
Another fine post.
Thanks,Willis.
Here is Steve Goreham with an excellent take down of Ocean Salinity.
Excuse the basics.
“Ocean Salinity is grand whopper that is frequently delivered by climate scientists, the IPCC and environmental groups like the NRDC.
According to claims, man made emissions of carbon dioxide are being absorbed by the oceans, where it is being converted into carbonic acid, thereby changing the chemical balance of the oceans.
A solution is measured as acidic or basic (or alkaline) on a logarithmic 14 point scale, called the pH scale.
Battery acid has a pH of about one, while the base lye has a pH as high as thirteen.Seven on the pH scale is neutral.
Milk is slightly acidic as are most of the foods that we eat.
Measured in the open ocean, sea water is basic, with a pH of about 8.2 (Gretchen Hoffman et al., “High Frequency Dynamics of Ocean pH: A Multi- Ecosystem Comparison,” PLoSOne,Dec.2011,v.6,Iss.12,http://www.plosone.org/article/info%3Adoi%2F10.1371%2Fjournal.pone.0028983)
The oceans will never be acidic.
What we are discussing is a fear of impacts from a reduction in alkalinity.
According to computer models, doubling of atmospheric CO2 would decrease ocean pH to about 7.9, still basic but less so.( “Ocean acidification due to increasing carbon dioxide,
”The Royal Society,June 2005,www.royalsoc.ac.uk)….
It’s probably as difficult to develop a global average of ocean alkalinity as it is to develop a global average of surface temperature.
The pH of the ocean varies by depth, becoming less basic as one goes deeper.
It varies by latitude as one moves from the equator to the poles.
It varies by location such as open ocean,coral reef, or kelp bed.
Scientists still know little about the alkalinity of today’s ocean or the oceans of past centuries.
A December 2011 study by scientists at the Scripps Institution of Oceanography found large variations in ocean pH by month, week, and even time of day.
Dr.Gretchen Hoffman led a team that measured pH at 15 locations in the Atlantic, Pacific and Antarctic Oceans.
They found that pH changes were large, from 0.1 to 1.4 units over a 30 day period.
They also found that pH changed by as much as 3.5 units over a course of days.
The study concludes that “ climatology-based forecasts consistently underestimate natural variability” and that ocean residents “are already experiencing pH regimes that are not predicted until 2100 by the climate models”.
tmatsci
August 1, 2023 5:42 pm
So many “weasels”. Is it a gang of weasels, or a pack of weasels, or maybe a sneak of weasels or more likely a confusion of weasels!
While doing some reading and quizzing the AI, it has come to my attention that to oceanographers, “salinity” does not refer to strictly sodium chloride, which is a common definition.
In oceanography, it apparently refers to all dissolved ionic substances, which greatly complicates the issue and makes it very unclear what people are saying, depending on what definition they are using.
Is there a clear list of all ionic substances? Or is it another term that is open-ended enough to be redefined again and again for the purposes of scaring the public?
I was joking, by changing advective to adjective.
Geoff S
RERT
August 2, 2023 2:49 am
Thanks Willis, excellent as usual. Thanks to your hard work, you may potentially have increased my understanding of ocean salinity by over 100,000%….
Wim Rost
August 2, 2023 4:24 am
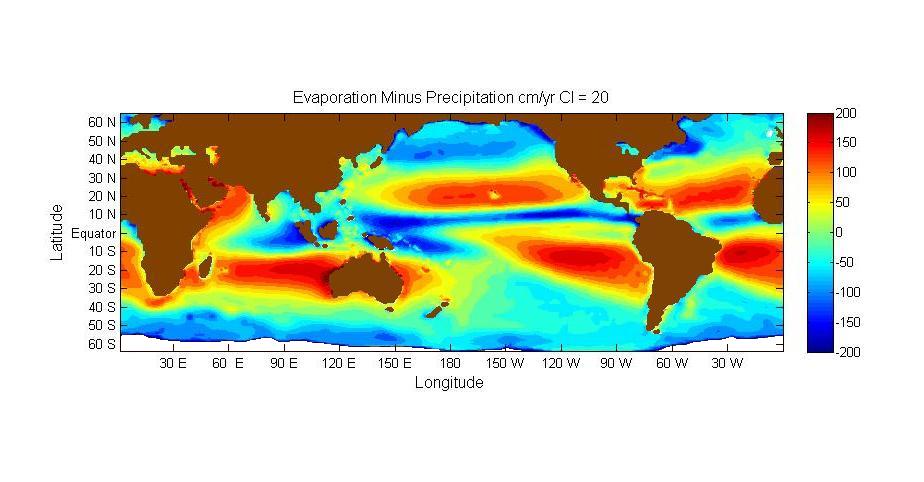
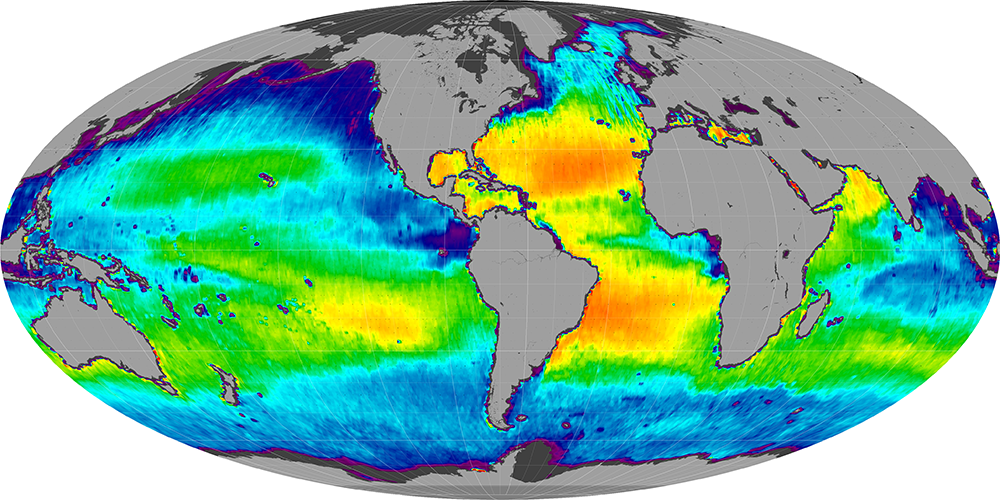
Changes in evaporation minus precipitation reflect salinity changes. High evaporation results in higher salinities found over the subtropical gyres over the oceans. See the following maps.
In case of high solar uptake by subtropical oceans (by larger/more frequent high-pressure areas over those regions), higher Sea Surface Temperatures will result in higher evaporation. Higher regional temperatures affect global temperatures. Keeping that in mind it is interesting to look at Willis’ graphic about changes in sea surface salinities: ?resize=720%2C664&ssl=1
Interestingly, the ‘Warm Thirties’ are well visible, like the warming of the eighties and the 2010’s.
‘Weather patterns’: the ‘in-between Weather and Climate’ patterns are often forgotten as a reason for ‘change’ and for ‘natural variation’. Warming and cooling periods coincide with changed Weather Patterns over larger surface areas. Those Weather Patterns result in changing wind strength and changing wind directions, also over oceans. Changes in the ocean’s energy transport follow, finally resulting in …. changing wind and weather patterns.
No one who is doing serious scientific inquiry of changes in conditions to some location or biome, ought to proceed until they have delineated the magnitude of natural variability.
It simply is not logical or sensible to get alarmist about changes that are swamped by the existing spatial and temporal variability, whether salinity, pH, temperature, or whatever.
It is not unlike warmistas screaming about the end of the world resulting from changes that are smaller than what has and is occurring over every timescale that can be specified.
That is of course why one of the first tasks of the alarmist cult was to erase all references to and records of past warmth and variability.
The Ocean Acidification doomsters would have us believe the pH of the ocean is fixed and stable, small changes disastrous, and aquatic life extremely fragile and sensitive to any variances or changes.
All of which is nearly or exactly the opposite of the actual case.
I anticipate big accolades and fat grants to anyone who can blaze the trail down whole new avenues of ridiculous alarmism.
Dodgy Geezer
August 2, 2023 6:13 am
From: Grants Committee
To: Prof. Till Rothig
Dear Professor,
Thank you for your paper, which is full of ifs and mays.
We might renew your grant next year.
Tern11
August 2, 2023 8:55 am
Of all sad words of tongue or pen, The saddest are these, “It might have been!” John Greenleaf Whittier
The areas of maximum biologic productivity are much more “acidic” than coastal Hawaii – which is an area of clear waters because it’s an oceanic desert. Little phytoplankton. The point is not to say an oceanic pH of 8.0 is better than 8.1, but that life prefers the conditions of upwelling minerals that come with lower pH values.
Upwelling zones and estuaries, both powerful biologic zones, will vary or routinely be at values of 7.8. Life handles this.
The oceans aren’t about to die. And large scale non luving carbonates buffer changes.
(“Weasel words” are words like “could”, “may”, or “might” that you can use so that your scientific claims can never be falsified.) Here are some examples from the study.
damned if you do damned if you don’t.
damned if you use language o indicate that your claim is
not settled.
damned if claim your claim is settled.
Here is my rule. When i see someone Whine about language I’m pretty ceratin they dont understand language, meaning, or science.
It might rain tommorrow.
is this falsifiable? yes . Why? because it references observables.
god loves me
is this falsifiable? no. why not. because it doesnt contain observables.
of course I use the word “might” to indicate the CONTINGENT nature of my knowledge
but from the begining falsifiability (bility) and verifiability have rferenced
one thing:: a statements empirical content.
every bachelor is unmarried is not falsifiable because it has no empirical content.


Willis,
Nice paper. Not too many if, ands, or buts from you!
Another fine post.
Thanks,Willis.
Here is Steve Goreham with an excellent take down of Ocean Salinity.
Excuse the basics.
“Ocean Salinity is grand whopper that is frequently delivered by climate scientists, the IPCC and environmental groups like the NRDC.
According to claims, man made emissions of carbon dioxide are being absorbed by the oceans, where it is being converted into carbonic acid, thereby changing the chemical balance of the oceans.
A solution is measured as acidic or basic (or alkaline) on a logarithmic 14 point scale, called the pH scale.
Battery acid has a pH of about one, while the base lye has a pH as high as thirteen.Seven on the pH scale is neutral.
Milk is slightly acidic as are most of the foods that we eat.
Measured in the open ocean, sea water is basic, with a pH of about 8.2 (Gretchen Hoffman et al., “High Frequency Dynamics of Ocean pH: A Multi- Ecosystem Comparison,” PLoSOne,Dec.2011,v.6,Iss.12,http://www.plosone.org/article/info%3Adoi%2F10.1371%2Fjournal.pone.0028983)
The oceans will never be acidic.
What we are discussing is a fear of impacts from a reduction in alkalinity.
According to computer models, doubling of atmospheric CO2 would decrease ocean pH to about 7.9, still basic but less so.( “Ocean acidification due to increasing carbon dioxide,
”The Royal Society,June 2005,www.royalsoc.ac.uk)….
It’s probably as difficult to develop a global average of ocean alkalinity as it is to develop a global average of surface temperature.
The pH of the ocean varies by depth, becoming less basic as one goes deeper.
It varies by latitude as one moves from the equator to the poles.
It varies by location such as open ocean,coral reef, or kelp bed.
Scientists still know little about the alkalinity of today’s ocean or the oceans of past centuries.
A December 2011 study by scientists at the Scripps Institution of Oceanography found large variations in ocean pH by month, week, and even time of day.
Dr.Gretchen Hoffman led a team that measured pH at 15 locations in the Atlantic, Pacific and Antarctic Oceans.
They found that pH changes were large, from 0.1 to 1.4 units over a 30 day period.
They also found that pH changed by as much as 3.5 units over a course of days.
The study concludes that “ climatology-based forecasts consistently underestimate natural variability” and that ocean residents “are already experiencing pH regimes that are not predicted until 2100 by the climate models”.
So many “weasels”. Is it a gang of weasels, or a pack of weasels, or maybe a sneak of weasels or more likely a confusion of weasels!
Got to be sciency here – the reference is https://www.online-field-guide.com/what-is-a-group-of-weasels-called/
While doing some reading and quizzing the AI, it has come to my attention that to oceanographers, “salinity” does not refer to strictly sodium chloride, which is a common definition.
In oceanography, it apparently refers to all dissolved ionic substances, which greatly complicates the issue and makes it very unclear what people are saying, depending on what definition they are using.
Is there a clear list of all ionic substances? Or is it another term that is open-ended enough to be redefined again and again for the purposes of scaring the public?
That may be the lamest, wishy-washy article I have read.
That’s a publication in itself, Eric. Go for it.
This is in reply to Geoff S, for some reason I can’t post in the proper place.
https://wattsupwiththat.com/2023/08/01/salty-news-from-an-old-salt/#comment-3758964
Hi Geoff
Scientists use that term.
https://en.wikipedia.org/wiki/Great_Salinity_Anomaly
https://agupubs.onlinelibrary.wiley.com/doi/full/10.1029/2003GL019334
I was joking, by changing advective to adjective.
Geoff S
Thanks Willis, excellent as usual. Thanks to your hard work, you may potentially have increased my understanding of ocean salinity by over 100,000%….
Changes in evaporation minus precipitation reflect salinity changes. High evaporation results in higher salinities found over the subtropical gyres over the oceans. See the following maps.
Evaporation minus Precipitation:
Salinity:
In case of high solar uptake by subtropical oceans (by larger/more frequent high-pressure areas over those regions), higher Sea Surface Temperatures will result in higher evaporation. Higher regional temperatures affect global temperatures. Keeping that in mind it is interesting to look at Willis’ graphic about changes in sea surface salinities:
 ?resize=720%2C664&ssl=1
Interestingly, the ‘Warm Thirties’ are well visible, like the warming of the eighties and the 2010’s.
‘Weather patterns’: the ‘in-between Weather and Climate’ patterns are often forgotten as a reason for ‘change’ and for ‘natural variation’. Warming and cooling periods coincide with changed Weather Patterns over larger surface areas. Those Weather Patterns result in changing wind strength and changing wind directions, also over oceans. Changes in the ocean’s energy transport follow, finally resulting in …. changing wind and weather patterns.
Perhaps all we see is Natural Variation.
No one who is doing serious scientific inquiry of changes in conditions to some location or biome, ought to proceed until they have delineated the magnitude of natural variability.
It simply is not logical or sensible to get alarmist about changes that are swamped by the existing spatial and temporal variability, whether salinity, pH, temperature, or whatever.
It is not unlike warmistas screaming about the end of the world resulting from changes that are smaller than what has and is occurring over every timescale that can be specified.
That is of course why one of the first tasks of the alarmist cult was to erase all references to and records of past warmth and variability.
The Ocean Acidification doomsters would have us believe the pH of the ocean is fixed and stable, small changes disastrous, and aquatic life extremely fragile and sensitive to any variances or changes.
All of which is nearly or exactly the opposite of the actual case.
I anticipate big accolades and fat grants to anyone who can blaze the trail down whole new avenues of ridiculous alarmism.
From: Grants Committee
To: Prof. Till Rothig
Dear Professor,
Thank you for your paper, which is full of ifs and mays.
We might renew your grant next year.
Of all sad words of tongue or pen,
The saddest are these, “It might have been!”
John Greenleaf Whittier
Yep …
The areas of maximum biologic productivity are much more “acidic” than coastal Hawaii – which is an area of clear waters because it’s an oceanic desert. Little phytoplankton. The point is not to say an oceanic pH of 8.0 is better than 8.1, but that life prefers the conditions of upwelling minerals that come with lower pH values.
Upwelling zones and estuaries, both powerful biologic zones, will vary or routinely be at values of 7.8. Life handles this.
The oceans aren’t about to die. And large scale non luving carbonates buffer changes.
I don’t see any science there. Just conjecture.
(“Weasel words” are words like “could”, “may”, or “might” that you can use so that your scientific claims can never be falsified.) Here are some examples from the study.
damned if you do damned if you don’t.
damned if you use language o indicate that your claim is
not settled.
damned if claim your claim is settled.
Here is my rule. When i see someone Whine about language I’m pretty ceratin they dont understand language, meaning, or science.
It might rain tommorrow.
is this falsifiable? yes . Why? because it references observables.
god loves me
is this falsifiable? no. why not. because it doesnt contain observables.
of course I use the word “might” to indicate the CONTINGENT nature of my knowledge
but from the begining falsifiability (bility) and verifiability have rferenced
one thing:: a statements empirical content.
every bachelor is unmarried is not falsifiable because it has no empirical content.
its a tautology, true by definition