by Jim Johnstone and Judith Curry
With the Atlantic hurricane season underway, we are closely monitoring the exceptionally warm SSTs in the Atlantic. This post describes what has been happening and why.
Atlantic SSTs
Sea surface temperatures (SSTs) over much of the North Atlantic are exceptionally high in late June 2023, due largely to a period of rapid warming that began around March-April.

Figure 1. SST anomalies on June 27, 2023 (top) and daily time series for regions marked above.
Daily SST time series in Fig. 1 show the recent SST evolution in several regions, marked in the map above, including the eastern Pacific Niño3 region, the North Atlantic Arc, the Caribbean Sea and the tropical North Atlantic Main Development Region (MDR). North Atlantic SST indices show evidence of irregular warming since March-April and peak warmth in early June. Warm conditions in the eastern equatorial Pacific reflect current El Niño conditions, which have intensified steadily since the beginning of 2023.
Local SST anomalies ≥1°C (1995-2019 baseline) are present throughout a basin-scale ‘Arc’ pattern that represents the leading natural structure of coherent SST variability on a wide range of time scales (Fig 1). The exceptional magnitude of recent North Atlantic warming can be seen in monthly Arc-averaged SST anomalies back to 1980, illustrated in Figure 2. Following a period of relatively little variability since 2020, Arc SST elevated steeply over the past several months, reaching a historic maximum in June.

Figure 2. Monthly Arc-averaged SST anomalies from 1980 to June 2023.
Atmospheric circulation patterns
June atmospheric conditions over the North Atlantic are also highly unusual, as indicated by a North Atlantic Oscillation (NAO) index anomaly nearly 3 standard deviations below the monthly average. The NAO is defined by the subtropical – subpolar difference in atmospheric sea-level pressure (SLP) anomalies, and approximately reflects the intensity of the low-level atmospheric circulation over the North Atlantic basin. Extreme low NAO values in June are consistent with a very weak subtropical high (Bermuda High) and relatively stagnant surface winds, involving weakness of the midlatitude westerly flow and the tropical-subtropical easterly trade winds.
The climatological June SLP and surface wind patterns are shown in the left panel of Fig. 3. Conditions in June 2023, in the center panel, show a remarkably weak subtropical high and an absence of westerly surface winds in the midlatitudes. June 2023 SLP and wind anomalies, shown in the right panel, consist of unusually low pressure and cyclonic circulation over much of the basin, which reflects weakness of the mean anticyclonic flow pattern.

Figure 3. June patterns of atmospheric SLP and surface winds. Left: June averages (1995-2022). Center: Conditions in June 2023. Right: June 2023 anomalies (observations minus climatology). The + and – markers in the left panel show the centers of action of the North Atlantic Oscillation, calculated as the subtropical (+) minus subpolar (-) SLP anomaly difference.
An extreme negative NAO index in June was preceded by moderately negative anomalies in both March and April (Table 1), which led to repeated monthly warming of the North Atlantic Arc and extreme cumulative effects by late June. The Arc warming observed from February to June (+0.85°C) exceeds the total net Atlantic warming of the past century.

Table 1. Monthly anomalies of the NAO index, Arc SST tendency (dSST) and SST. March, April and June (red) were months of negative NAO anomalies (low subtropical SLP and weak surface winds) and Arc warming.
Figure 4 illustrates the magnitude of the June NAO anomaly in context of the historical record since 1980. The very low June 2023 NAO value is not unprecedented in the monthly climatological values; however, it is extremely low relative the previous June values and spring (Mar-Jun) values.

Figure 4. North Atlantic Oscillation (NAO) index, defined by the normalized subtropical (Azores) minus subpolar (Iceland) SLP anomaly difference. Top: Monthly anomalies (all months), with March-June 2023 values highlighted in red. Middle: June values. Bottom: March-June averages.
Coupled anomalies and changes
Atmospheric anomalies associated with the NAO are primary drivers of Arc SST perturbations over short (monthly to seasonal) time periods. Figure 5 illustrates monthly anomalies of net shortwave (solar) surface heat flux, turbulent (latent/evaporative plus sensible) heat flux, total heat flux, and SST tendencies. Negative NAO anomalies correspond to negative subtropical SLP anomalies and weak trade winds to the south, including the MDR. Weak trades warm the underlying sea surface primarily by hindering evaporative cooling, but affect tropical SSTs through several complementary mechanisms, simultaneously favoring warming through reductions in stratocumulus cloudiness, Saharan dust advection, upper-ocean mixing and coastal upwelling off NW Africa. Overall, the turbulent flux associated with weak winds has dominated over the shortwave flux in warming the Atlantic.

Figure 5. Monthly downward surface heat flux anomalies and SST tendencies from March through June 2023. Arc warming in March, April and June can be primarily explained by weak surface winds (due to – NAO anomalies) and low rates of evaporative cooling (positive turbulent heat flux).
The recurrence and growth of extreme NAO- conditions and Arc warmth in recent months is likely due in part to positive SST-atmosphere feedbacks. NAO / Arc patterns in the atmosphere / upper ocean are closely related to those of the Atlantic Meridional Mode (AMM), wherein warm SSTs and weak trade winds can be sustained or amplified through mutual reinforcement.
Another contributor to the remarkable spring changes in the North Atlantic may be the broader tropical warming involving the transition to El Niño conditions. Surface warming in the tropics typically leads to quasi-uniform elevation of tropospheric temperatures and geopotential heights throughout the tropical belt from ~20°N to 20°S. Spring increases in 250 hPa geopotential heights (Z250) over the tropics were accompanied by declines immediately poleward over the subtropical NE Pacific and North Atlantic, while SLP anomalies dropped steeply in a coherent tropical zone from the central Pacific to the eastern Atlantic.

Figure 6. Anomalies of 250 hPa geopotential heights (Z250) and SLP during JFM and AMJ 2023. Increases in tropical Z250, declines in subtropical Z250 and declines in tropical SLP occurred simultaneously over the E Pacific and N Atlantic in early 2023.
African dust, pollution, wild fire smoke and Hunga-Tonga
As shown in Figure 5, the extremely warm Atlantic SSTs this season is partly due to anomalous radiative warming of the surface. The twitterati have blamed many factors: CO2 emissions, lower amount of sulfate particles from clearer shipping fuels, Hunga-Tonga eruption, and low levels of African dust. And now the Canadian wildfires are a factor. These are all relatively minor factors compared to the dominant impact of variations in cloudiness.
Atmospheric particulates have been reduced globally from cleaner fuels for shipping that were mandated in 2020, which produce fewer sulfate particles. Sulfate particles have a cooling effect by reflecting solar radiation. Cleaner air means less solar radiation is reflected, which contributes to surface warming. Indirect effects include darkening of subtropical clouds, through cloud microphysical effects, which reduces the reflectivity of these clouds. The ocean warming effect of this would be largest in the Northern Hemisphere, and subtropical clouds are most susceptible to this kind of modification. In the image below you can see the ship tracks from the brighter clouds, that are more reflective of solar radiation (these ship tracks have now been substantially reduced) [link]
Particulates from wildfire smoke has a similar effect on reducing the solar warming at the surface. My contacts in New York estimated that solar power production was cut in half during the period when a thick layer of smoke from the Canadian wildfires. For smoke trajectories into the North Atlantic, there will be variable surface cooling, depending on the smoke trajectory and optical depth
African dust storms have the same effect in terms of reflecting solar radiation and thus cooling the surface. Dust storms have been anomalously weak so far (from Michael Lowry):

But the bottom line is that a major Saharan dust outbreak doesn’t have a big impact on sea surface temperatures: “Saharan dust outbreaks can decrease the surface shortwave radiation up to 190 W/m2, and an analysis of the corresponding SSTskin changes using a thermal skin model suggests dust-induced cooling effects as large as −0.24 K during daytime and a warming effect of up of 0.06 K during daytime and nighttime respectively.” [link]
Another radiative effect is from the Hunga-Tonga eruption in 2022. Normally volcanoes spew sulfate particles in the stratosphere, which reflects sunlight and so has a cooling effect on the surface. However the Hunga-Tonga eruption was associated with little sulfur dioxide (which converts into sulfate particles, with an estimated cooling impact of 0.004oC in 2022. The main climatic impact of Hunga-Tonga eruption is the large amount of water vapor that was ejected into the stratosphere from the Hunga-Tonga volcanic eruption, which is estimated to have increased stratospheric water content by 10-15% with a 0.034 oC global warming over the next 5 years. [link]
Here’s a screen shot from Zoom Earth on 6/24, showing smoke from the Canadian wildfires and African dust. The whiteness of the smoke in the satellite image, relative to the Saharan Dust, indicates the large optical depth of the smoke (which is proportional to the surface cooling effect).

Summary
The extreme North Atlantic conditions that developed in recent months are likely due to a combination of dynamical factors, including stochastic weather anomalies, regional positive feedbacks and global-scale changes. The high rate of recent Arc warming is particularly noticeable due to the extreme SST anomalies it produced; however comparable warming over periods of ~4 to 6 months occurred previously in late winter to spring seasons of 1983, 1987, 1989 and 2010 (Figure 2), which preceded a wide range of late summer hurricane anomalies.
The dominant cause of the warm SSTs is dynamical (atmospheric circulations) that modify surface wind speeds (evaporation; apparently the largest factor) and clouds (solar radiation). Minor non-cloud radiative impacts: Hunga-Tonga is a global effect, sulfate ship tracks is local ocean effect primarily in northern hemisphere, wildfire impact on oceans is relatively rare and event driven, and African dust is a regular summer feature that is characterized by discrete events. Cloud variability in most locations will dominate over aerosol forcing in terms of impacts on sea surface temperatures. Some minor Atlantic Ocean cooling can be expected with Canadian smoke and Saharan dust.
Joe Bastardi shares Dr. Arther Viterito’s ideas on his blog. Seafloor spreading cycle increases ocean bottom heating.
Dr. Bill Gray wanted to study this stuff thirty years ago, but dingbat Gore defunded all attempts. Glad to see we are finally looking beyond CO2.
Iceland volcanoes have shown new recent activity. This country straddles the northerly end of the seafloor spreading
zone and is entirely composed of volcanics generated by it.
Physicist John Reid has a blog post on his Blackjay site on this: https://blackjay.net.au/north-atlantic-heatwave/
Thirdly, there is a better explanation of the present heating event than long wavelength infrared (LWIR) trapping by greenhouse gases, viz.: that the water has been warmed by increased volcanic activity on the ocean floor along the Mid-Atlantic Ridge south of Iceland. There is evidence of such behaviour occurring previously during the field phase of World Ocean Circulation Experiment (WOCE) in the 1990s. Here is the vertical section salinity plot for North-South transect, A16.
The salinity is highly unstratified with large vertical columns implying strong, deep convection between 10N and 50N. This suggests heat sources on the ocean floor such as hydrothermal vents or active volcanoes. This could also account for zero LCS in the North Atlantic, because local warming due to CO2 would be masked by temperature fluctuations due to volcanic effects.
This is not the first time that North Atlantic vulcanism has affected European weather. The eruption of the Icelandic volcano, Loki, in 1783 devastated European agriculture. The ensuing famine may well have led to the French Revolution.
Joe and Dr. Viterito’s ideas are half-baked speculation based on a spurious correlation.
Prove me wrong.
Use of the word “spurious” is uncalled for. And I recall, (as a boy in the 1950’s), the whole idea of continental drift was once deemed a “half-baked speculation”.
It is true that “correlation is not causation”, but to ignore a correlation staring you in the face is a good way to get called out on strikes.
Self edit
Never mind
I for one agree that the correlation is highly dubious.
For one thing, any water at the bottom which is warmed by undersea vents would take hundreds of years to rise up to the surface, and it would do so half a world away.
And everyplace where deep water wells up to the surface, it is extremely cold compared to the Sun warmed surface water it rises into.
Simply said, bottom water is cold, very cold, and it thus has no physical ability to rise through miles of ocean column to become surface water.
And water in that region of the ocean is always claimed to be sinking as part of the fabled “North Atlantic Meridional Overturning”. So how is deep sea volcanism causing warming of the surface?
Besides for all of that, this so called ‘warm water”, is pretty chilly stuff. It is only slightly warmer than average.
I suspect wondering what is “causing” such an anomaly, is akin to wondering what causes a certain land area to be somewhat warmer than average for a time. Explaining such things, to the extent that there is any explanation beyond random fluctuations, would have to involve first understand every factor that makes the water whatever temperature it is and how those factors and that temp changes over time.
IOW…no one knows, because it is too complicated. The factors are literally everything that happens in the sky, and in the air and in the water.
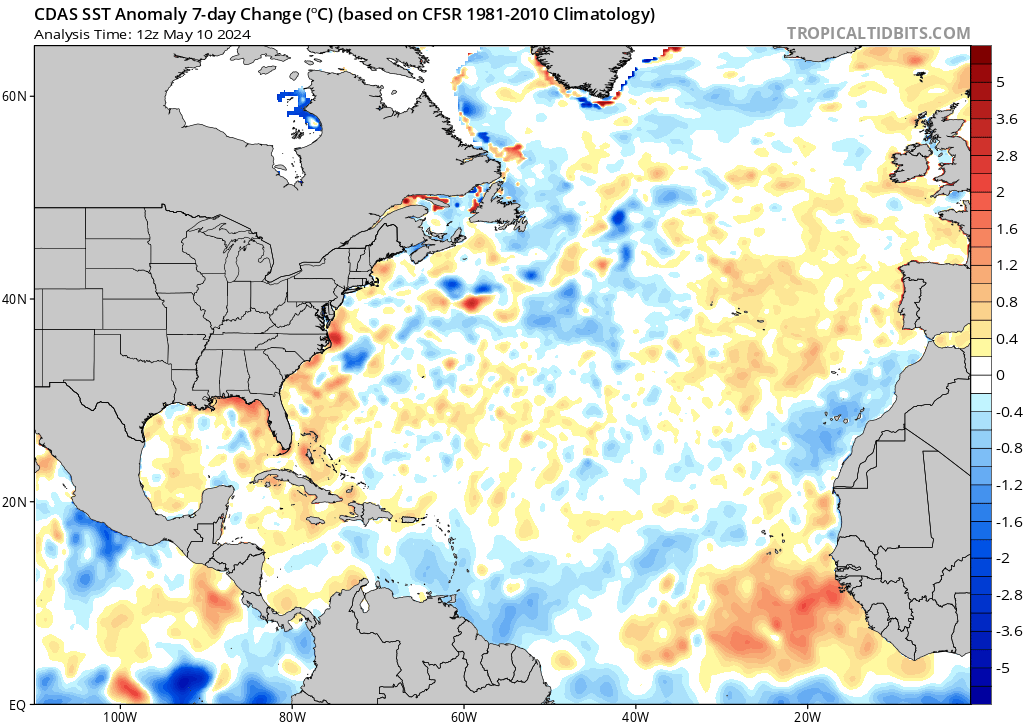
Oh, yeah, here is the actual water temp, as opposed to the anomaly.
Not so easy to spot any blobs or warm plumes when you look at the actual sea surface temperature. Nothing resembling what I would call “warm water” in that region:
No, wrong.
There is no hot water at the bottom of the ocean, except in very small amounts right at deep sea vents.
Guess why they do not just say what the temp is, and instead talk about temperature anomalies and ocean heat content of the entire ocean?
Because when you divide it by volume, it amounts to changes that are smaller than the resolution of the devices doing the measuring.
See above link to John Reid’s article .
Don’t have to.
You have to prove that CO₂ and/or that sunlight heats the North Atlantic and not just the very shallow depth SST, but deeper waters as well.
Too little energy in the wrong place. The bottom of the ocean does not participate in climate. People that push these ideas usually have a complete lack of knowledge about oceanography, which is a must if you are going to talk about the ocean.
Doesn’t El Niño warm the Atlantic ocean similar to the way it warms the Pacific ocean? Is that just being assumed here (since it wasn’t mentioned)?
The Niño regions are separated physically by Central America so it can’t warm the Atlantic unless the flow goes through the Arctic first, which it doesn’t appear to have done. However there will be Arctic sea ice extent reductions from the El Niño warmth.
El Niño is a temporary slow down in Eastern Pacific cold water upwelling so probably not.
David writes, “El Niño is a temporary slow down in Eastern Pacific cold water upwelling…”
Really? Provide me a link to the upwelling data for the NINO3.4 region that confirms your belief, David.
Regards,
Bob
While I do now know exactly where to look for data on the rates of upwelling in that area or any other, it is for sure that there are a combination of factors that are associated historically with what we now call the ENSO (El Nino/Southern Oscillation), among which are a slackening of the normal East to West wind flow in the tropical Pacific off the West Coast of South America, reduced upwelling of deep nutrient rich waters supplying the fisheries in that region, warming of the surface waters, increased clouds and rain, collapse of the fisheries due to the water being abnormally warm, oxygen and nutrient poor, etc.
Historically, the term originated from fisherman who noticed that these conditions often occurred in the late Fall, and especially around Christmas time.
Any text describing the ENSO or el nino is going to talk extensively about just what David is saying here.
El Niño: online meteorology guide (uiuc.edu)
Current understanding of what occurs during el nino events is of course far more complex than a simple cause and effect relationship in which a lack of upwelling causes the sea surface temps to warm, and in fact it is now thought that the warming at the surface occurs first, and that this then inhibits upwelling.
I personally think the whole story is more interwoven and complex with regard to causes and effects, and certainly we do not define el nino according to upwelling, but according to sea surface temps in a certain zone which is now carefully delineated.
Over the years, many descriptions of what occurs have been put forth, and the simplest to visualize may be the one that conceptualizes ENSO as like a big pile of warm water sloshing back and forth across the Pacific Basin, kind of like the way water can slosh back and forth in a bathtub.
So, what happens first?
Weakening of the gradient in the “normal” pressure regime of High Pressure in Eastern Pacific and Lower Pressure in the Western Pacific, resulting in slackening of the Trade Winds, which then allows a pool of warm water to slosh Eastward?
OK, sure, why not?
But what causes that pressure gradient to change across half the world for what may be years on end?
*shrugs shoulders*
Heck, I do not even know if chickens or eggs came first!
El Niño Events: results from weakening easterly trade winds (uiuc.edu)
Also not included is a color graphic of the “real” temperature so that readers can get a physical sense of whether the scary looking ”anomaly” color scheme is even worth discussing.
For example, 1 C is scary deep maroon red on the chart….but SST of 11 degrees instead of 10 degrees off, say, the Orkney Islands is not even going to change a fisherman’s plans for the week.
I did not see your comment before I made my one above.

I went looking for exactly such a map as soon as I read this article.
I included it in my comment above.
Here it is again:
Tom Abbot asks, “Doesn’t El Niño warm the Atlantic ocean similar to the way it warms the Pacific ocean?”
There are tropical Atlantic El Nino events but they are far weaker and fewer than those of the tropical Pacific. Any SST warming that takes place in the North Atlantic in response to an El Nino in the Pacific is a response to the changes in atmospheric circulation caused by the El Nino.
Regards,
Bob
Bob, could that be the Blob relocated to a different basin?
I miss Bob’s Blob Blog 🙂
“Any SST warming that takes place in the North Atlantic in response to an El Nino in the Pacific is a response to the changes in atmospheric circulation caused by the El Nino”
Pure handwaving. Got evidence?
It is pretty obvious to me Bob T. isn’t up to the job of supporting his handwaving.
Apparently Bob T and friends have no evidence.
This is what I was referring to:
https://www.aoml.noaa.gov/the-atlantic-nino-el-ninos-little-brother/
Think about it Tom, the high solar activity high TSI sun passed over the tropical Atlantic just the same as it did the tropical Pacific, so why would we expect that area to not warm up too under the same circumstance?
Your belief that high TSI is the cause of the El Nino is nothing more than “half-baked speculation based on a spurious correlation”.
No Mark, it’s nine years of hard science. You are wrong.
The Atlantic Niño manifests close to the Equator. What shows anomalous warming, particularly for this time of the year, is the North Atlantic gyre in its Eastern half.
The solar cycle influence on the ocean has caused these positive anomalies.
All the boreal summer northern ocean positive anomalies resulted from long duration high total solar irradiance during the northern-most excursion (aphelion) of the sub-solar point.
In 2023, TSIS TSI> my sun-ocean decadal warming threshold, and the ocean responded. Witness ocean solar supersensitivity:
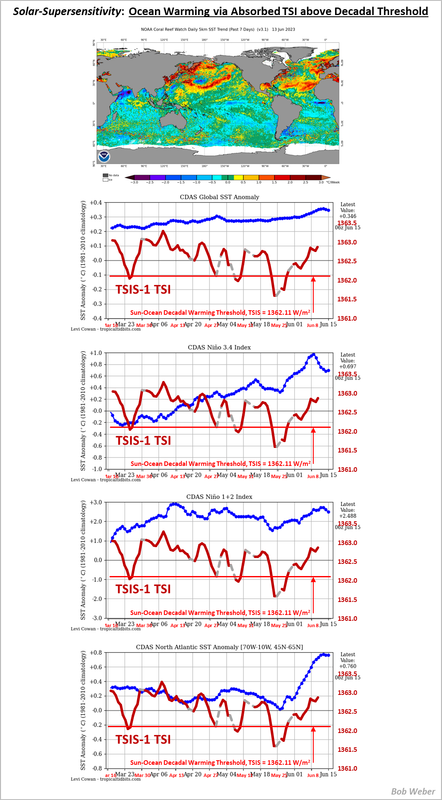
The same mechanism was in play six months ago in the southern ocean, when TSI was high during the perihelion, the southern ocean had bright red positive anomalies, not the north ocean.
The tropics warmed up from high solar irradiance during the northward passage of the sub-solar point since last December, warming the El Niño basin-wide up to today.
Now that the sub-solar point is moving southward, the tropics will warm even more from the currently high total solar irradiance, which will drive global warming even higher, as it has.
Stronger Niño anomalies will likely result by Dec/January as long as sunspots persists above my sun-ocean decadal warming threshold of 95 v2 SN. So far so good…
If solar cycle 25 peaks next year, look for extreme warmth again next year in the North Atlantic and elsewhere from high solar activity, along with sea ice extent losses.
The N. Atlantic will cool soon as the sub-solar point goes south.
If you project the 1982-2010 trend the new “extreme” warming is right on track, hence not extreme. One could ask why the pause instead. Also the time series is so short that this could all be part of a long term natural cycle. Including a chaotic cycle in ocean circulation.
“One could ask why the pause instead.”
‘Pauses‘ are due to irradiance being below the decadal warming threshold through solar minima.
The previous pause and the start of the second pause are seen with SORCE TSI in 2018:
It’s evident in the southern ocean, see (b) in the Rathore etal image w/SORCE TSI overlay:
Here in St John’s Newfoundland the high today is a very comfortable 24C (78F).
A week ago we had frost warnings. All depends on the wind direction.
We did have a ‘berg float by 2 weeks back.
Dear Gods what is this:
“”are likely due to a combination of dynamical factors, including stochastic weather anomalies, regional positive feedbacks and global-scale changes
Only The Sun can heat the water and that’s what it did.
It did that because, as the windmill farmers discovered, the Azores High floated a bit more northerly and easterly that it normally does this time of year meaning winds dropped, skies cleared and temps rise = as they do under any High Pressure Cyclonic System
Temps rose thro 2 mechanisms = the sun shone down and the descending air was heated via the Foehn/Lapse Rate Effect
The air descended because air was rising somewhere else.
That is where you go looking for the ‘rising SSTs’
You go looking for places where Low Pressure anticyclonic weather dominated during this period of warming
Straight up, the Canadian Fires are exactly the place.
What do those fires do if not create an immense amont of very buoyant air – bouyant via the double whammy of its high temperature but also because of the hot water vapour in contains.
Hence the flow of hot wet air coming off the fires, as it descended its Thermal Gradient by moving north and east, reduced air pressure north of the Azores High and ‘dragged it’ into that low pressure hole.
Do remember, Hot Air Balloons work because of the hot water vapour they contain = hot wet air is vastly more buoyant that hot dry air
What goes up. must come down’
Don’t make it complicated
You know me, you why the forest burned.
i.e. It was, it is, starving hungry and thirsty. It’s immune system is wrecked, it cannot defend itself any more.
Like all of us.
Death is a lower energy state.
However moist buoyant air increases atmospheric emissivity, whereas dry buoyant air does not. Moist buoyant air has radiative losses to space, resulting in a net transport of energy from surface to space. This is radiative-convective process.
Dry buoyant air does no such thing. Drylands rely on surface radiative transmission, and are limited to pure radiative equilibrium process.
What caused the Azores High to move north? What caused the air that sank over the North Atlantic to rise somewhere else before it sank there? What caused the causes of the causes of those causes? It seems to me that weather and climate events have no proximate causes other than the fact that the surface of the earth is heated by the sun, then air and water and everything else just do their natural, chaotic dance.
If one plots a series of random number between one and one hundred, and overlays a smoothed trend line, the smoothed line moves up and down in a quasi cyclical manner. If each point is taken as the average surface temperature for a year, there can be an overall trend line that rises and falls but rises overall for 100 year or more. The graph can look very similar to a plot of global average temperatures. Yet the only cause of the trend and the cycles is the fact than random stuff is random.
Weather and climate are random and inherently unpredictable in any but non-granular ways. It will be N °C colder next December 1st than it is today, but the value of N can only be approximated even to with a perfectly programmed, super-duper, super computer.
It’s a fine article if you like that sort of thing. And I do. Dr. Curry knows far more about climate and weather than I ever will. Enough to offer some reasonable explanations for the current warming in the North Atlantic, but not enough to have predicted it. Because random processes are unpredictable. I wouldn’t want it any other way, but I would be very happy if I could predict the stock market even just slightly better than anyone else!
It’s been a wet spring and early summer here in north central Woke-achusetts. Temperature seems normal to me- haven’t checked any sources. But…. my garden, lawn, trees and shrubs are growing better than ever. Amazingly, my garden, with many species of vegies and flowers so far shows no sign of pests. Usually by now, especially with a lot of rain, we usually see signs of pests.
The first rule of garden pests is don’t talk about garden pests.
Now you did it, go get your sprayer.
😀
All my garden pests live next door and kick footballs into my garden!
I notice in my part of Colorado that moths were worst than normal, as are mosquitoes. The weather continues to be wetter than normal but high temperatures are beginning to heat up. There are lots of small bugs now that have a propensity to enter my mouth as I bike ride.
Tomato plants are doing great as is my lawn. Fruit trees have lots of foliage but not much fruit. My small cherry tree has only a few. On the other hand, my grape vines are growing out of control with lots of bunches of grapes.
The linden trees are flowering like crazy now and smell great but there are few bees to take advantage of their nectar. Grass hoppers are abundant but not as bad as last year, though it’s still early. I’ve seen lots of butterflies. I hope that the bee population grows through the summer.
The hawk nest in a tree in my neighbor’s yard has at least two babies, which is great as the hawks keep the rabbits down, as well as other small rodents (and some birds).
Eastern Ontario, too, is surprisingly almost free of insects. We have a lush green backyard and can sit out with little annoyance of mosquitoes and flies. I hope this isn’t something bad?
I think France – even Paris – has added to global temperatures this past week
It would be a good time for Macron’s security detail to strike.
STORY TIP:- https://www.bbc.co.uk/news/science-environment-66084543
Interesting to note that according to the graph in this article 2023 is very much a one-off, proving nothing; the averages haven’t previously been nearly as high since 1976 (yes, I remember it well!) and before that some time in the 1930s (which I don’t). More junk journalism from the Beeb and meaningless without any indication of average max and average min. I wonder why they’re not shown…
23AD was hotter everywhere in Britannia…
The HADCET max and min values for CET for June 1976 have been reduced by 0.11C to help make the value easier to beat.
I find it difficult to believe that anyone would call that hot.
At least comments to the article are allowed.
Whatever the cause turns out to be, the Atlantic is still dumping a lot of heat right now. When this is over, the Atlantic will turn cooler than normal for a while.
Slightly off topic: I listened to the National Public Radio last week, and when they refer to a heat wave in Texas, they never specify a temperature. Always a “heat index”, I guess that it must yield bigger numbers.
The heat index does give bigger numbers, but it is also relevant because the heat index is telling us how much moisture is in the air, and it takes more out of a person to work outside in high humidity than it does in low humidity.
Can we rule out the heavy hand of data fiddlers, desperate for global warming no matter what it takes? Paul Homewood discussed a recent flurry of heavy jiggering of the sacred CET: cooling the 70s to 90s (hey, they’ve already used the former values successfully to scare us with the heat threat to life on earth and don’t need old numbers anymore) and warming the the last couple of decades to cook phony runaway warming into the present (where the fiddlers have had a nightmare of a couple of decades of failed anomaly forecasts, and the Dreaded Pause).
https://i0.wp.com/wattsupwiththat.com/wp-content/uploads/2023/07/image_thumb-17.webp?w=600&ssl=1
Ya see, with the discipline of the UHA satellite temperatures for the present, it’s the only fiddle available to them. Otherwise, unbound, they would just put any numbers the needed for the present. Watch for several years of further tiny changes to these numbers going forward. They use the boiling frog adjustments on a continuing basis. Maybe Christopher Monckton could mount a defence of this sacred piece of living British history!
I think those increases are going to need to get slightly bigger and bigger as we move forward but that’s just my opinion. I suggest we call the ‘Met Office’ the ‘Adjustment Bureau’ from now on – Phillip K Dick would be proud.
I am very thankful that I stopped regularly blogging about ENSO here, because the number of comments on this thread that misrepresent El Nino events, their causes and their effects would have kept me working for days.
Regards,
Bob
Well everyone needs a hobby!
If you’re talking about me you’ve obviously got nothing to say otherwise you’d have said it Bob!
The current El Niño was predicted by me in two presentations over a year ago based on sunspot number, one for the Sun-Climate symposium, and the other for the AGU Frontiers in Hydrology.
This next image was presented in late May, when the 365day average SN was only 54, and updated for June 2022. Today, 365d SN= 111, very close to the solar cycle #24 maximum 365d average.
This matters because of the strong link between solar activity and ocean warming/cooling.
The eastern Pacific and the Niño regions averaged a ~1°C asymmetric SST increase/decrease during the last nine solar cycles, synchronized to the solar maxima/minima levels of sunspots, with the odds against this recurring without solar activity of 1.6×10^19 to 1, ie, is impossible.
This solar cycle has already provided the tenth tropical step-up in a row, making for even higher odds against this repeating mechanism being independent of solar activity.
The remaining science tasks for this solar cycle include predicting the maximum temperature, and the subsequent temp drop after TSI eventually falls below the decadal warming threshold.
Who is being Mr. Passive-Aggressive here today Bob T?
Bob Weber, you began your lengthy (unread beyond first paragraph, because it made me laugh) comment with, “The current El Niño was predicted by me in two presentations over a year ago based on sunspot number…”
You predicted an El Nino after back-to-back-to-back La Ninas? Sorry. That makes me laugh.
Regards
Actually Bob I’m the one laughing at you. In 2018 I also predicted the solar cooling into the La Niña, so I have both things to talk about.
You’re not comprehending anything, because your mind is filled with nonsense.
You believe the ocean recharged during the La Niña, right?
Nothing like that happened. The global SST stalled until 365d ave SN>95.
The ocean only responded to high solar irradiance, like I showed you, pulling the tropics out of La Niña into El Niño, for at least the tenth straight time in a row in synch with solar cycle activity again.
Predicting a La Nina after a massive El Nino. Amazing.
You people are taking my climate comments out of context.
I was told twice in 2018 and 2020 by a NASA Goddard sun-climate scientist to bring my work to WUWT.
My work provides the reason for the changes between major La Niña and El Niño events, ie, sunspot activity, and my comments are about how to gauge ENSO activity wrt the actual changes in solar energy, which mostly everyone else has ignored.
Furthermore, this understanding provides for the opportunity to do predictions, which I have done and reported on here since 2014.
If you guys cannot cope with that, you are in trouble, in fact all of skepticism is in trouble, because you can’t handle the truth.
Your’s and Bob T’s thinking are from the past, the 1990-early 2000s, when the passive ENSO model was introduced. It is wrong.
Your comment was therefore completely ignorant.
It would be like the two of you making fun of sunspot forecasters.
Would you or Bob T say something like you did to me to them:
“Predicting a solar max comes after the solar min, duh, you guys are amazing.” /sarc
Science marches on, but you two are frozen in 1990s viewpoints.
I miss your ENSO analyses. However, I remember much of the science and analyses and kept copies of a number of your postings, but couldn’t afford your big book. As always, cranks continue to pester you with their fanciful speculations.
In my experience, the less serious the science, the more acerbic their reactions to anyone who is skeptical of their work.
No Mark, you have not shown me that you are skeptical of my work, because you don’t make any serious comments at all, and neither does Bob Tisdale.
So quite frankly the two of you are a couple of lightweight jokers.
Bob Tisdale had his nads clipped by a girl named Sue Hotwhopper, that’s why he’s not bothering to do anything other than his typical lightweight commentary here.
Furthermore, Dave Fair, if you are referring to me, you better think about posting some science if disagree with me, otherwise you’re just another handwaver.
No mention of the words “jet stream”?
Jet streams are very important. One of these days we will figure out why they do what they do. I don’t think CO2 has anything to do with them.
https://www.bbc.co.uk/news/science-environment-66084543 it’s official our record June temperature was due to climate change. No surprise there.
Ugh. We had 3, maybe 4 uncomfortably warm days and quite a few cooler than normal days and yet, it’s the hottest evah! Must be purely for consumption in the London concrete canyon’s.
Reading the comments on the BBC website is enlightening.
“are likely due to” so a guess then … perhaps an educated guess … but a guess none the less … got to love that climate “science” … its guesses all the way down …
Extreme Warm North Atlantic Temperatures affecting the Weather where i grew up in the Netherlands: It is unseasonably HOT over there these days:
Back when I was there in the 70’s July would be in the Mid 70’s Fahrenheit, I remember, Nice!
Results for Arnhem, Netherlands
∙ Choose area
Search ResultsWeather Resul 66°F°CPrecipitation: 2%
Humidity: 49%
Wind: 11 mph
Tomorrow: 67F
Wednesday: 70F
Thursday: 73F
I noticed that Greenland had had a large melt in the north yesterday while the South East had still managed a mass gain. I did wonder if there was some weather related cause. DMI
I was expecting Justin Rowlatt to be on the news but he chose to witter on about climate change killing fish in canals, ponds and rivers. No doubt we’ll have that joy later this week
A Juiced-up North Atlantic atmosphere should provide abundant moisture to provide large, anomalously large positive interior SMB this fall and winter.
Very active solar magnetics the past 6 months enhanced UV insolation to all the world’s oceans. F10.7 readings much higher than predicted for this point in SC25.
I don’t think this added energy input can be ignored on ocean heating. Nothing to do with CO2 scam.
Where do you get this enhanced UV radiation from?
The entire solar spectrum increases from the solar minimum to the maximum. We are currently in the solar maximum period, the top of the cycle, when total solar irradiance is high along with UV wavelengths. The extreme UV (EUV) correlates well with the whole UV spectrum and is estimated daily by measuring MgII in the solar atmosphere.
TSI is going gangbusters this year, above the warming threshold, and we are about only 33% of the way through the solar warming period as compared to solar cycle #24.
The ocean UV heating that Joel mentioned is still just a small portion of the absorbed solar spectrum by the ocean, so it is important to also use total solar irradiance, which covers a very high percentage of the whole solar spectrum.
As I’ve been warning people since last year, the high sunspot activity will heat the ocean until it and the atmosphere breach the dreaded 1.5°C ‘limit’. Count on it.
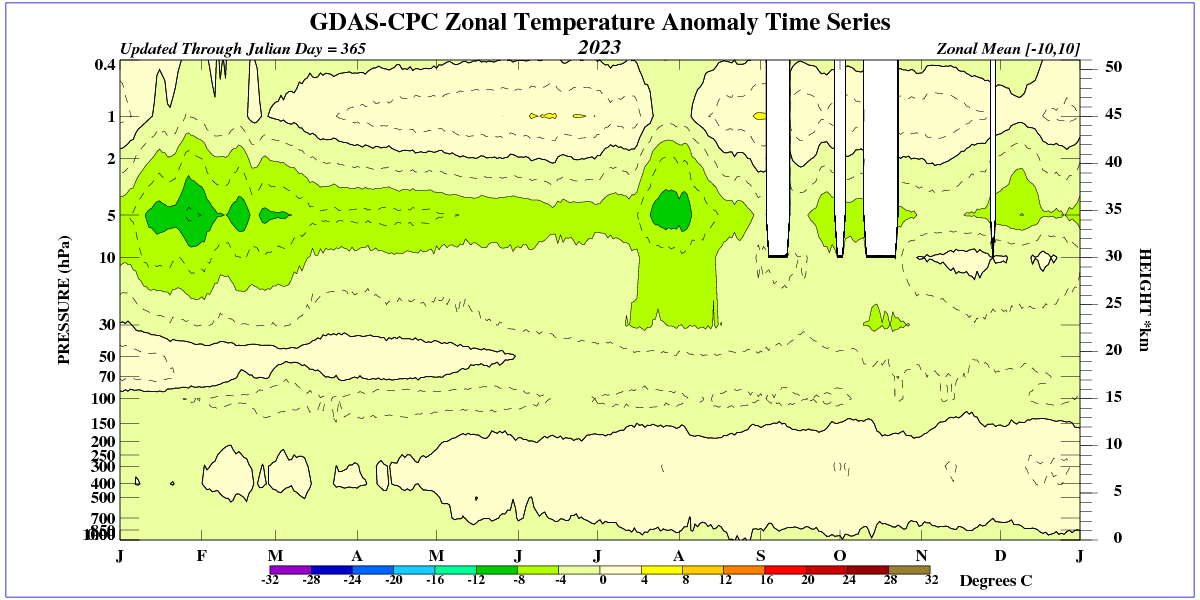
Why is UVB radiation increasing near the surface? Because the amount of ozone decreases during weak solar cycles, as indicated by the drop in temperature in the upper stratosphere. You can see that we are now at the peak of the 25th cycle, because the temperature in the upper stratosphere has increased. Nevertheless, solar activity is low.
“I don’t think this added energy input can be ignored on ocean heating.”
You are 100% right Joel. In fact spaceweather.com posted this image showing how this solar cycle sunspots last month reached levels not seen since 2002.
I’m just waiting for all the people who argued with me over the same basic issue to come here and give you an equally hard time as they gave me, after I provided evidence for my claims.
Sudden, sharp increases in temperature cannot be associated with GHG warming. Any warming associated with GHGs is a multi-decadal process, as postulated in GHG warming theory.
If someone could translate this into English please.
That water is so incredibly “warm”, that if you fell into it, and you were a very hardy individual, you might survive for an hour or more before you died of hypothermia.
More hurricanes blocked in the eastern equatorial Pacific will cause surface temperatures in the region to drop.

Autumn weather will prevail in the UK.
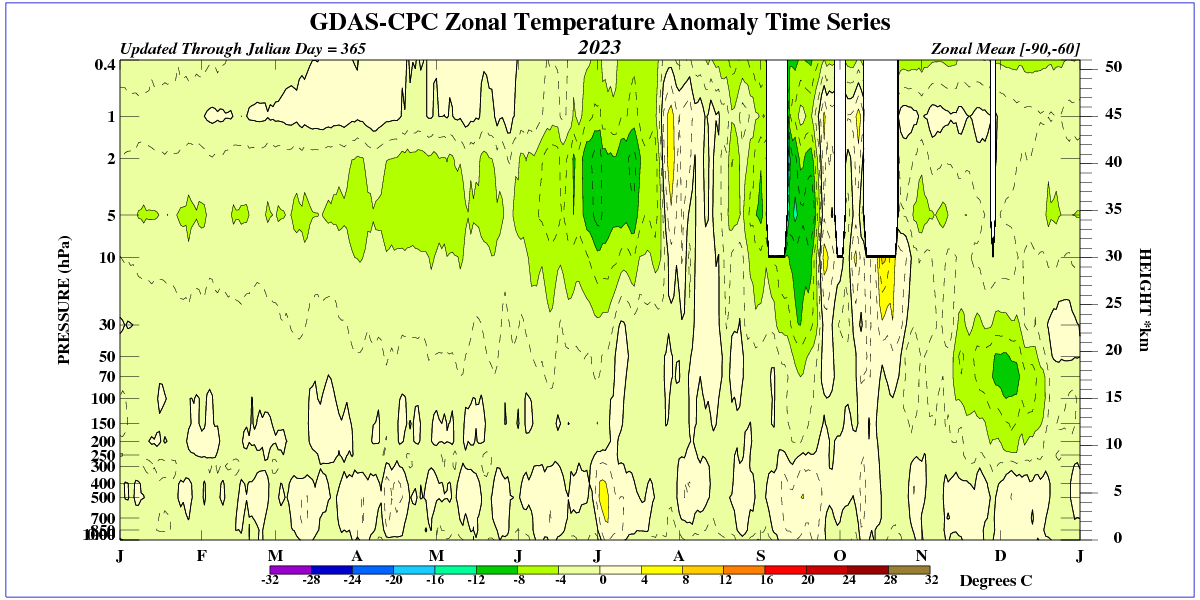
Interestingly, although the stratospheric polar vortex in the south is strong, a steady weakening in the lower stratosphere over the South Pacific is evident. This will result in a stronger cooling of the Pacific during the winter.
